Copyright
©The Author(s) 2024.
World J Gastrointest Oncol. Jul 15, 2024; 16(7): 3341-3349
Published online Jul 15, 2024. doi: 10.4251/wjgo.v16.i7.3341
Published online Jul 15, 2024. doi: 10.4251/wjgo.v16.i7.3341
Figure 1 Magnetic resonance imaging of the patient with primary hepatic angiosarcoma.
A: Axial T1-weighted image; B: Axial T2-weighted image; C: Diffusion-weighted imaging (DWI); D: Axial T1-weighted image after 150 s enhancement; E: Axial T1-weighted image after 3-min enhancement; F: Axial T1-weighted image after 6-min enhancement. Multiple lamellar signal shadows in the liver with long T1-weighted signals and long T2-weighted signals are shown. A lesion showing diffusion restriction and a high signal on DWI. The lesions showed progressive enhancement in the delayed phase.
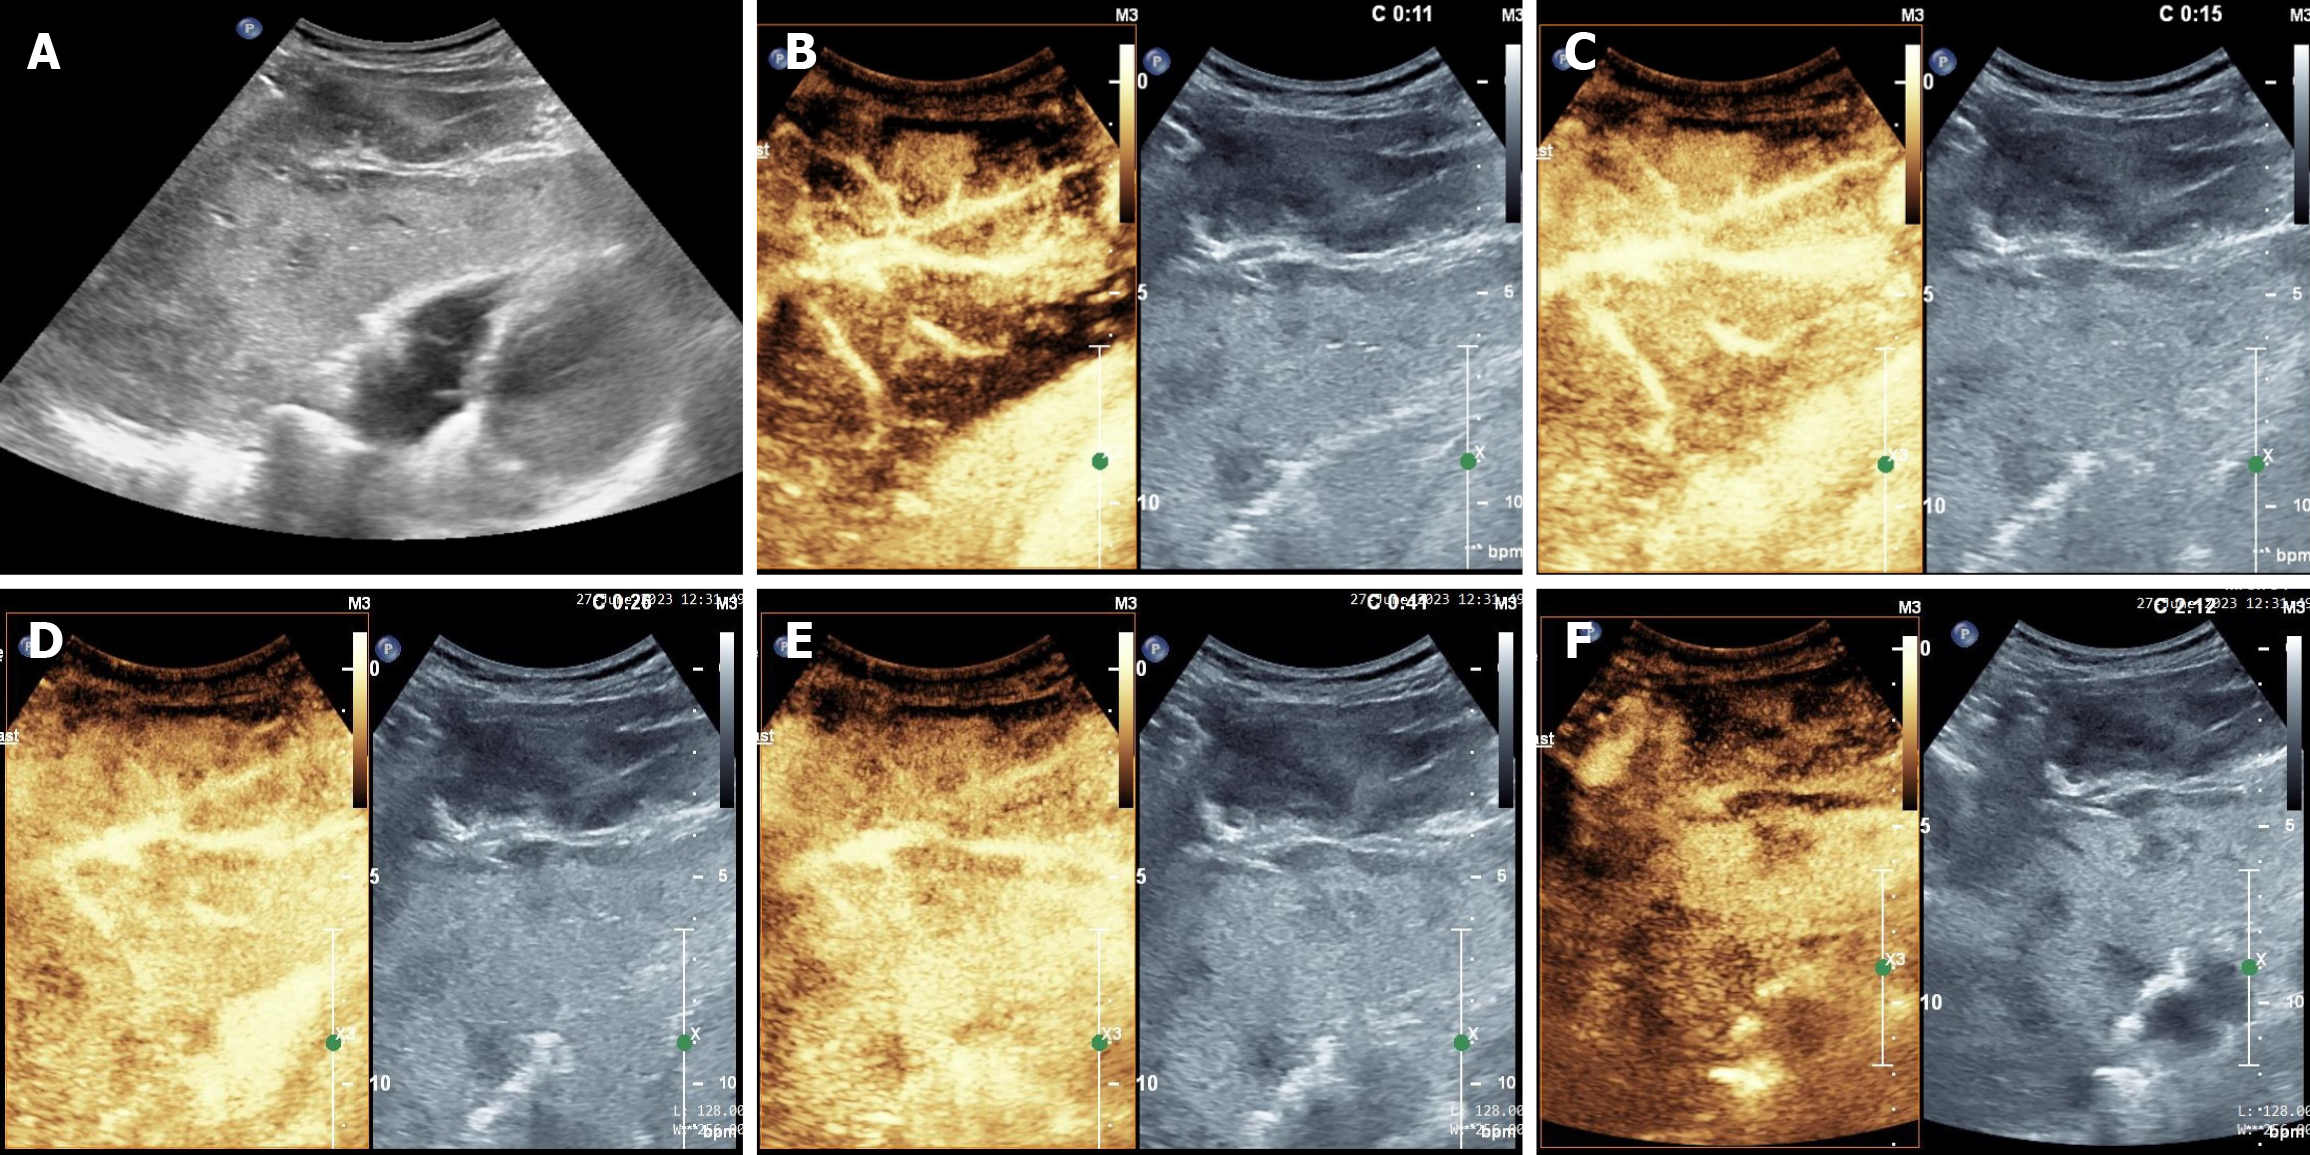
Figure 2 Gray-scale ultrasound and contrast-enhanced ultrasonography of the patient with primary hepatic angiosarcoma.
A: The gray-scale ultrasound image showing a patchy hypoechoic area in the liver with an ill-defined border; B: The manifestation of contrast-enhanced ultrasonography (CEUS) at 11 s of arterial phase; C: The manifestation of CEUS at 15 s of arterial phase; D: The manifestation of CEUS at 26 s of the arterial phase; E: The manifestation of CEUS at 41 s of the portal venous phase; F: The manifestation of CEUS after 120 s of the delayed phase. In the arterial phase, the lamellar hypoechoic area exhibited heterogeneous hyperenhancement along the hepatic pedicle structure, and the contrast agent in this area washed-out mildly and rapidly, with no invasion of the hepatic pedicle structure. In the portal venous phase, the area showed slight hypoenhancement, and well-defined hepatic pedicle structures were visible. In the delayed phase, the enhanced region changed to significant hypoenhancement and was significantly lower than the surrounding normal liver parenchyma.
Figure 3 The time-intensity curve of quantitative analysis after contrast-enhanced ultrasonography of the patient with primary hepatic angiosarcoma.
A: Regions of interest of the lesion (orange circle) and surrounding hepatic parenchyma (blue circle) were placed manually; B: The time-intensity curve showed that the contrast agent rapidly washed-in within the lesion and rapidly washed-out.
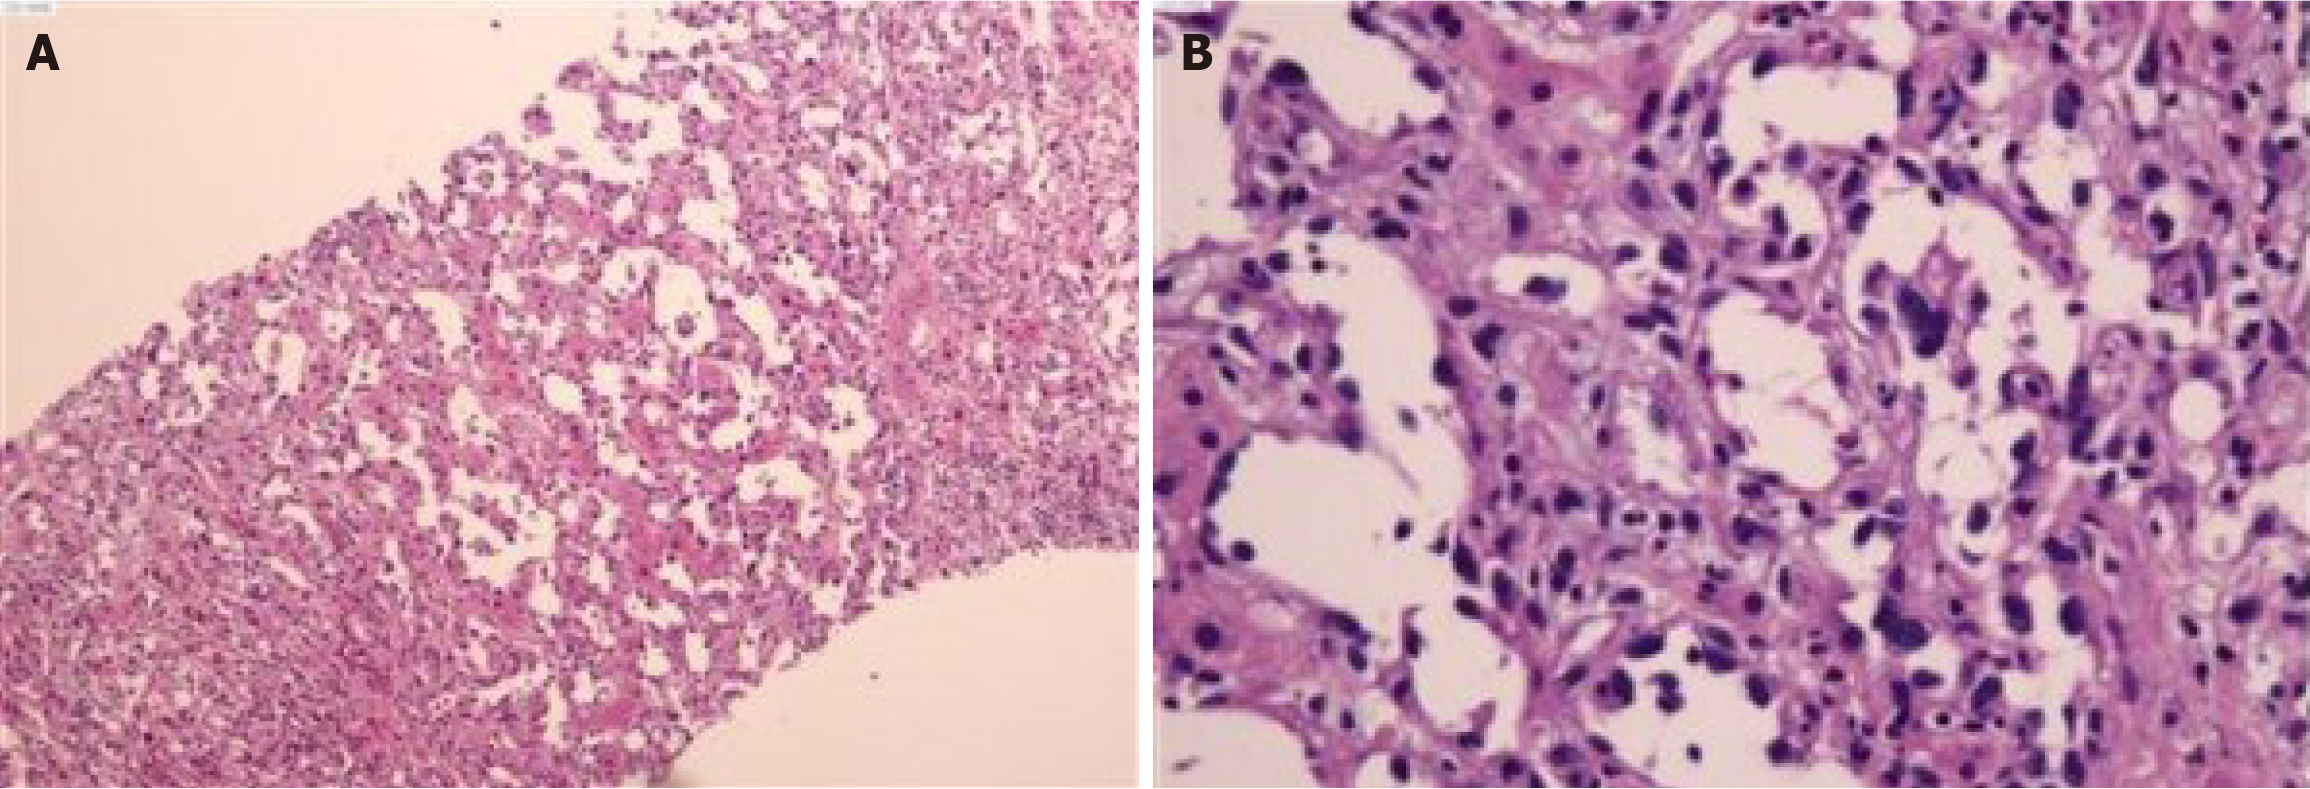
Figure 4 Hematoxylin-eosin staining of the patient with primary hepatic angiosarcoma.
Histologic findings revealed sinusoidal dilatation of blood vessels under the microscope, with dysplastic cells, marked pleomorphism, and pigmented nuclei. A: Magnification, (× 40); B: Magnification, (× 100).
Figure 5 Magnetic resonance imaging of the patient with primary hepatic angiosarcoma four months after diagnosis.
A: Axial T1-weighted image; B: Axial T2-weighted image; C: Diffusion-weighted imaging; D: Axial T1-weighted image in the portal venous phase; E: Axial T1-weighted image in the delayed phase; F: Coronal T1-weighted image in the delayed phase. A large mass with mixed T1-weighted signals and mixed T2-weighted signals was observed in the right lobe of the liver. Multiple nodules with long T1-weighted signals and long T2-weighted signals were also observed in the liver. The large mass in the right lobe of the liver showed peripheral enhancement with hemorrhage. The giant mass compressed some branches of the right branch of the portal vein and the inferior vena cava. The remaining nodules showed progressive enhancement in the delayed phase.
- Citation: Lin XJ, Luo HC. Rare infiltrative primary hepatic angiosarcoma: A case report and review of literature. World J Gastrointest Oncol 2024; 16(7): 3341-3349
- URL: https://www.wjgnet.com/1948-5204/full/v16/i7/3341.htm
- DOI: https://dx.doi.org/10.4251/wjgo.v16.i7.3341


