Copyright
©The Author(s) 2024.
World J Gastrointest Oncol. Jul 15, 2024; 16(7): 3299-3307
Published online Jul 15, 2024. doi: 10.4251/wjgo.v16.i7.3299
Published online Jul 15, 2024. doi: 10.4251/wjgo.v16.i7.3299
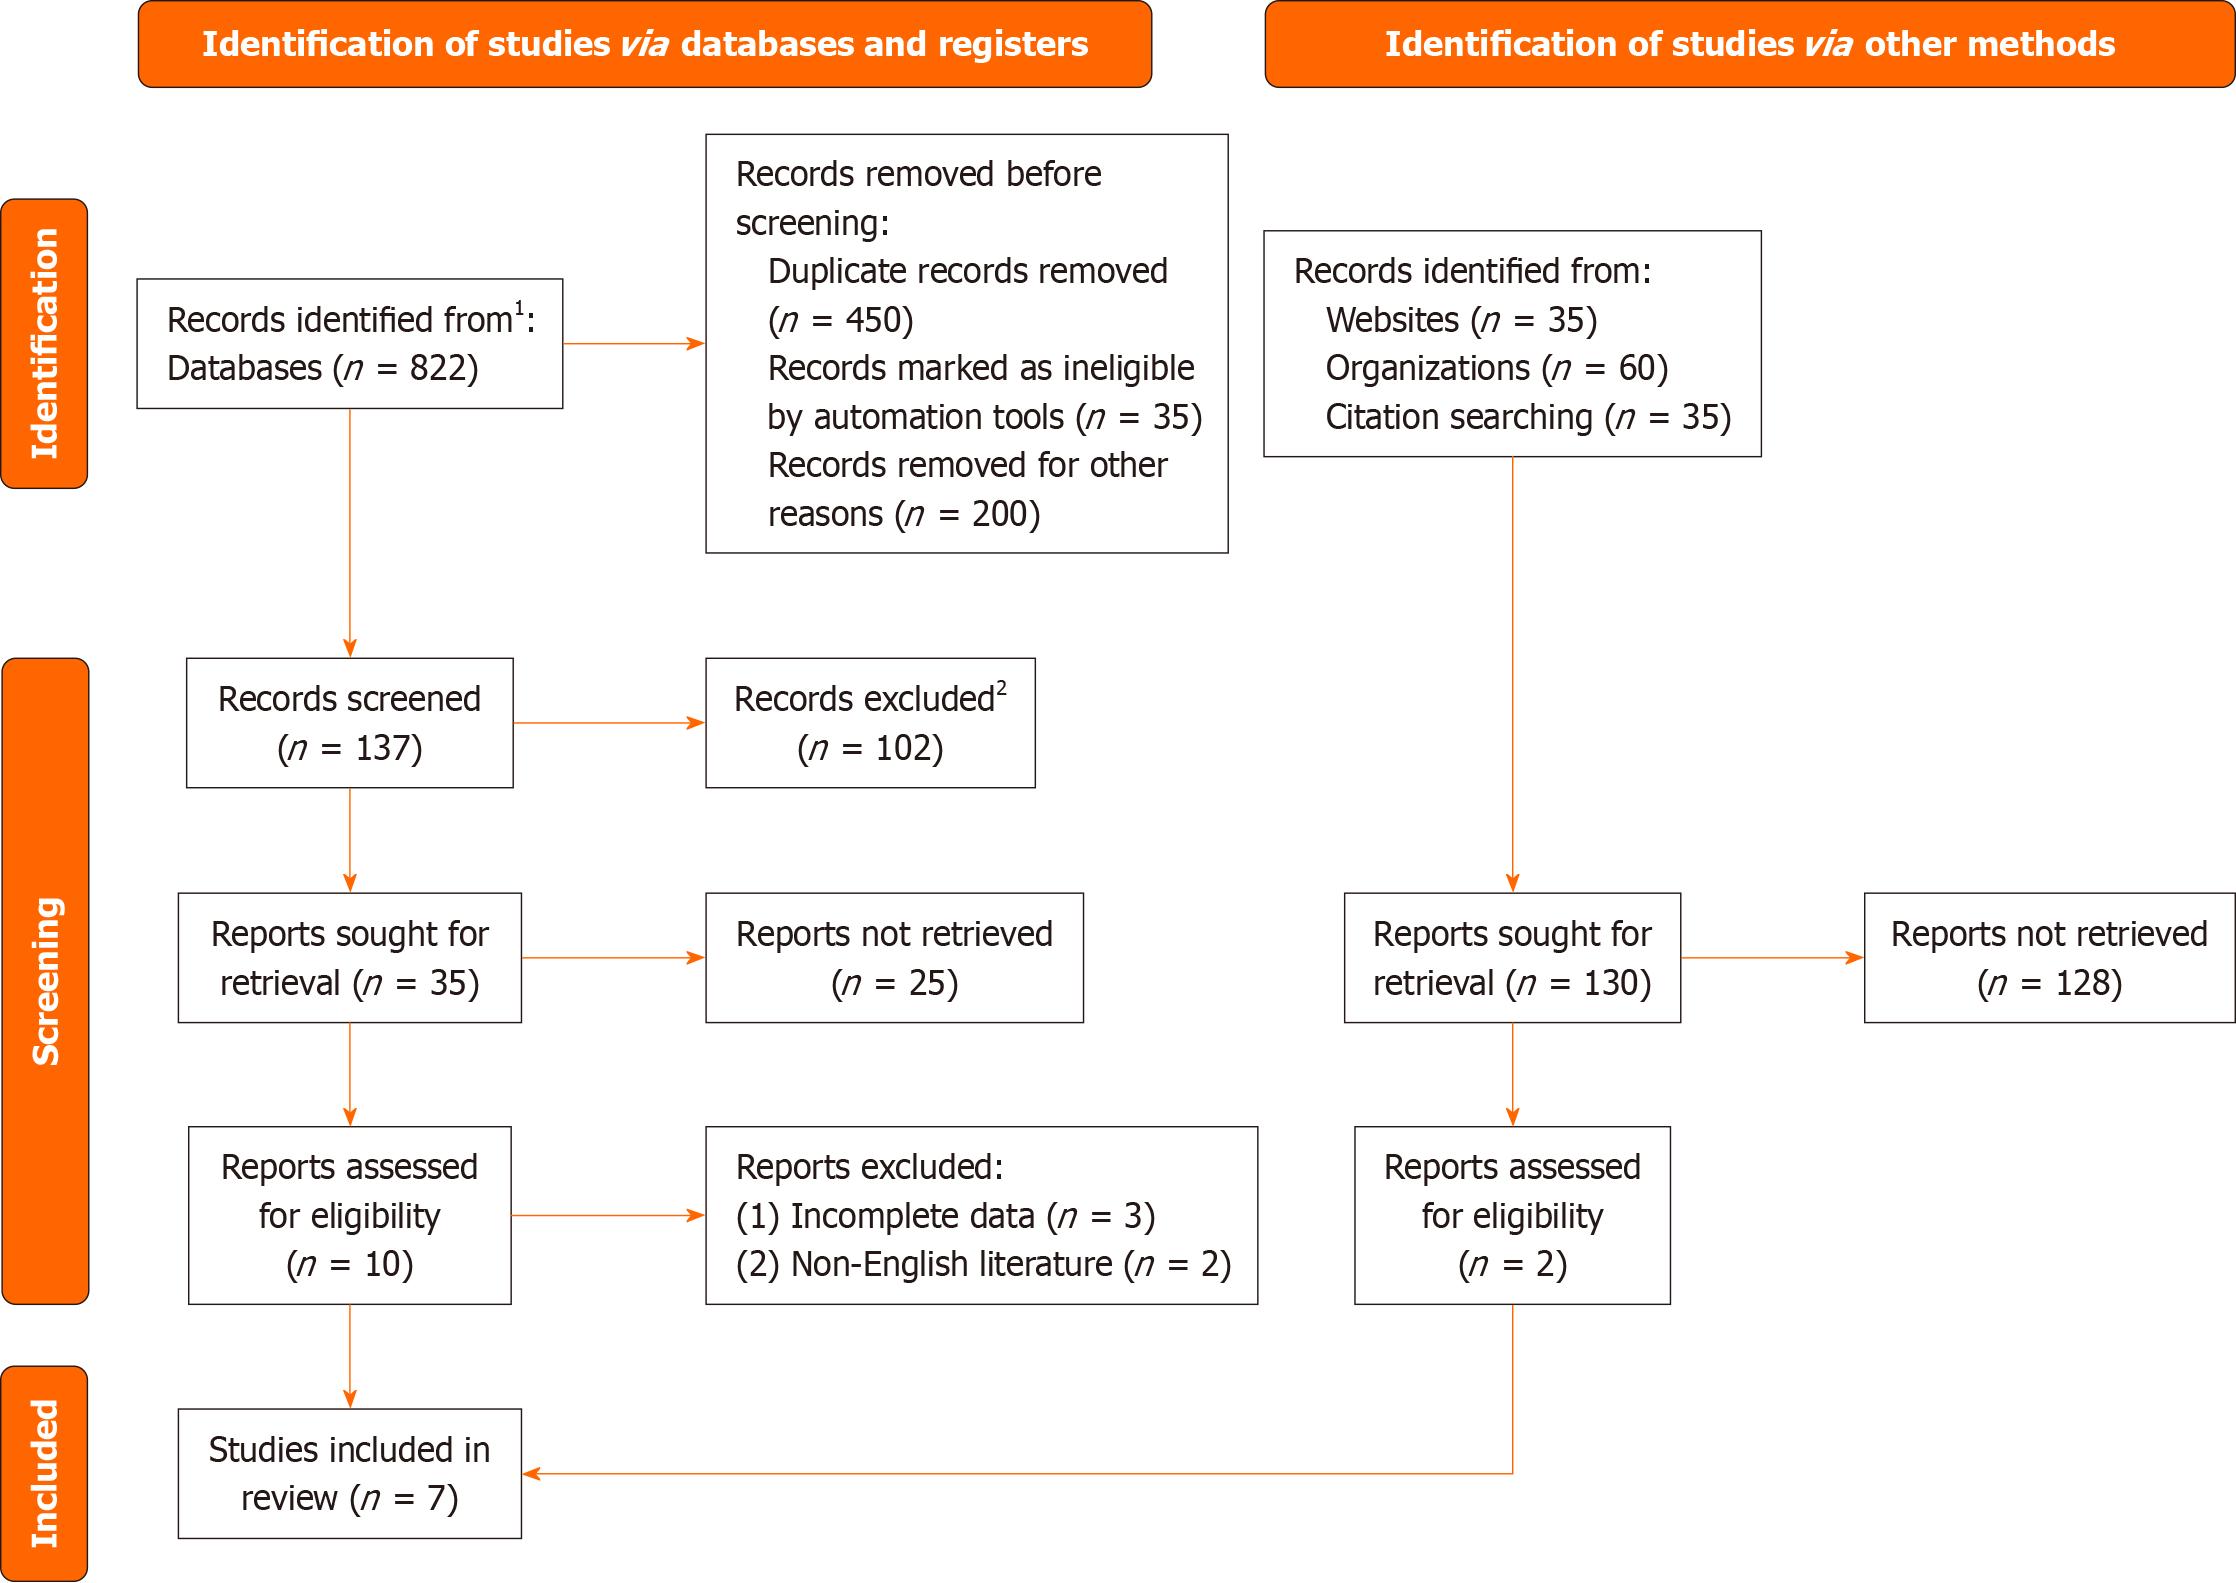
Figure 1 Document retrieval flow chart.
1Consider, if feasible to do so, reporting the number of records identified from each database or register searched (rather than the total number across all databases/registers). 2If automation tools were used, indicate how many records were excluded by a human and how many were excluded by automation tools.
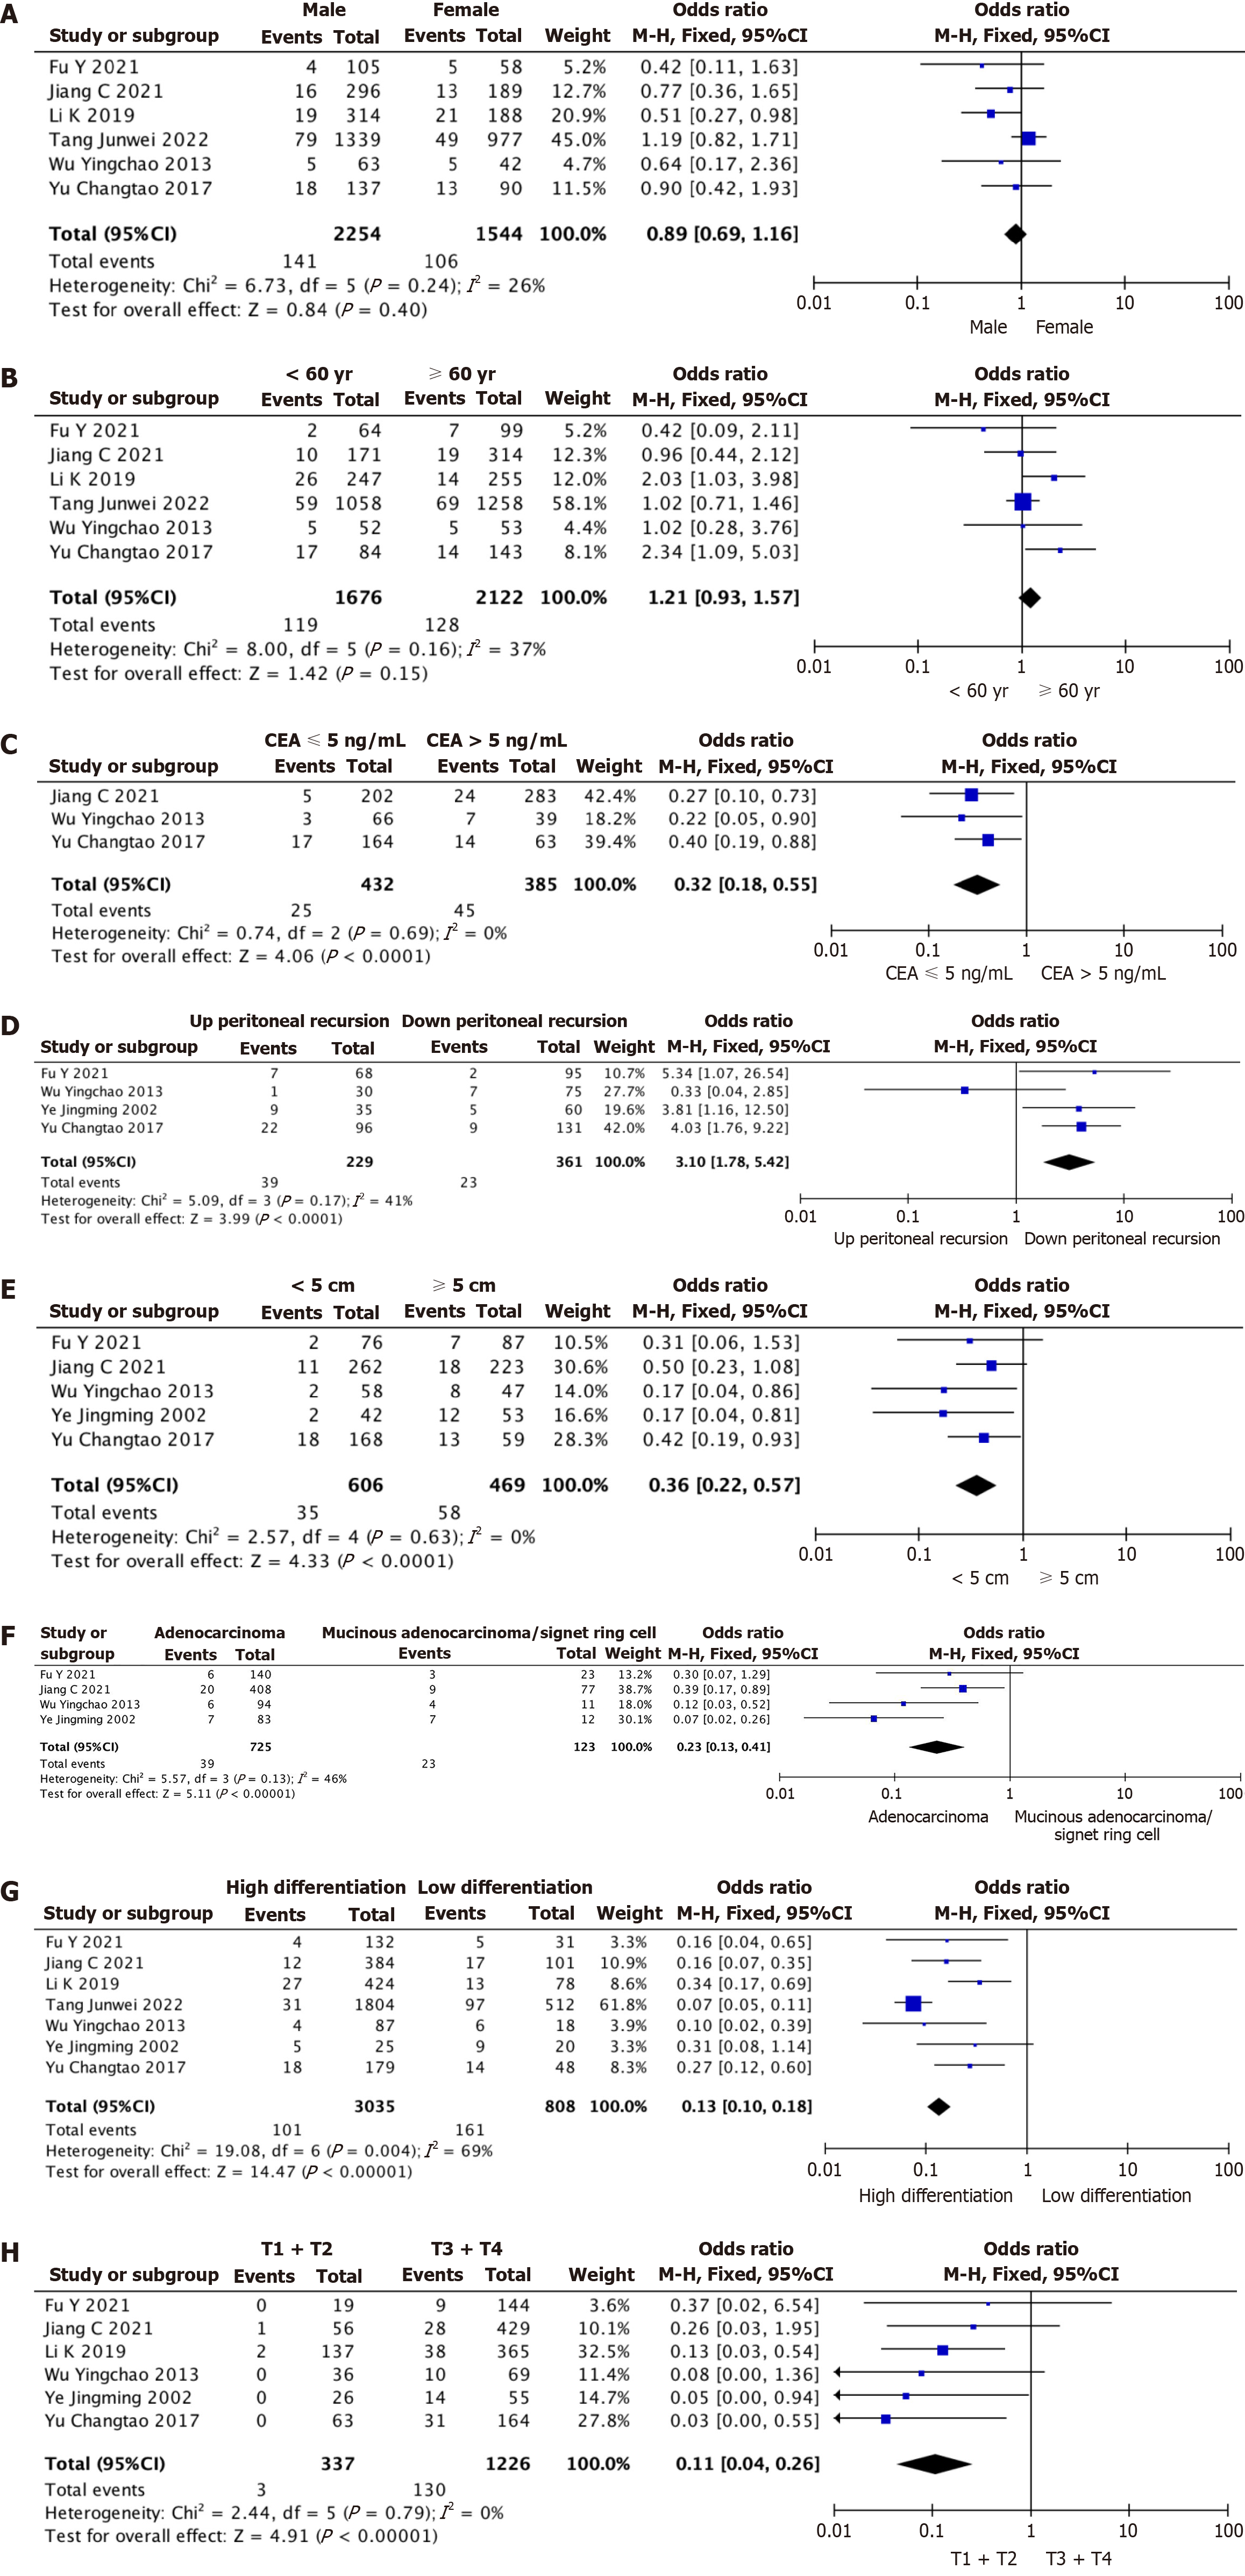
Figure 2 Meta-analysis.
A: Meta-analysis of gender as a risk factor; B: Meta-analysis of age as a risk factor; C: Meta-analysis of preoperative carcinoembryonic antigen level as a risk factor; D: Meta-analysis of tumor location as a risk factor; E: Meta-analysis of tumor size as a risk factor; F: Meta-analysis of pathological types as risk factors; G: Meta-analysis of tumor differentiation degree as a risk factor; H: Meta-analysis of T stage as a risk factor. CI: Confidence interval; CEA: Carcinoembryonic antigen.
Figure 3 A biased funnel plot analysis.
A: Biased funnel plot of gender as a risk factor; B: Biased funnel plot of age as a risk factor. OR: Odds ratio.
- Citation: Wang Q, Zhu FX, Shi M. Clinical and pathological features of advanced rectal cancer with submesenteric root lymph node metastasis: Meta-analysis. World J Gastrointest Oncol 2024; 16(7): 3299-3307
- URL: https://www.wjgnet.com/1948-5204/full/v16/i7/3299.htm
- DOI: https://dx.doi.org/10.4251/wjgo.v16.i7.3299


