Copyright
©The Author(s) 2024.
World J Gastrointest Oncol. Jul 15, 2024; 16(7): 3193-3210
Published online Jul 15, 2024. doi: 10.4251/wjgo.v16.i7.3193
Published online Jul 15, 2024. doi: 10.4251/wjgo.v16.i7.3193
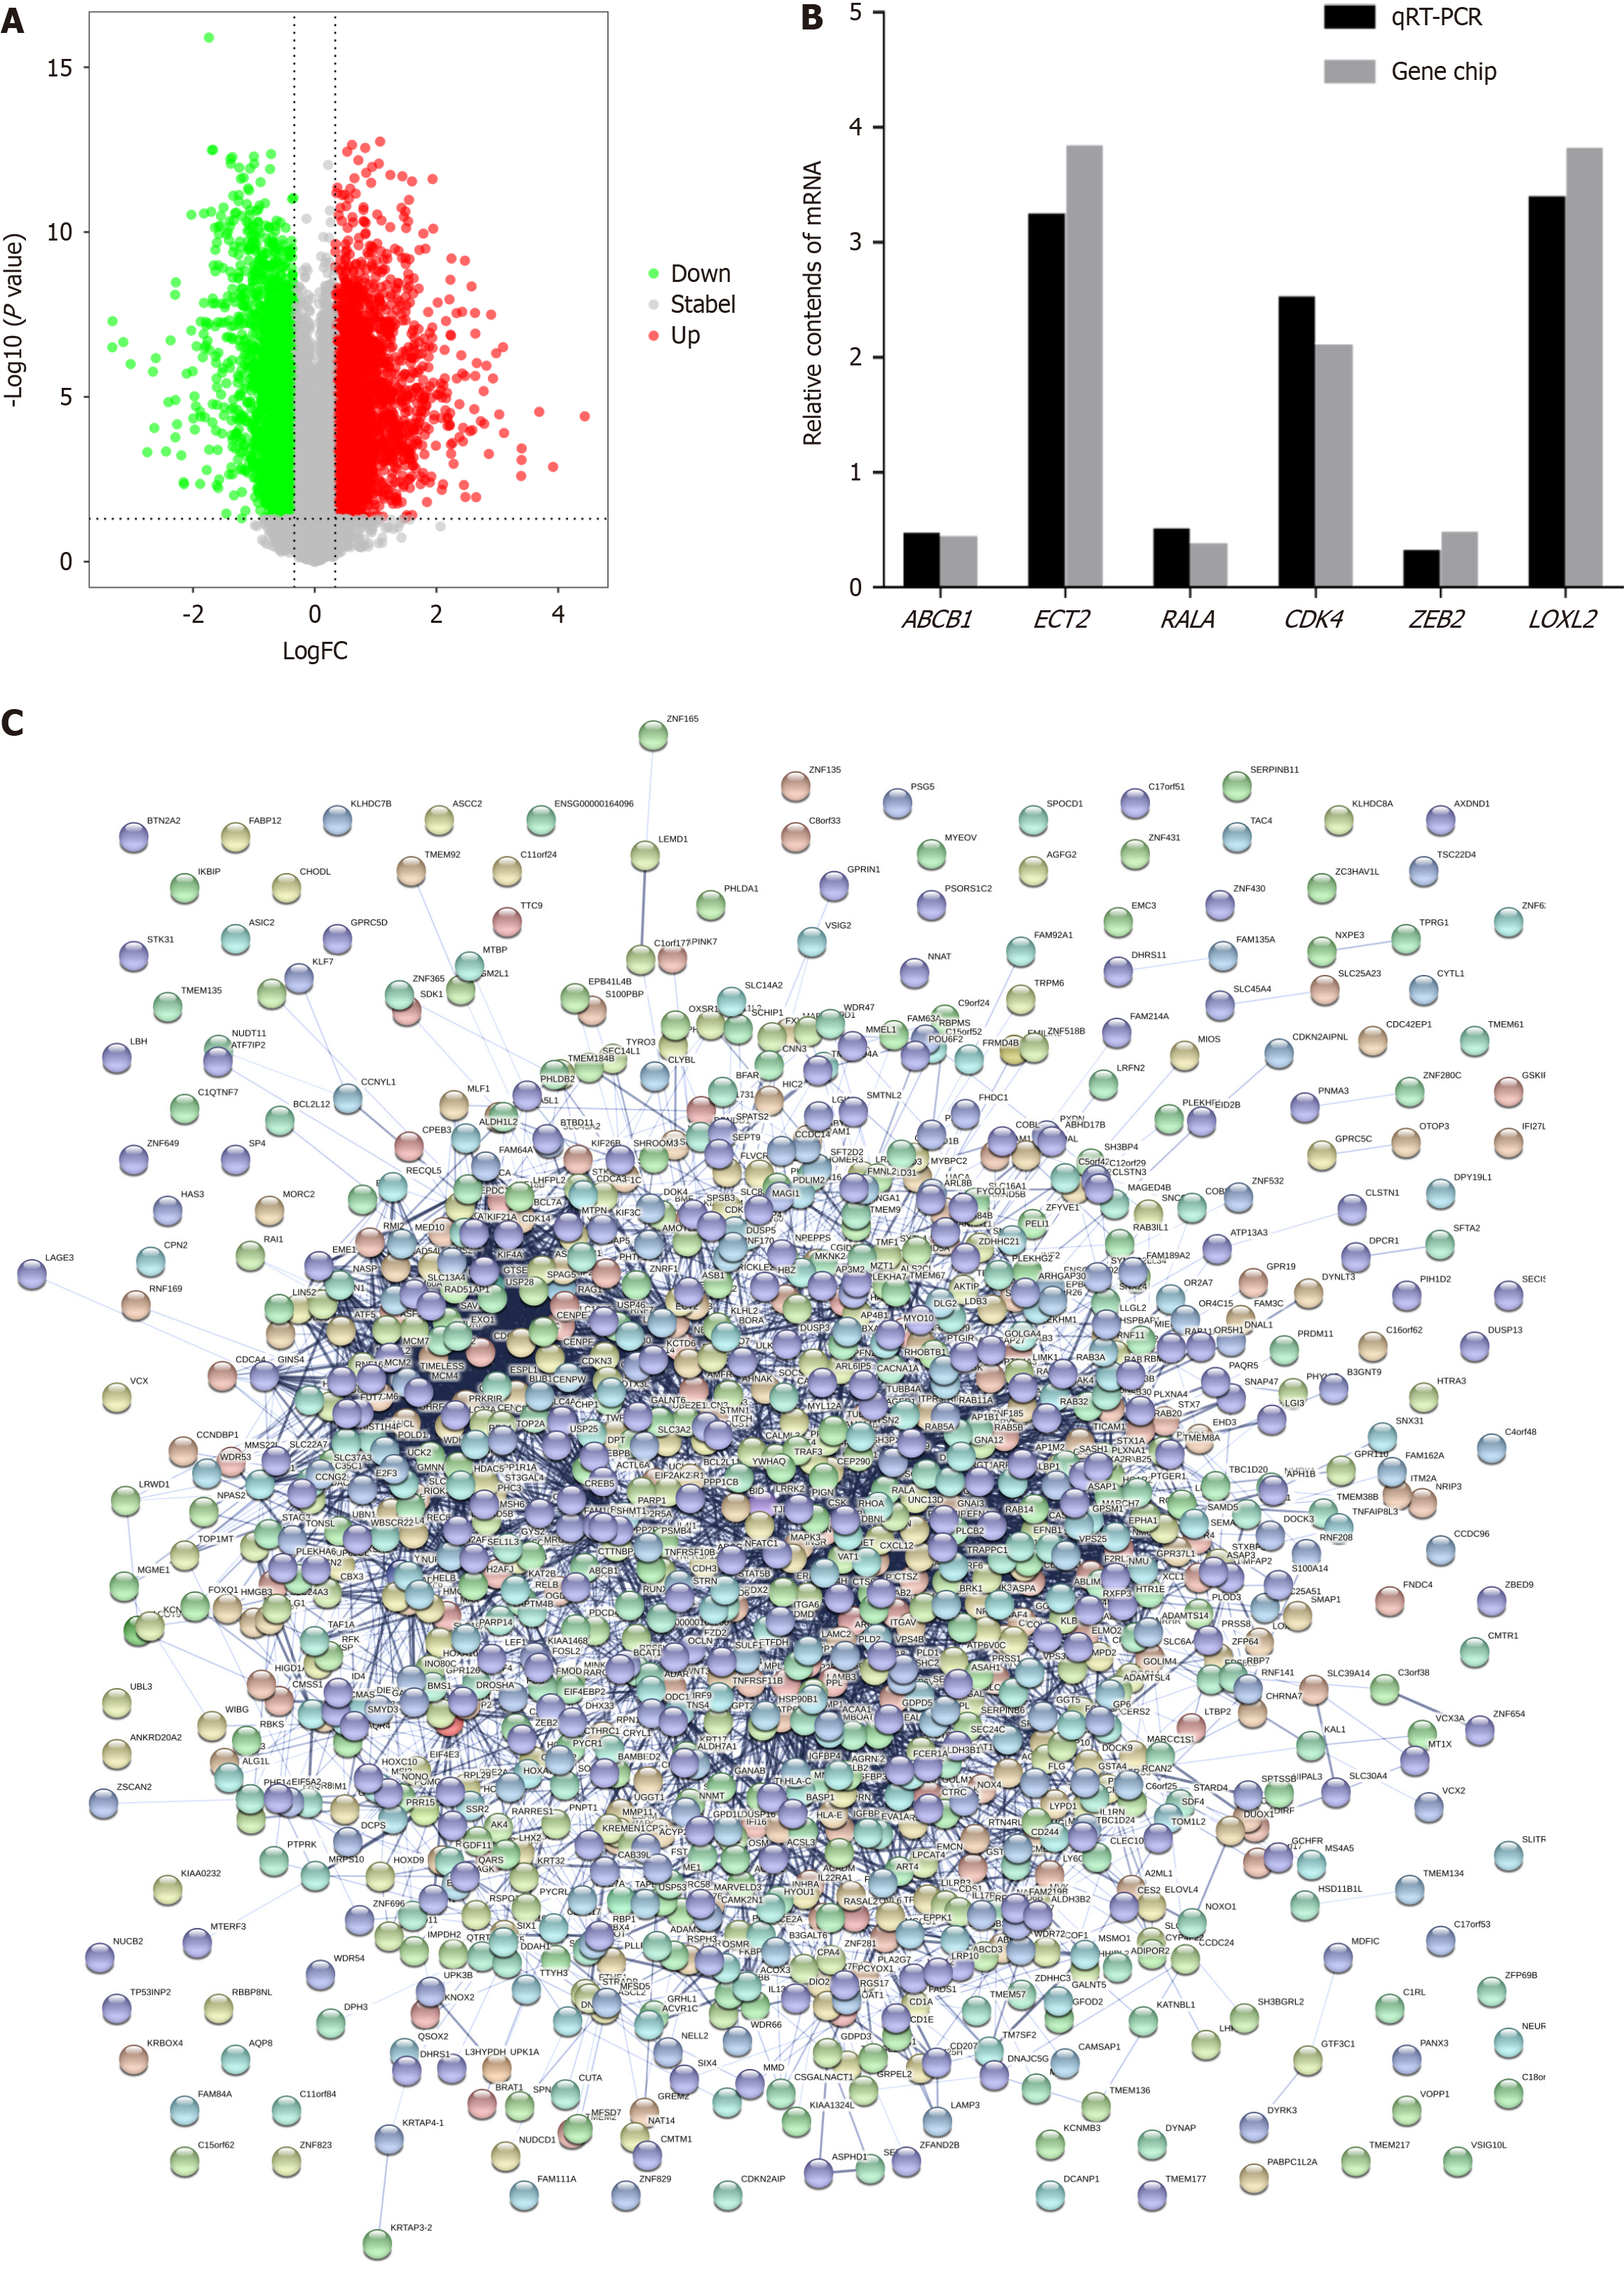
Figure 1 Analysis of differentially expressed genes.
A: Volcanic map of differentially expressed genes (DEGs). Red, upregulated; green, downregulated; gray, no significant difference; B: Correlation between genes detected by gene chip and qRT-PCR; C: Protein-protein interaction network for DEGs.
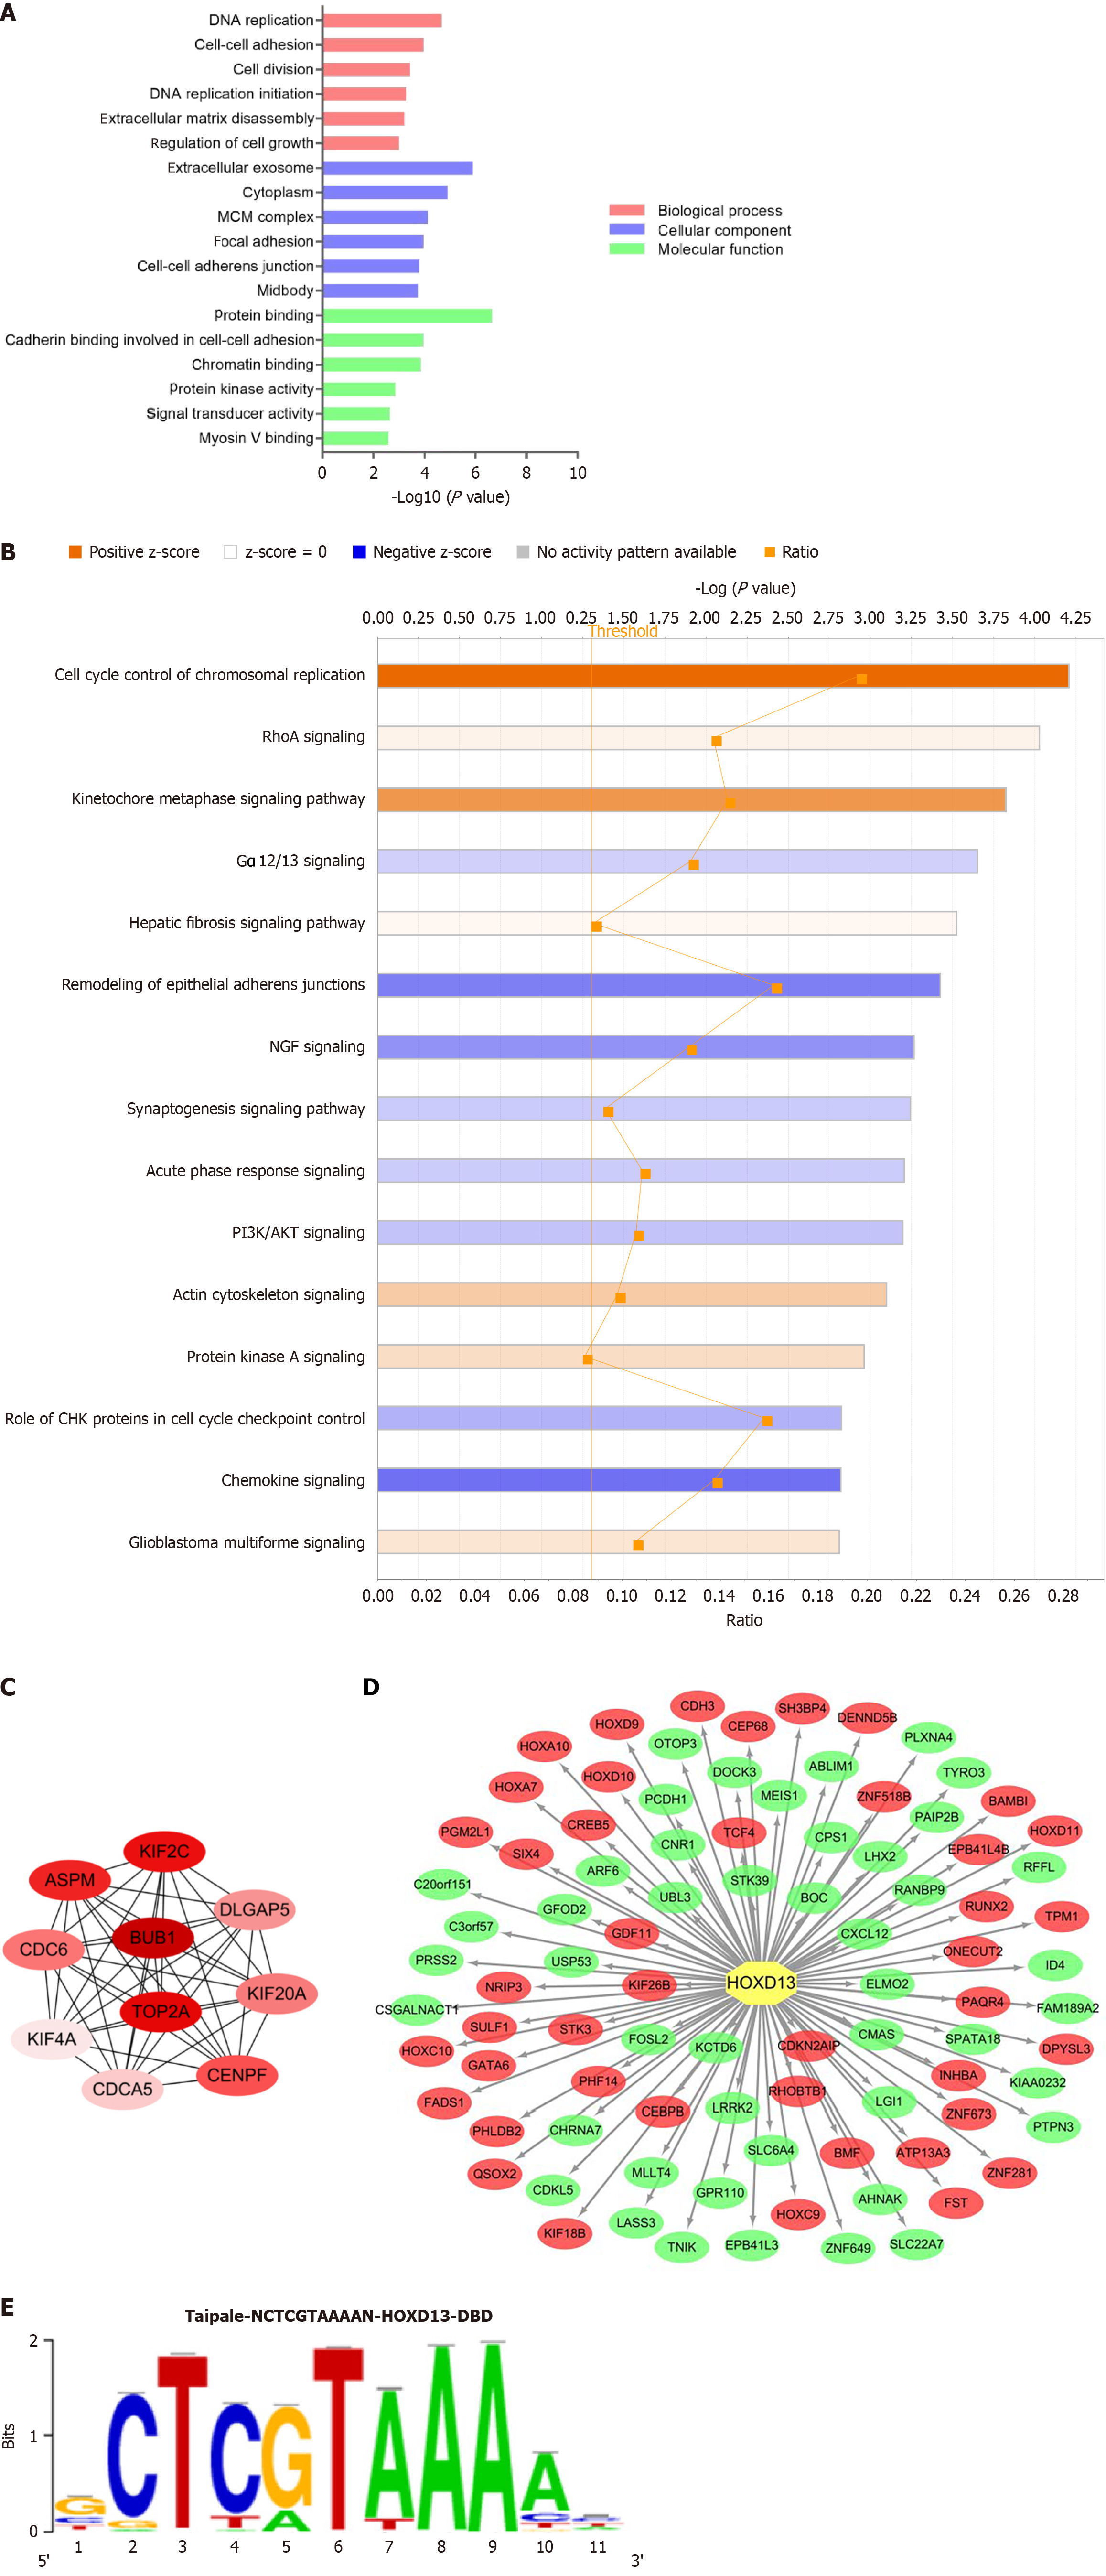
Figure 2 Enrichment analysis of differentially expressed genes.
A: Distribution of changed genes in Gene Ontology analysis (P < 0.05); B: The canonical pathway of significant change was analyzed with IPA software. Yellow, upward; blue, down; C: Using Cytoscape to describe the hub gene network. The darker the node, the higher the score; D: Target genes of BUB1 predicted using iRegulon in Cytoscape. The nodes in red and green indicate upregulated and downregulated proteins; E: Binding motif of BUB1.
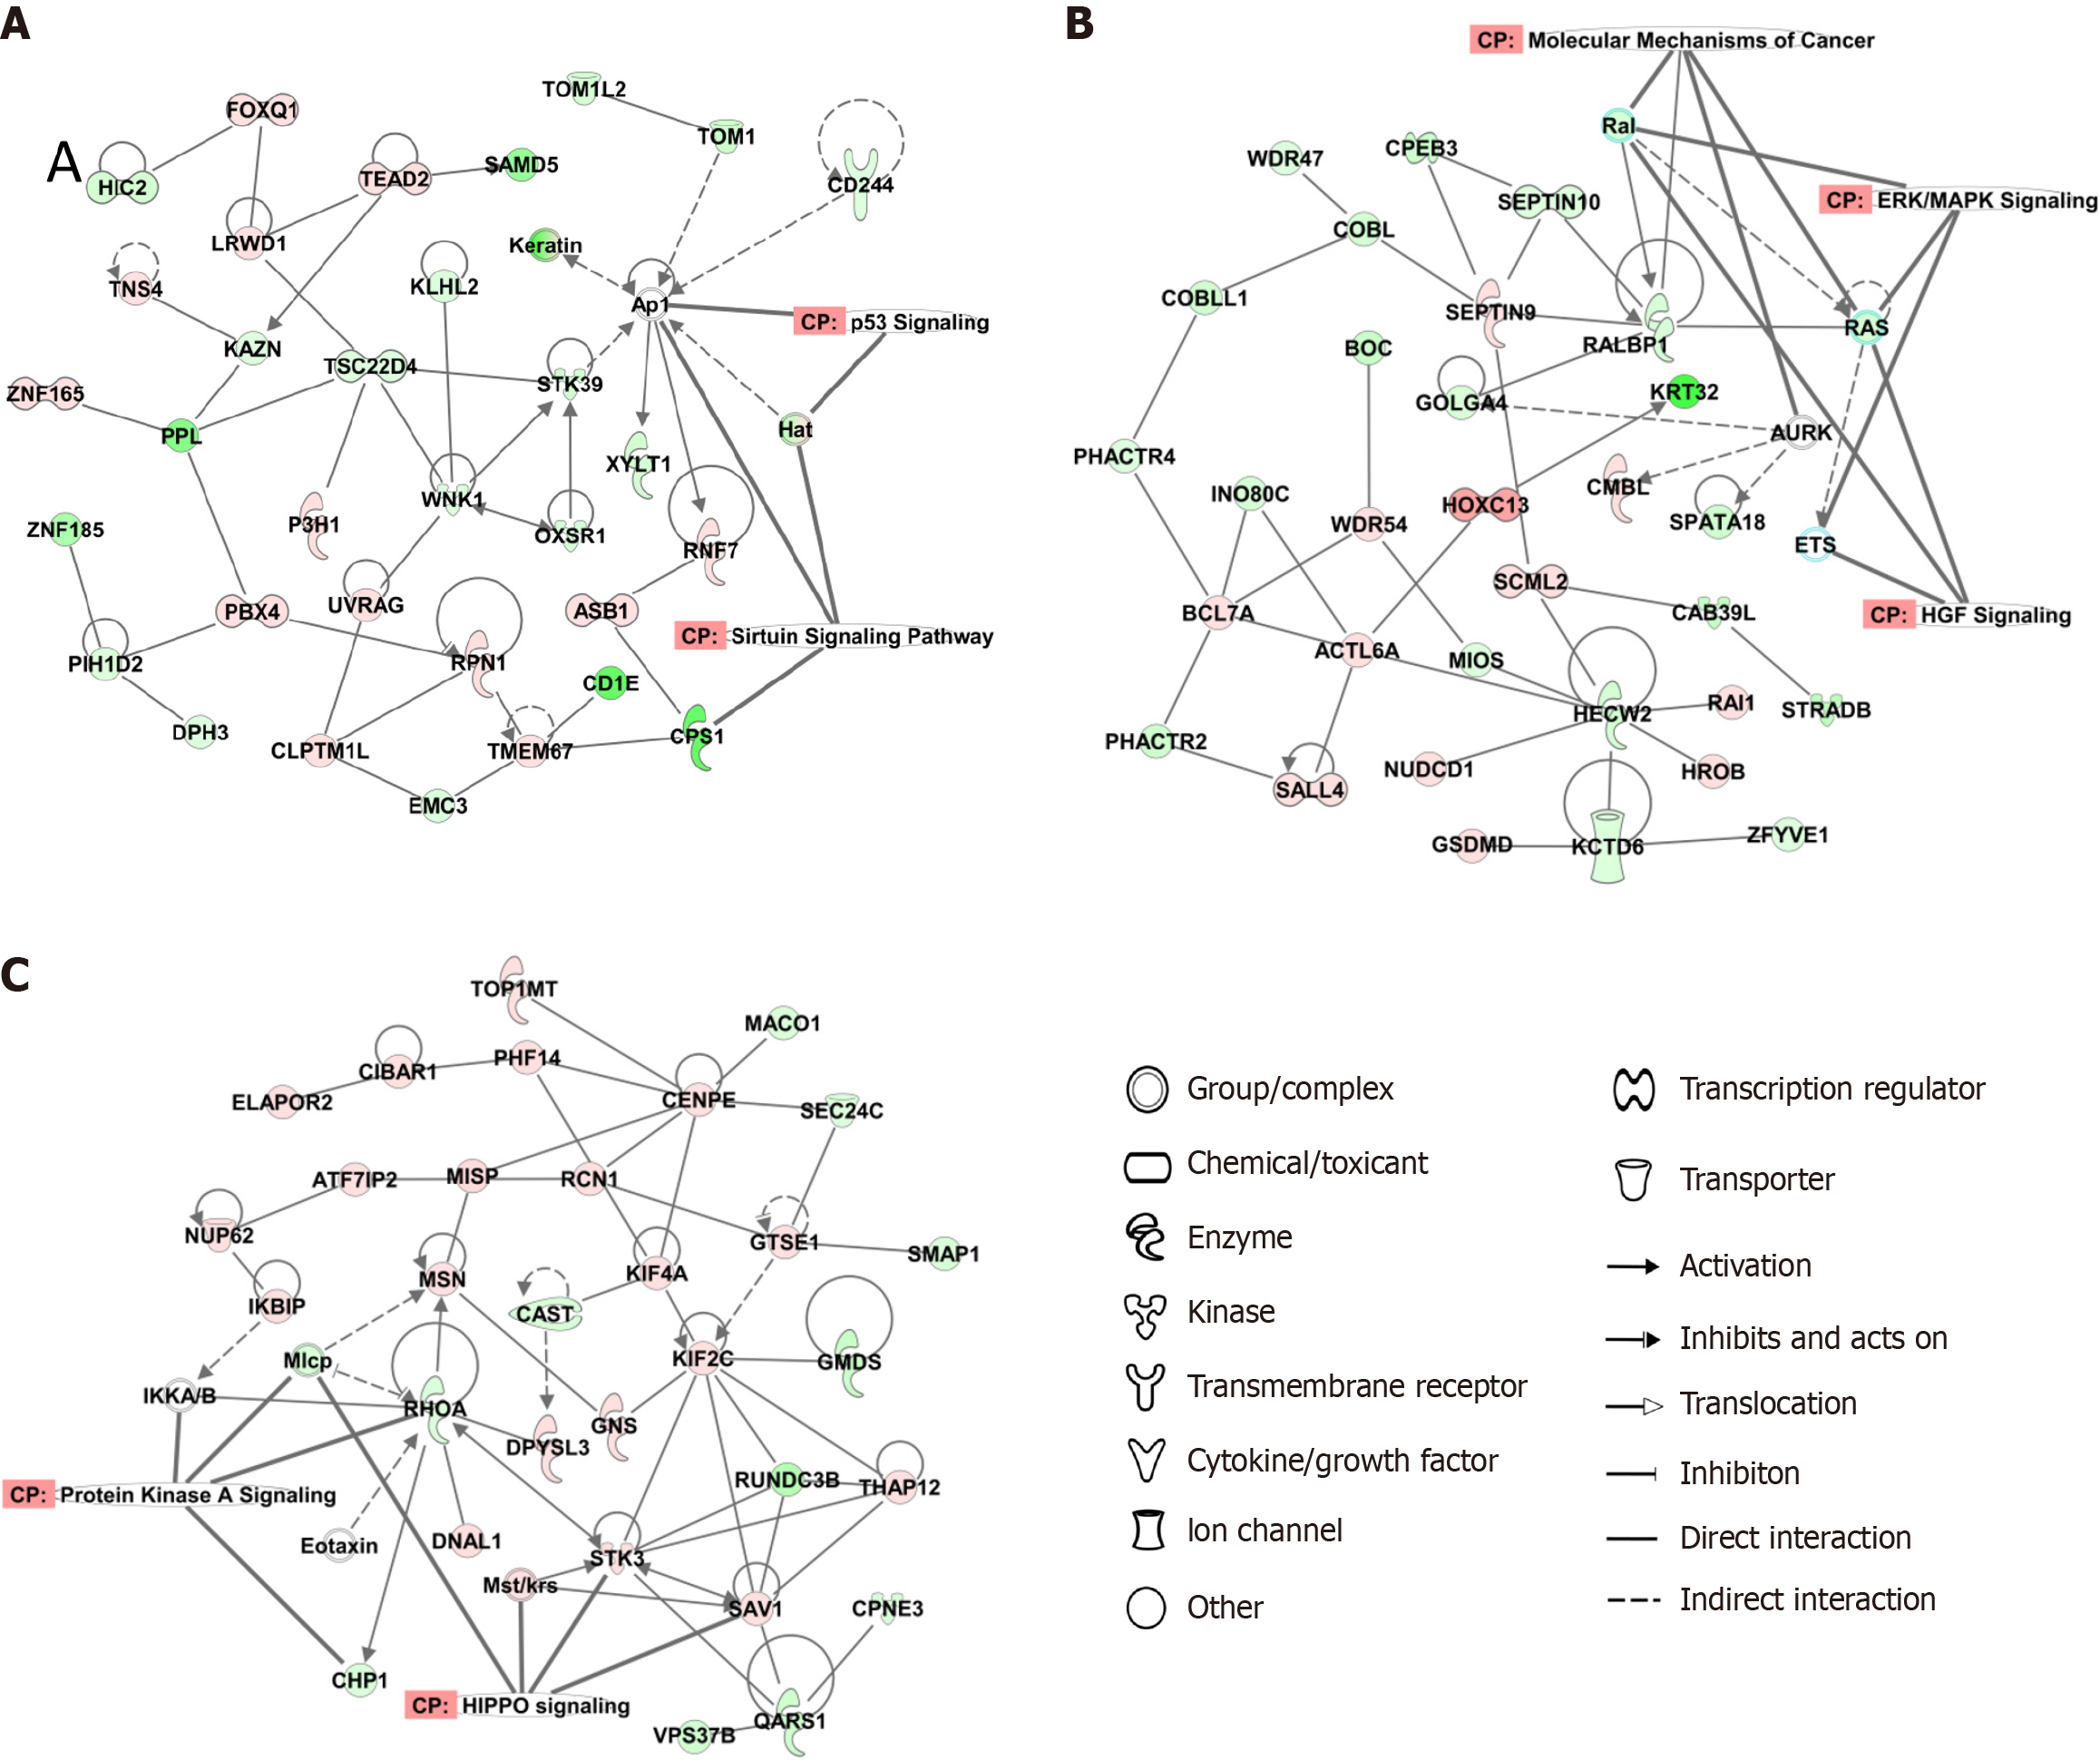
Figure 3 Ingenuity pathway analysis.
A–C: Top-ranked enriched networks based on differentially abundant genes. Red, increased; green, decreased.
Figure 4 Baitouweng decoction inhibits proliferation of esophageal cancer cells in a dose- and time-dependent manner.
A: Dose-effect relationship of Baitouweng decoction on esophageal cancer cells; B: Time-effect relationship of Baitouweng decoction on esophageal cancer cells.
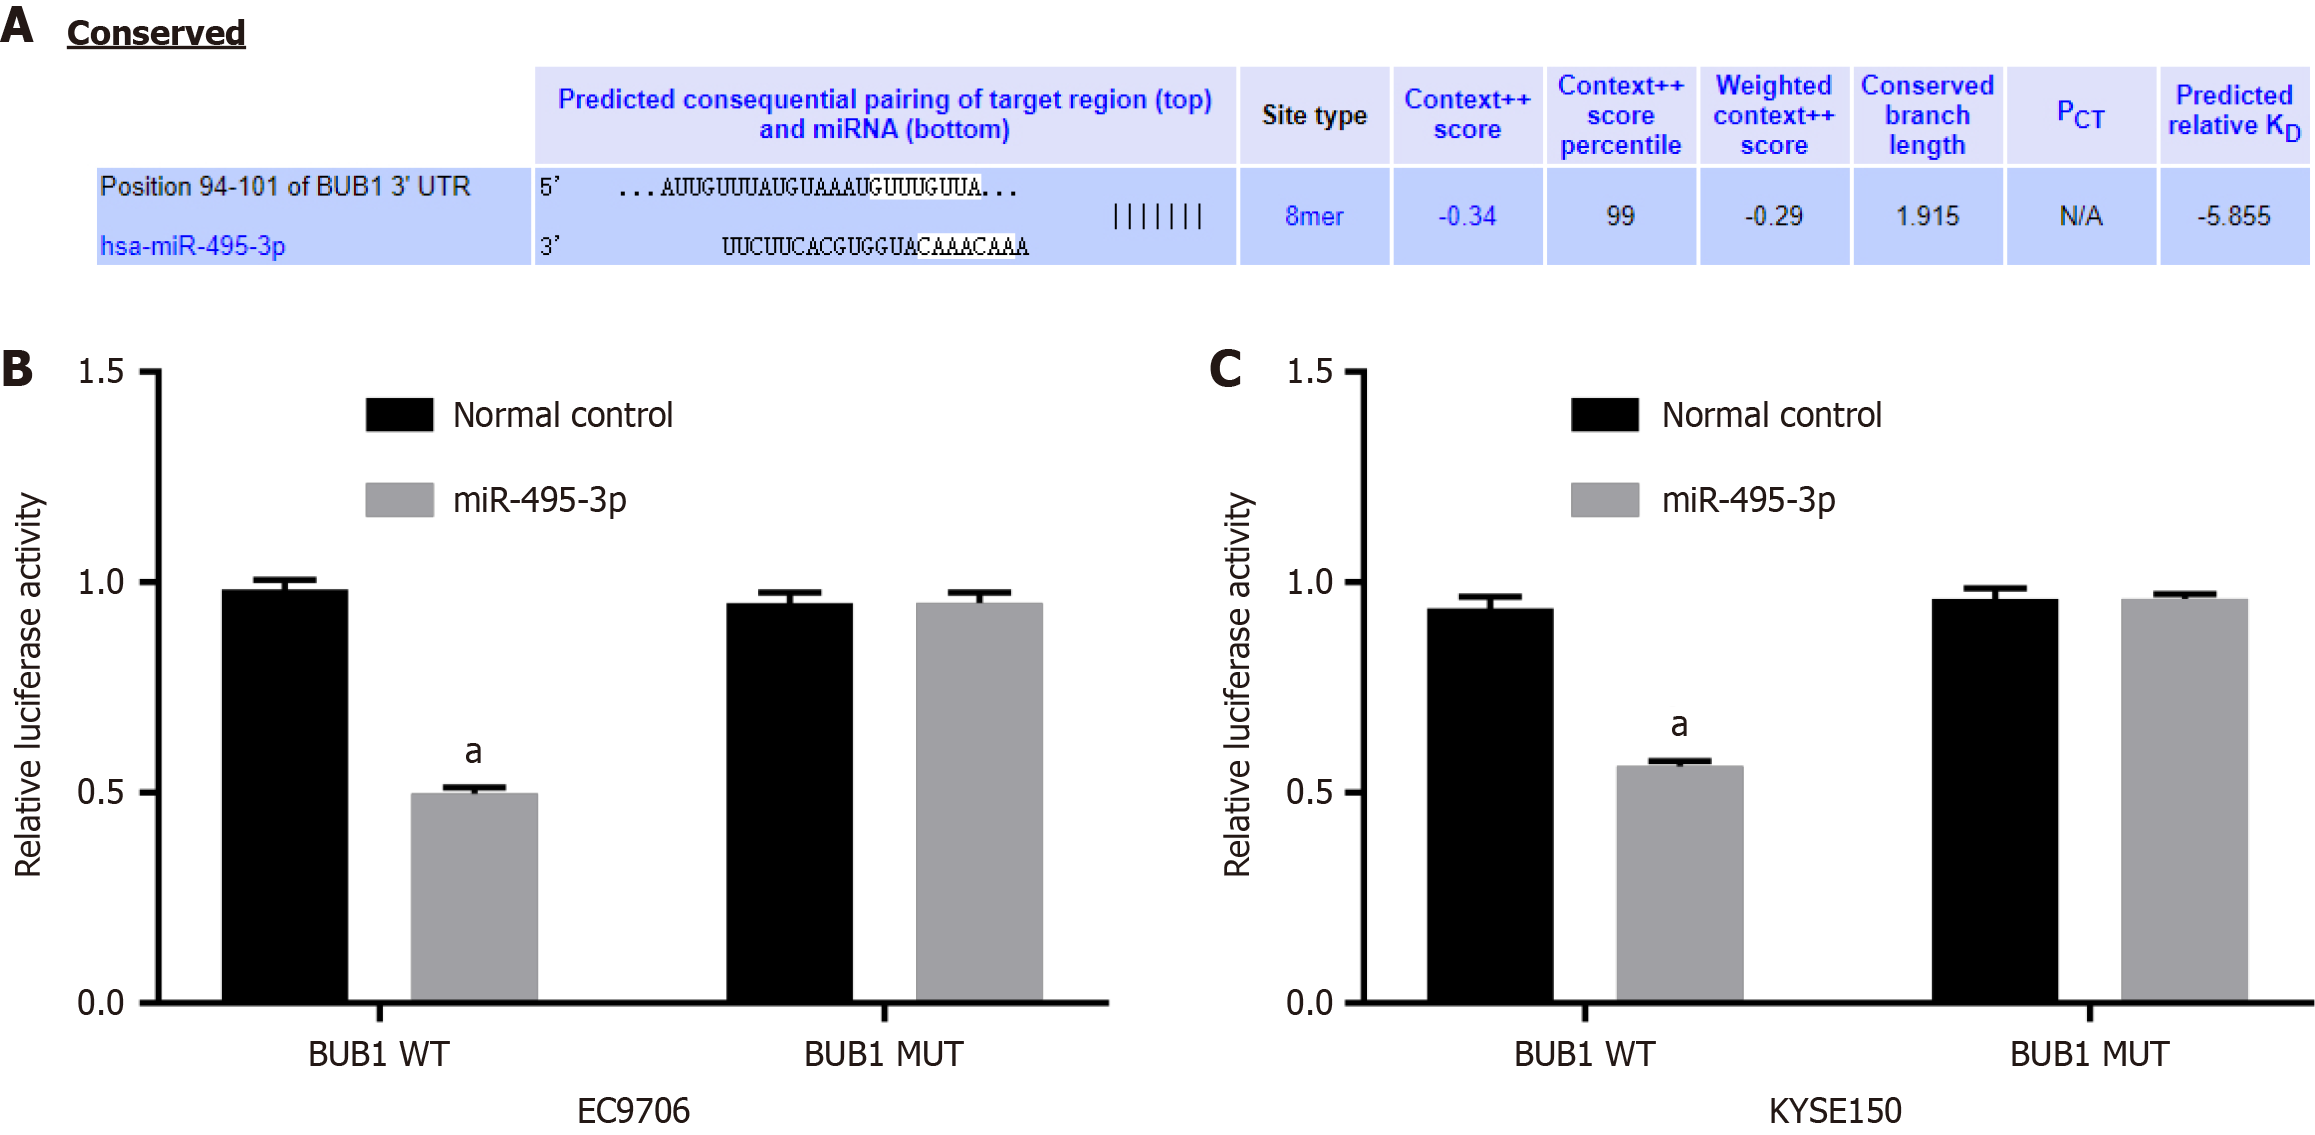
Figure 5 BUB1 is a target gene of miR-495-3p.
A: Diagram of the putative binding sites of miR-495-3p in the 3'-untranslated regions of BUB1; B and C: Dual luciferase activity in EC9706 cells and KYSE150 cells. aP < 0.01 compared with normal control. UTR: Untranslated region; WT: Wild type; MUT: Mutant.
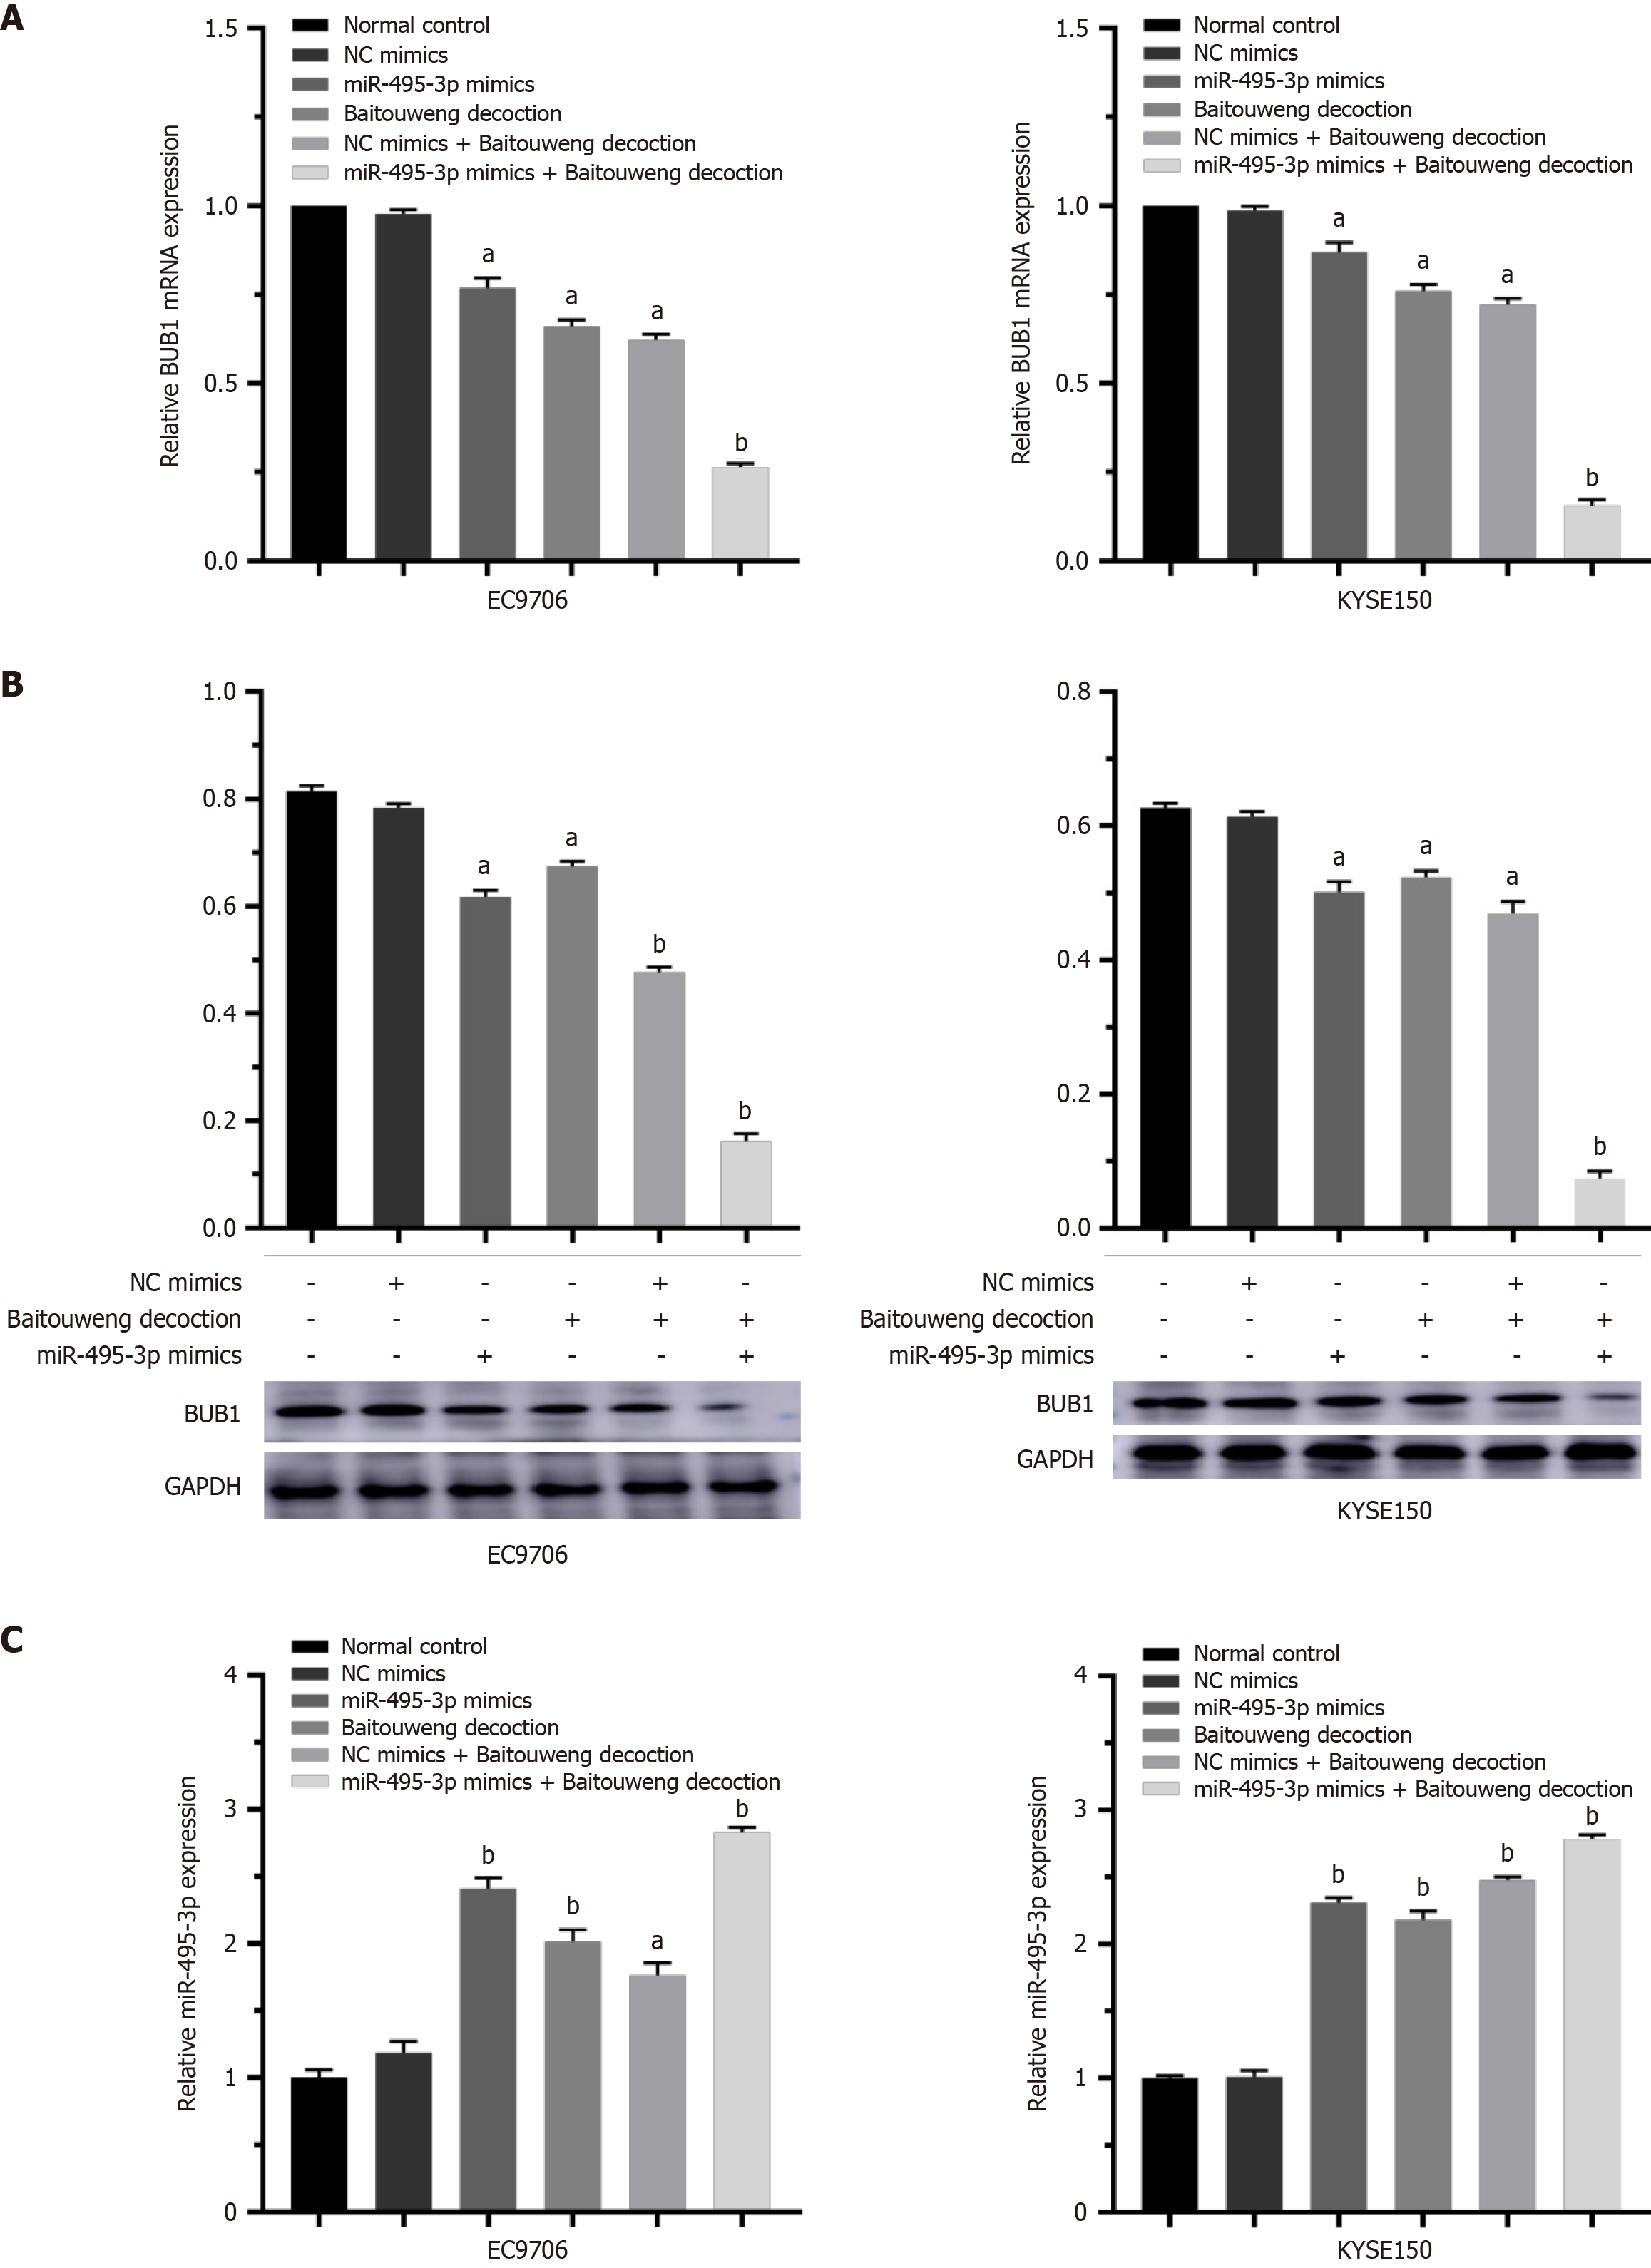
Figure 6 Baitouweng decoction inhibits BUB1 expression.
A: qRT-PCR analysis of the effect of Baitouweng decoction on the expression of BUB1 in EC9706 and KYSE150 cells; B: Western blot analysis of Baitouweng decoction on the expression of BUB1 in EC9706 and KYSE150 cells; C: Baitouweng decoction or miR495-3p mimics significantly upregulate the expression of miR-495-3p in EC9706 and KYSE150 cells. aP < 0.05, bP < 0.01 compared with normal control.
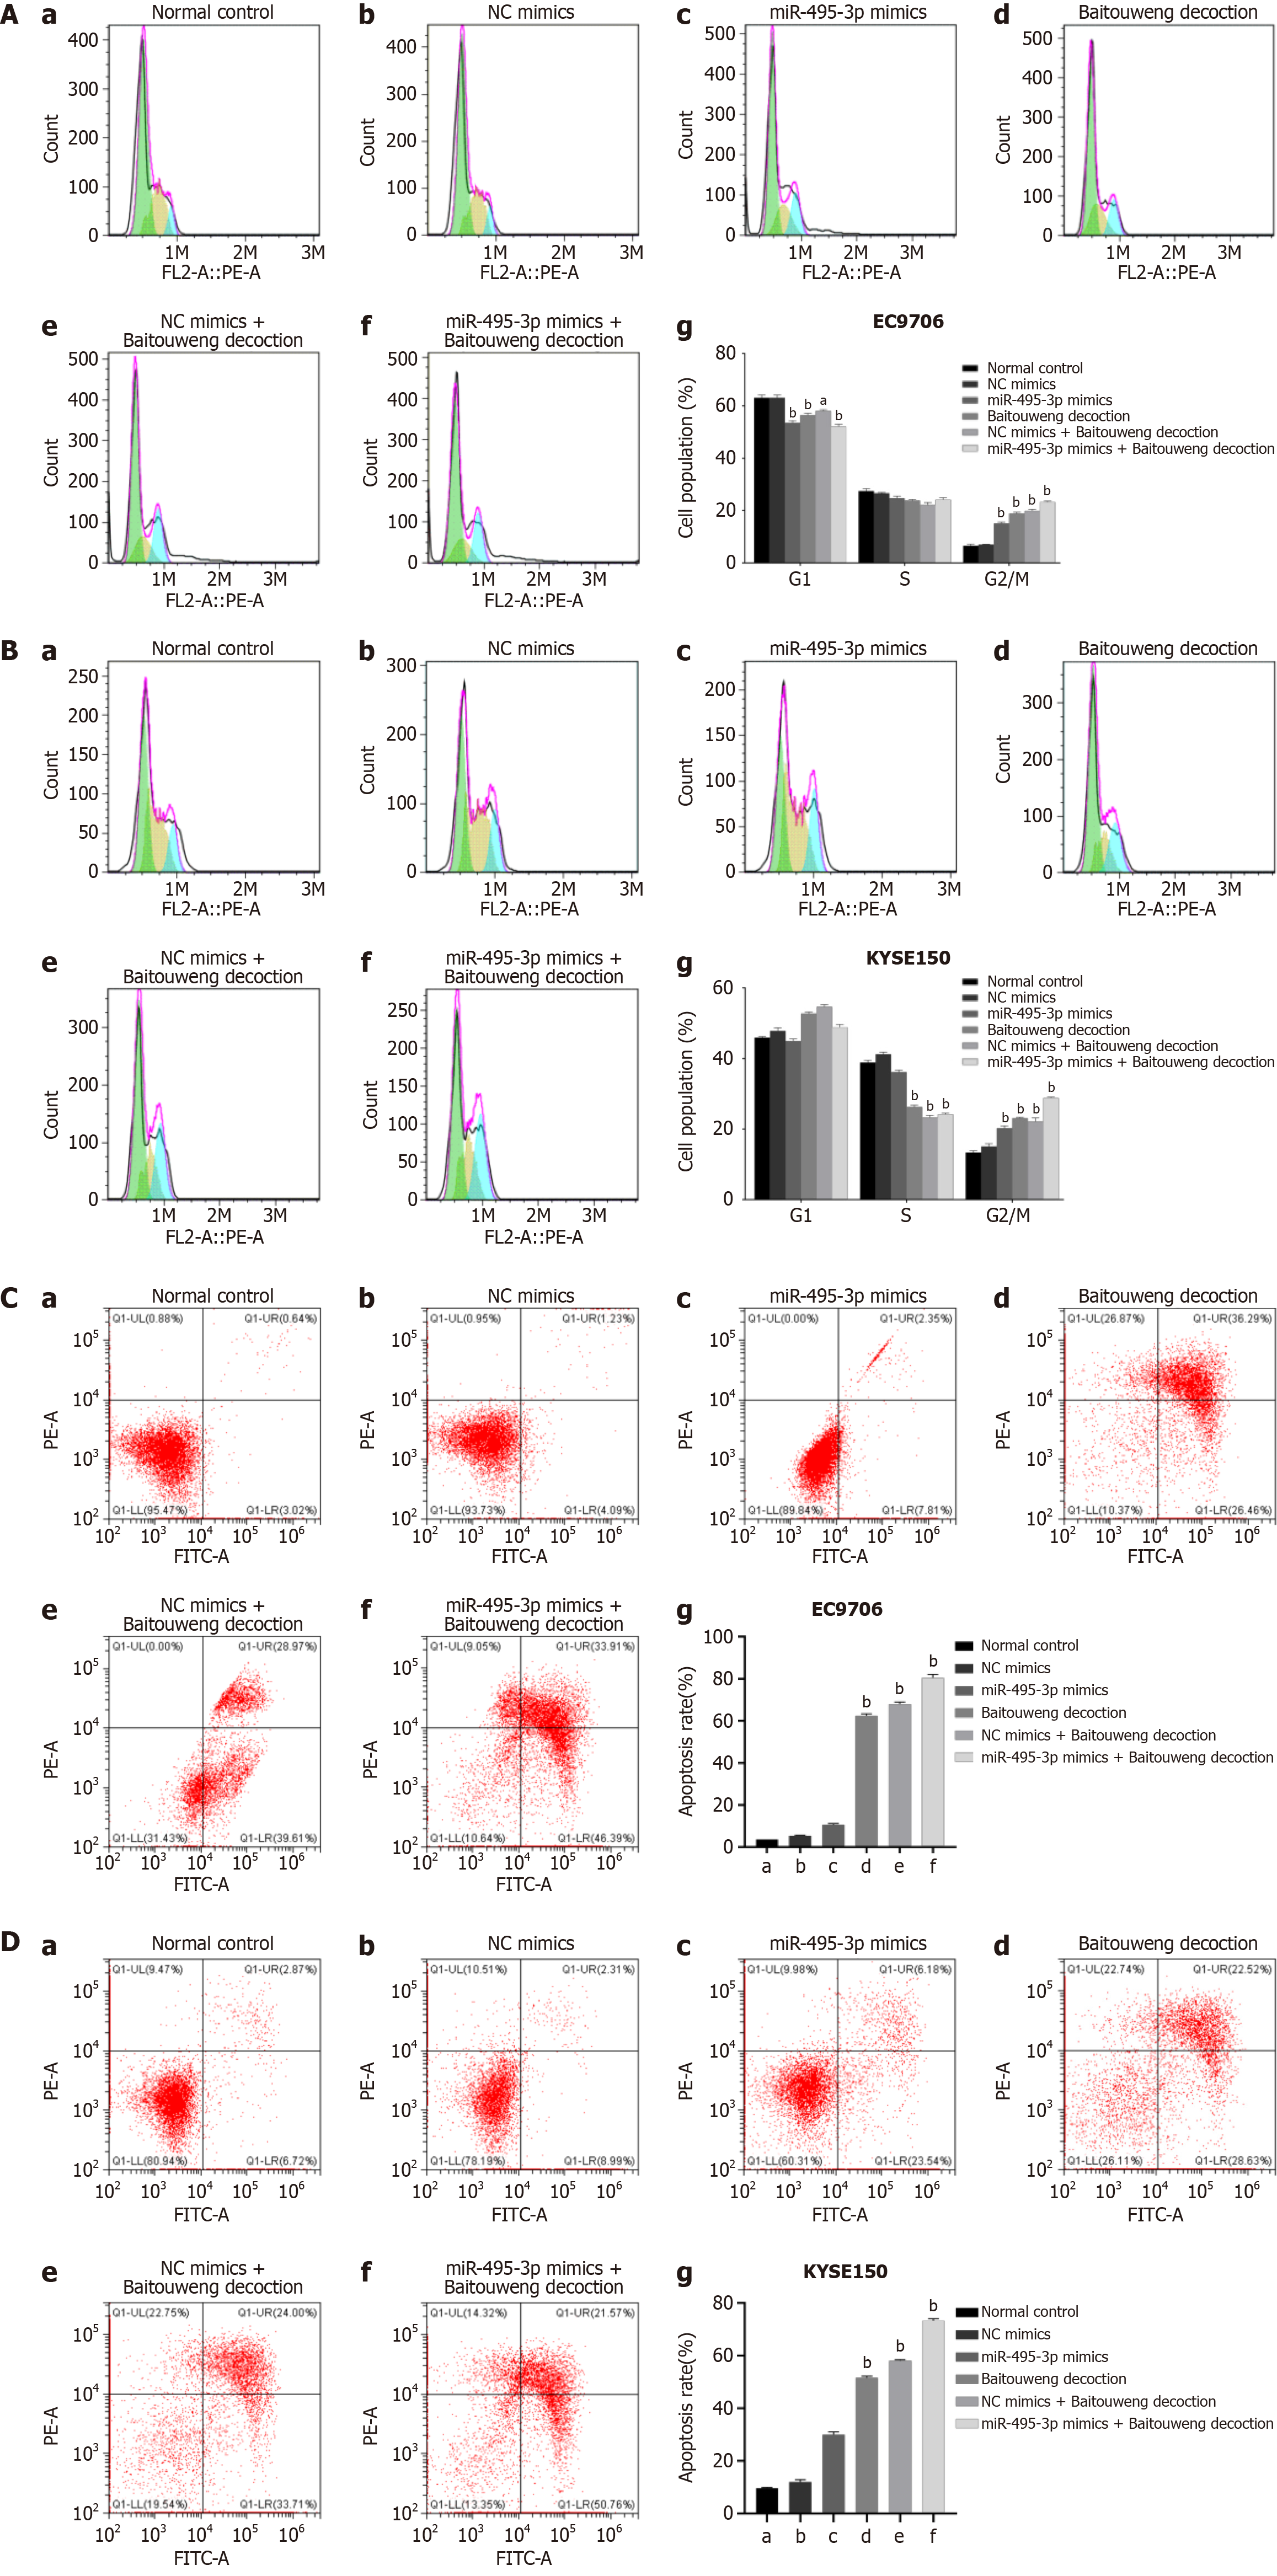
Figure 7 Effect of Baitouweng decoction on the cell cycle and apoptosis of esophageal cancer cells.
A and B: Baitouweng decoction induces G2/M phase arrest in EC9706 and KYSE150 cells; C and D: Baitouweng decoction increases the apoptosis of EC9706 and KYSE150 cells. aP < 0.05, bP < 0.01 compared with normal control.
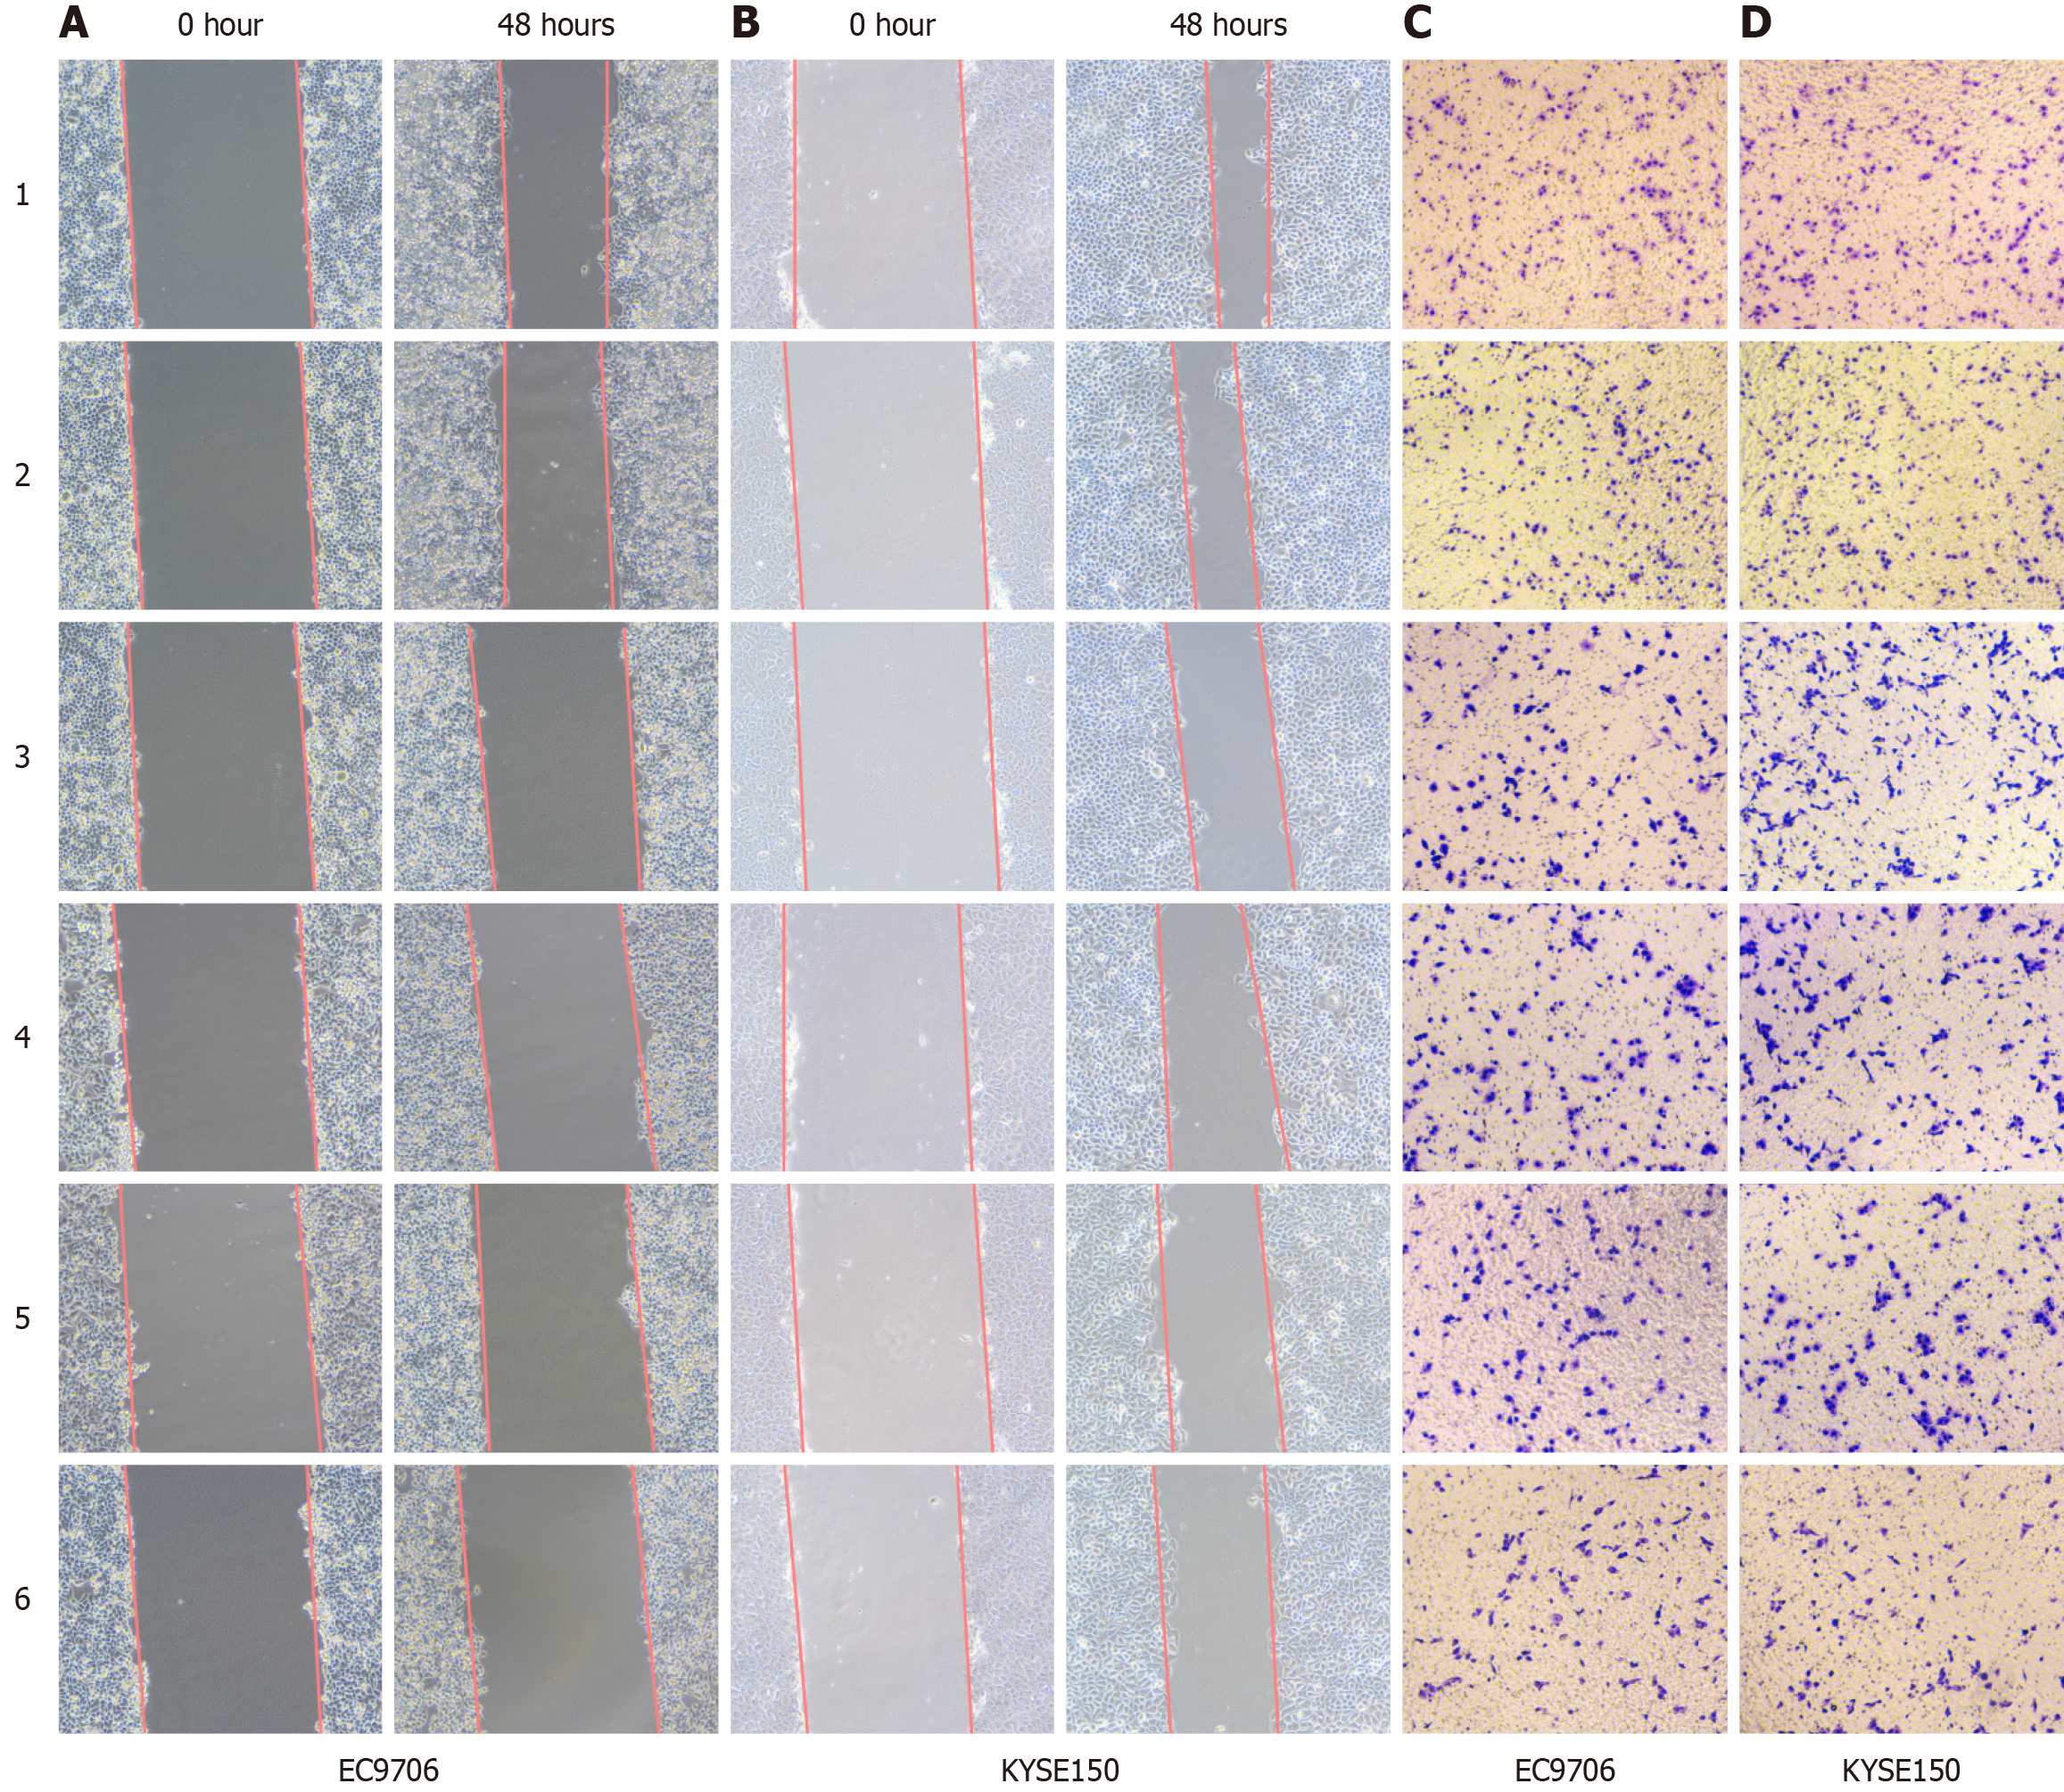
Figure 8 Effect of Baitouweng decoction on migration and invasion of esophageal cancer cells.
A and B: Baitouweng decoction reduces the migration activity of both EC9706 and KYSE150 cells; C and D: Baitouweng decoction reduce the invasion activity of both EC9706 and KYSE150 cells. 1: Normal control; 2: NC mimics; 3: miR-495-3p mimics; 4: Baitouweng decoction; 5: NC mimics + Baitouweng decoction; 6: miR-495-3p mimics + Baitouweng decoction.
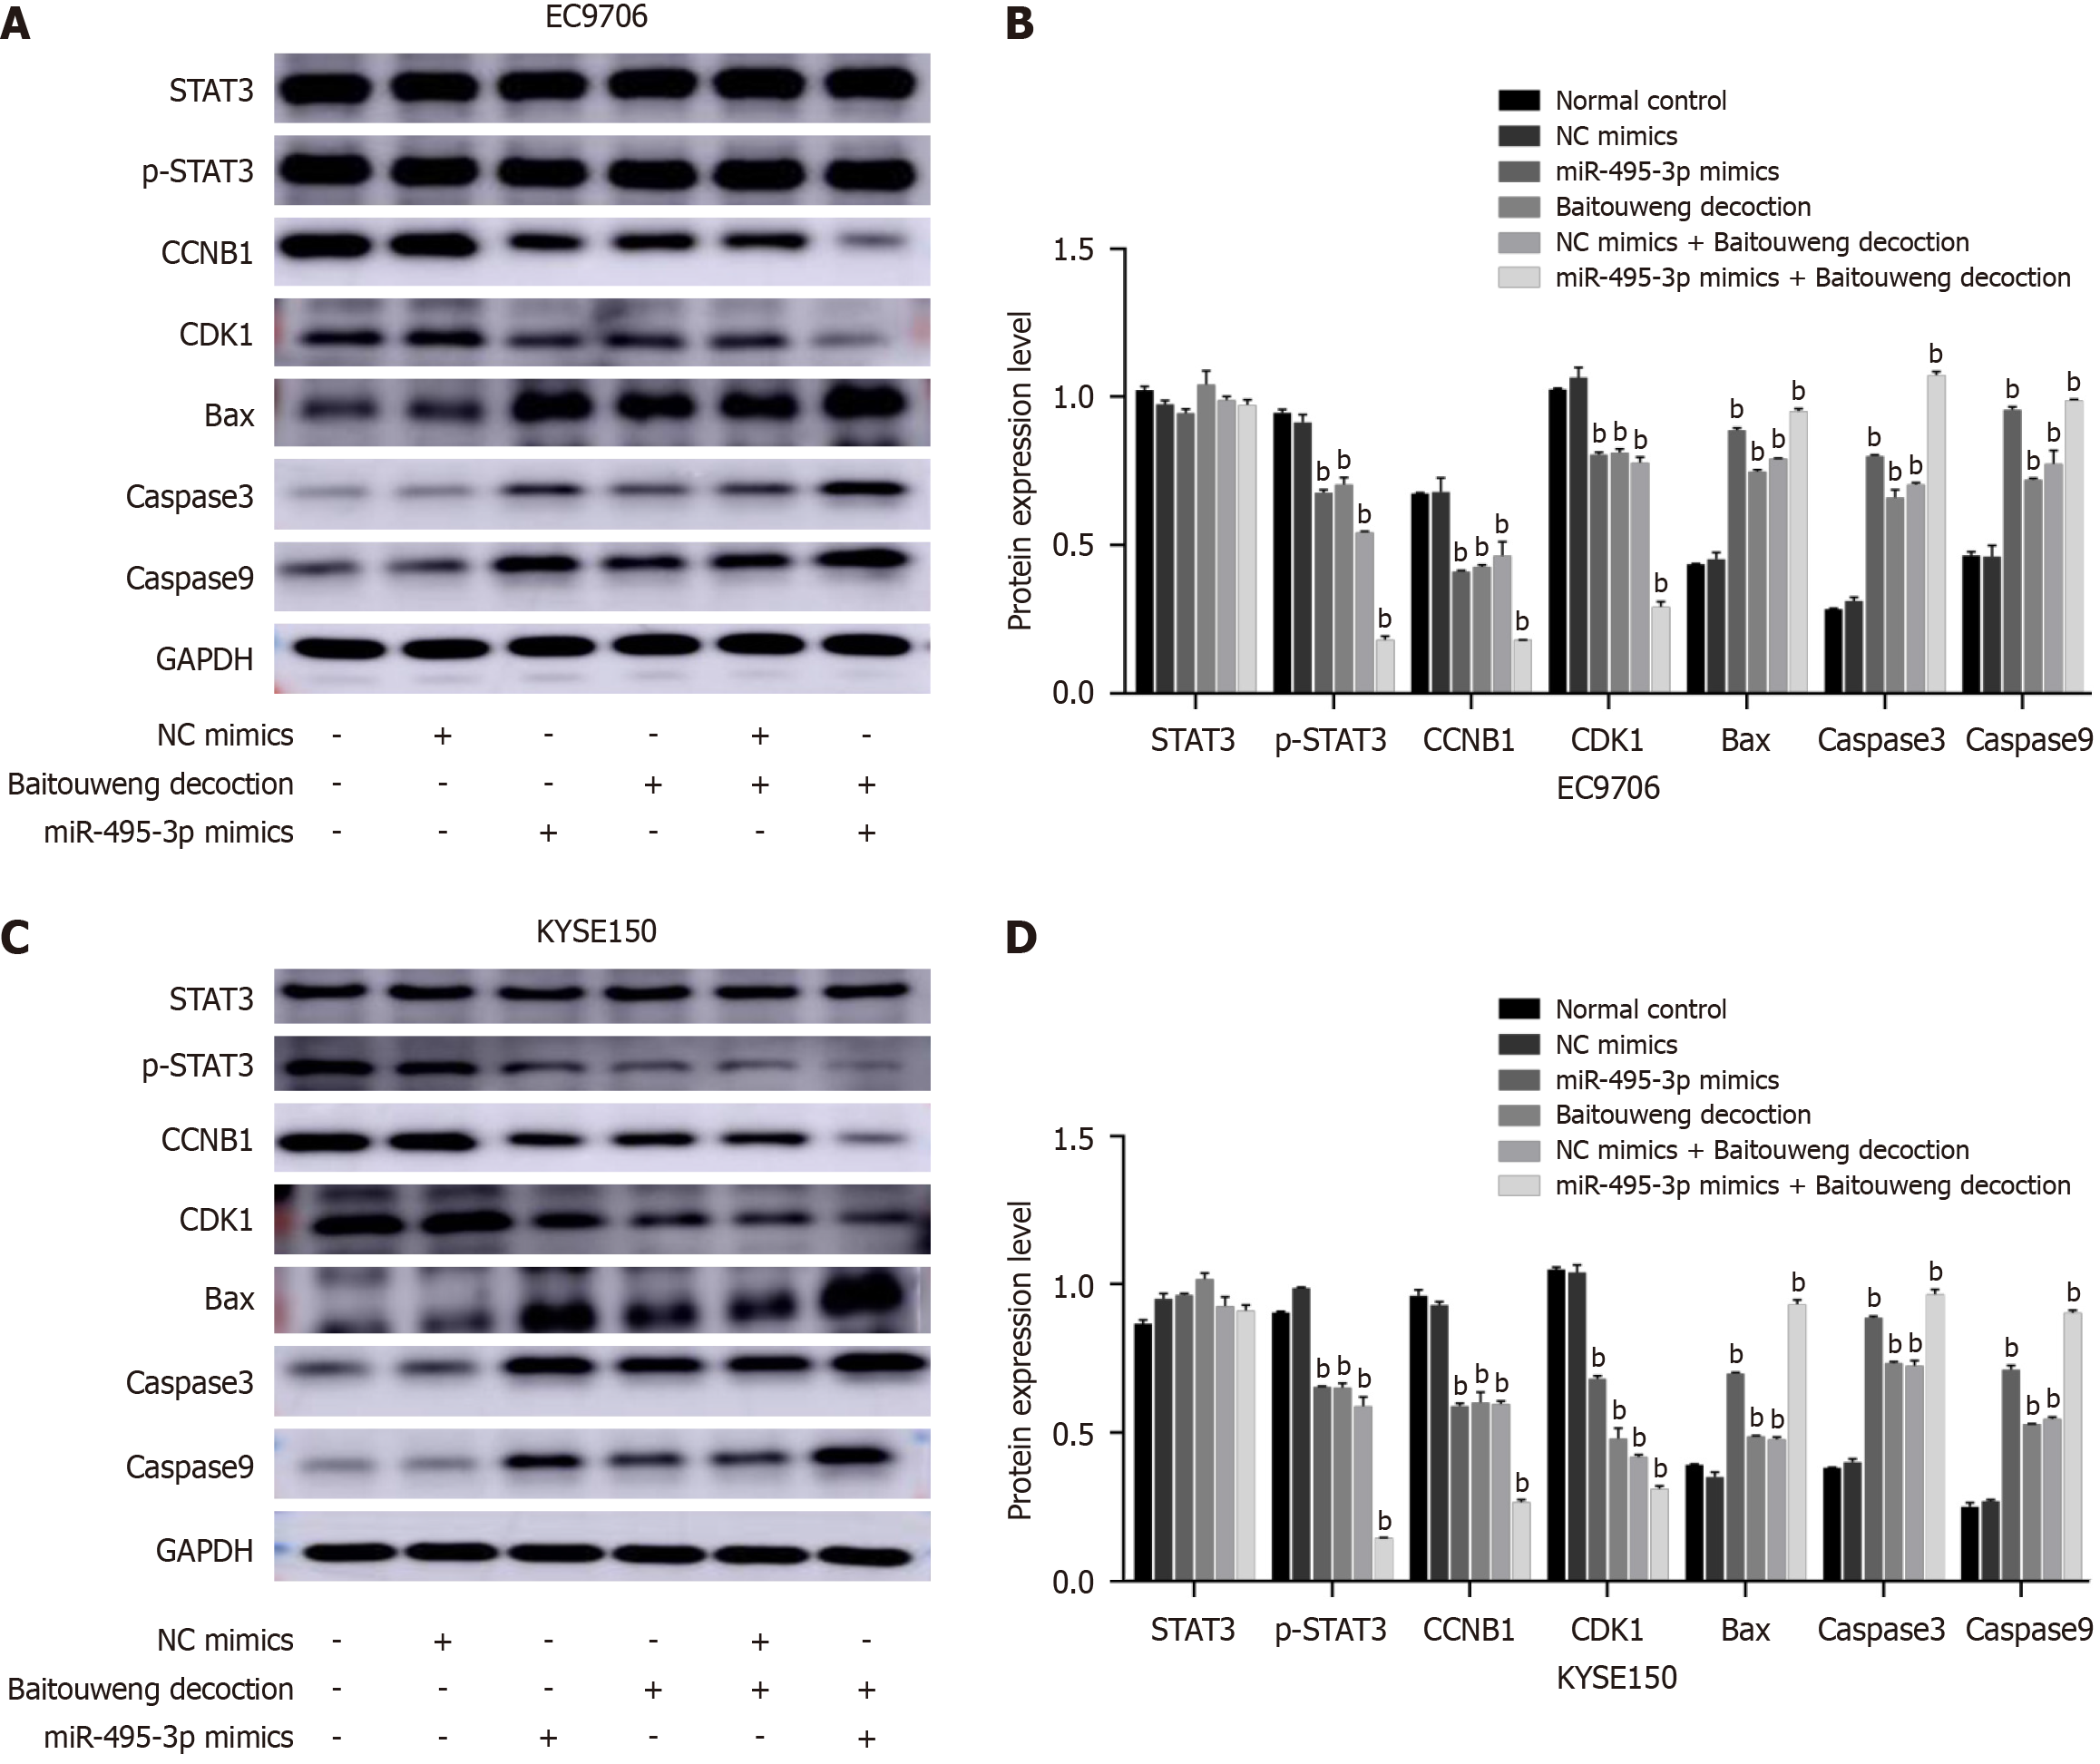
Figure 9 Protein expression of STAT3, p-STAT3, CCNB1, CDK1, Bax, Caspase3, and Caspase9 in different groups detected using Western blot.
A and B: EC9706 cells; C and D: KYSE150 cells. bP < 0.01 compared with normal control.
- Citation: Yang H, Chen XW, Song XJ, Du HY, Si FC. Baitouweng decoction suppresses growth of esophageal carcinoma cells through miR-495-3p/BUB1/STAT3 axis. World J Gastrointest Oncol 2024; 16(7): 3193-3210
- URL: https://www.wjgnet.com/1948-5204/full/v16/i7/3193.htm
- DOI: https://dx.doi.org/10.4251/wjgo.v16.i7.3193


