Copyright
©The Author(s) 2024.
World J Gastrointest Oncol. Jul 15, 2024; 16(7): 3169-3192
Published online Jul 15, 2024. doi: 10.4251/wjgo.v16.i7.3169
Published online Jul 15, 2024. doi: 10.4251/wjgo.v16.i7.3169
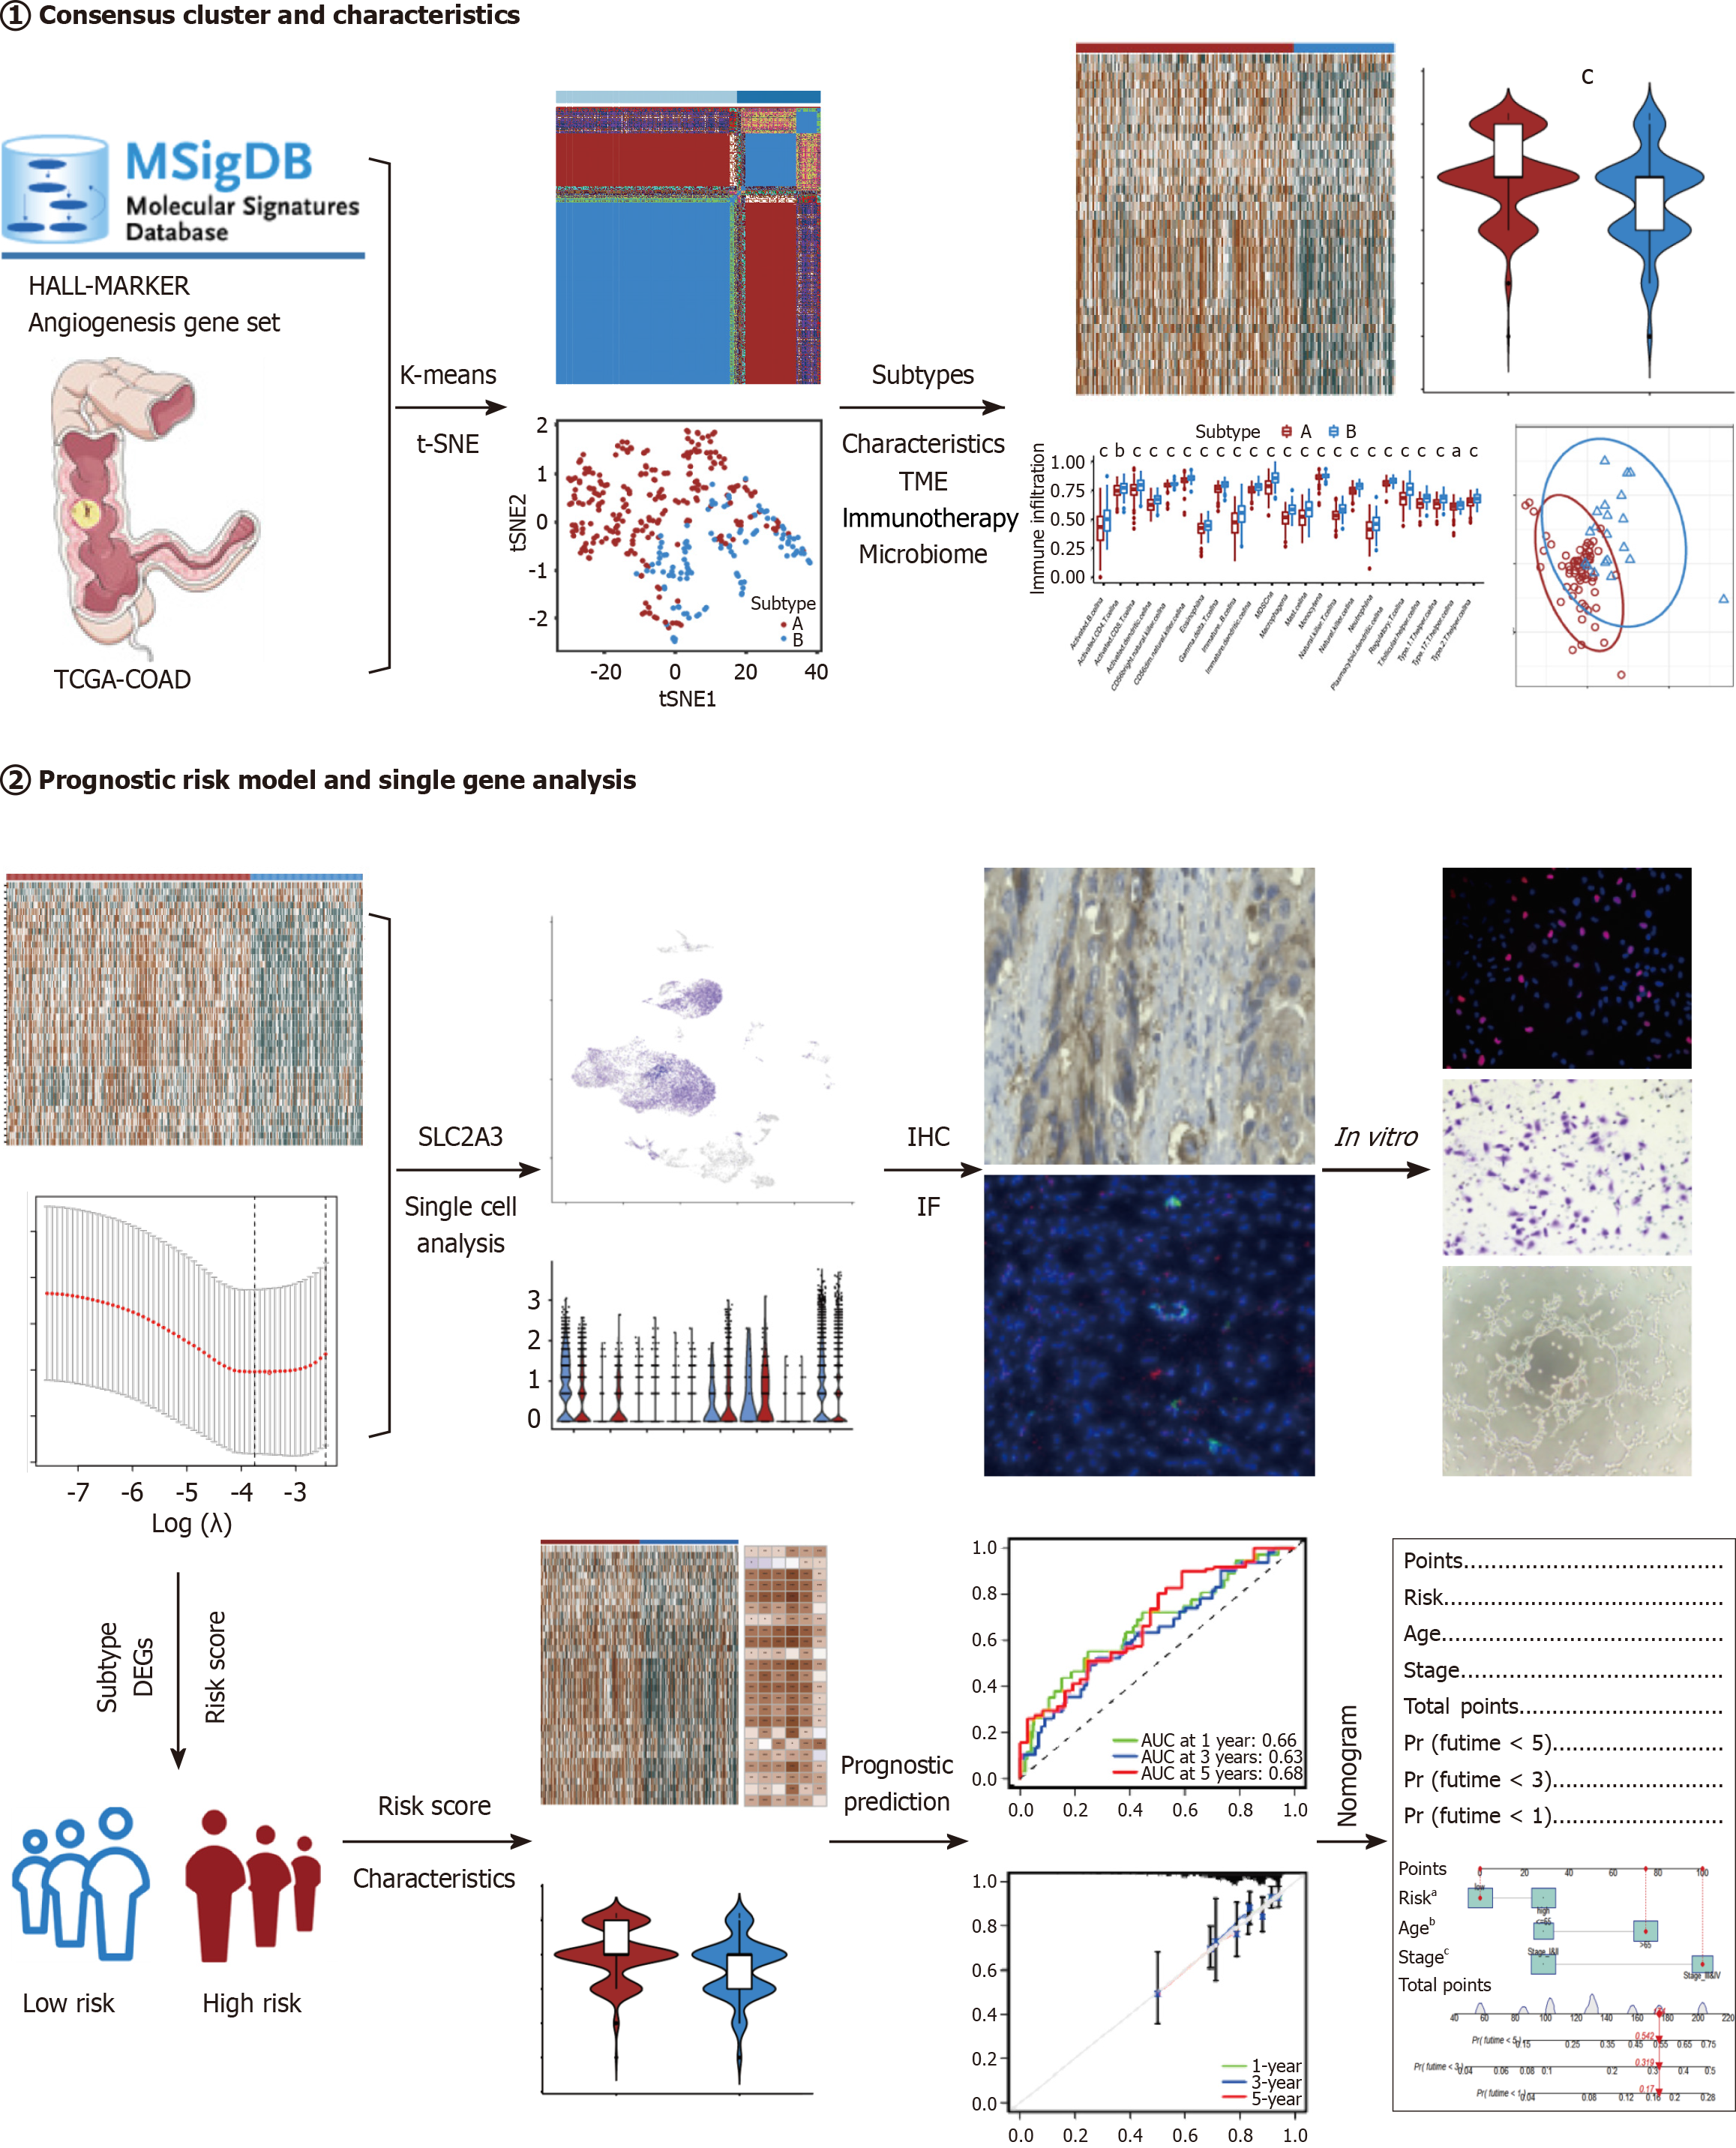
Figure 1 Flowchart for the analytical process in the study.
IHC: Immunohistochemical; IF: Immunofluorescence; TCGA-COAD: The Cancer Genome Atlas Colon Adenocarcinoma. aP < 0.05; bP < 0.01; cP < 0.001.
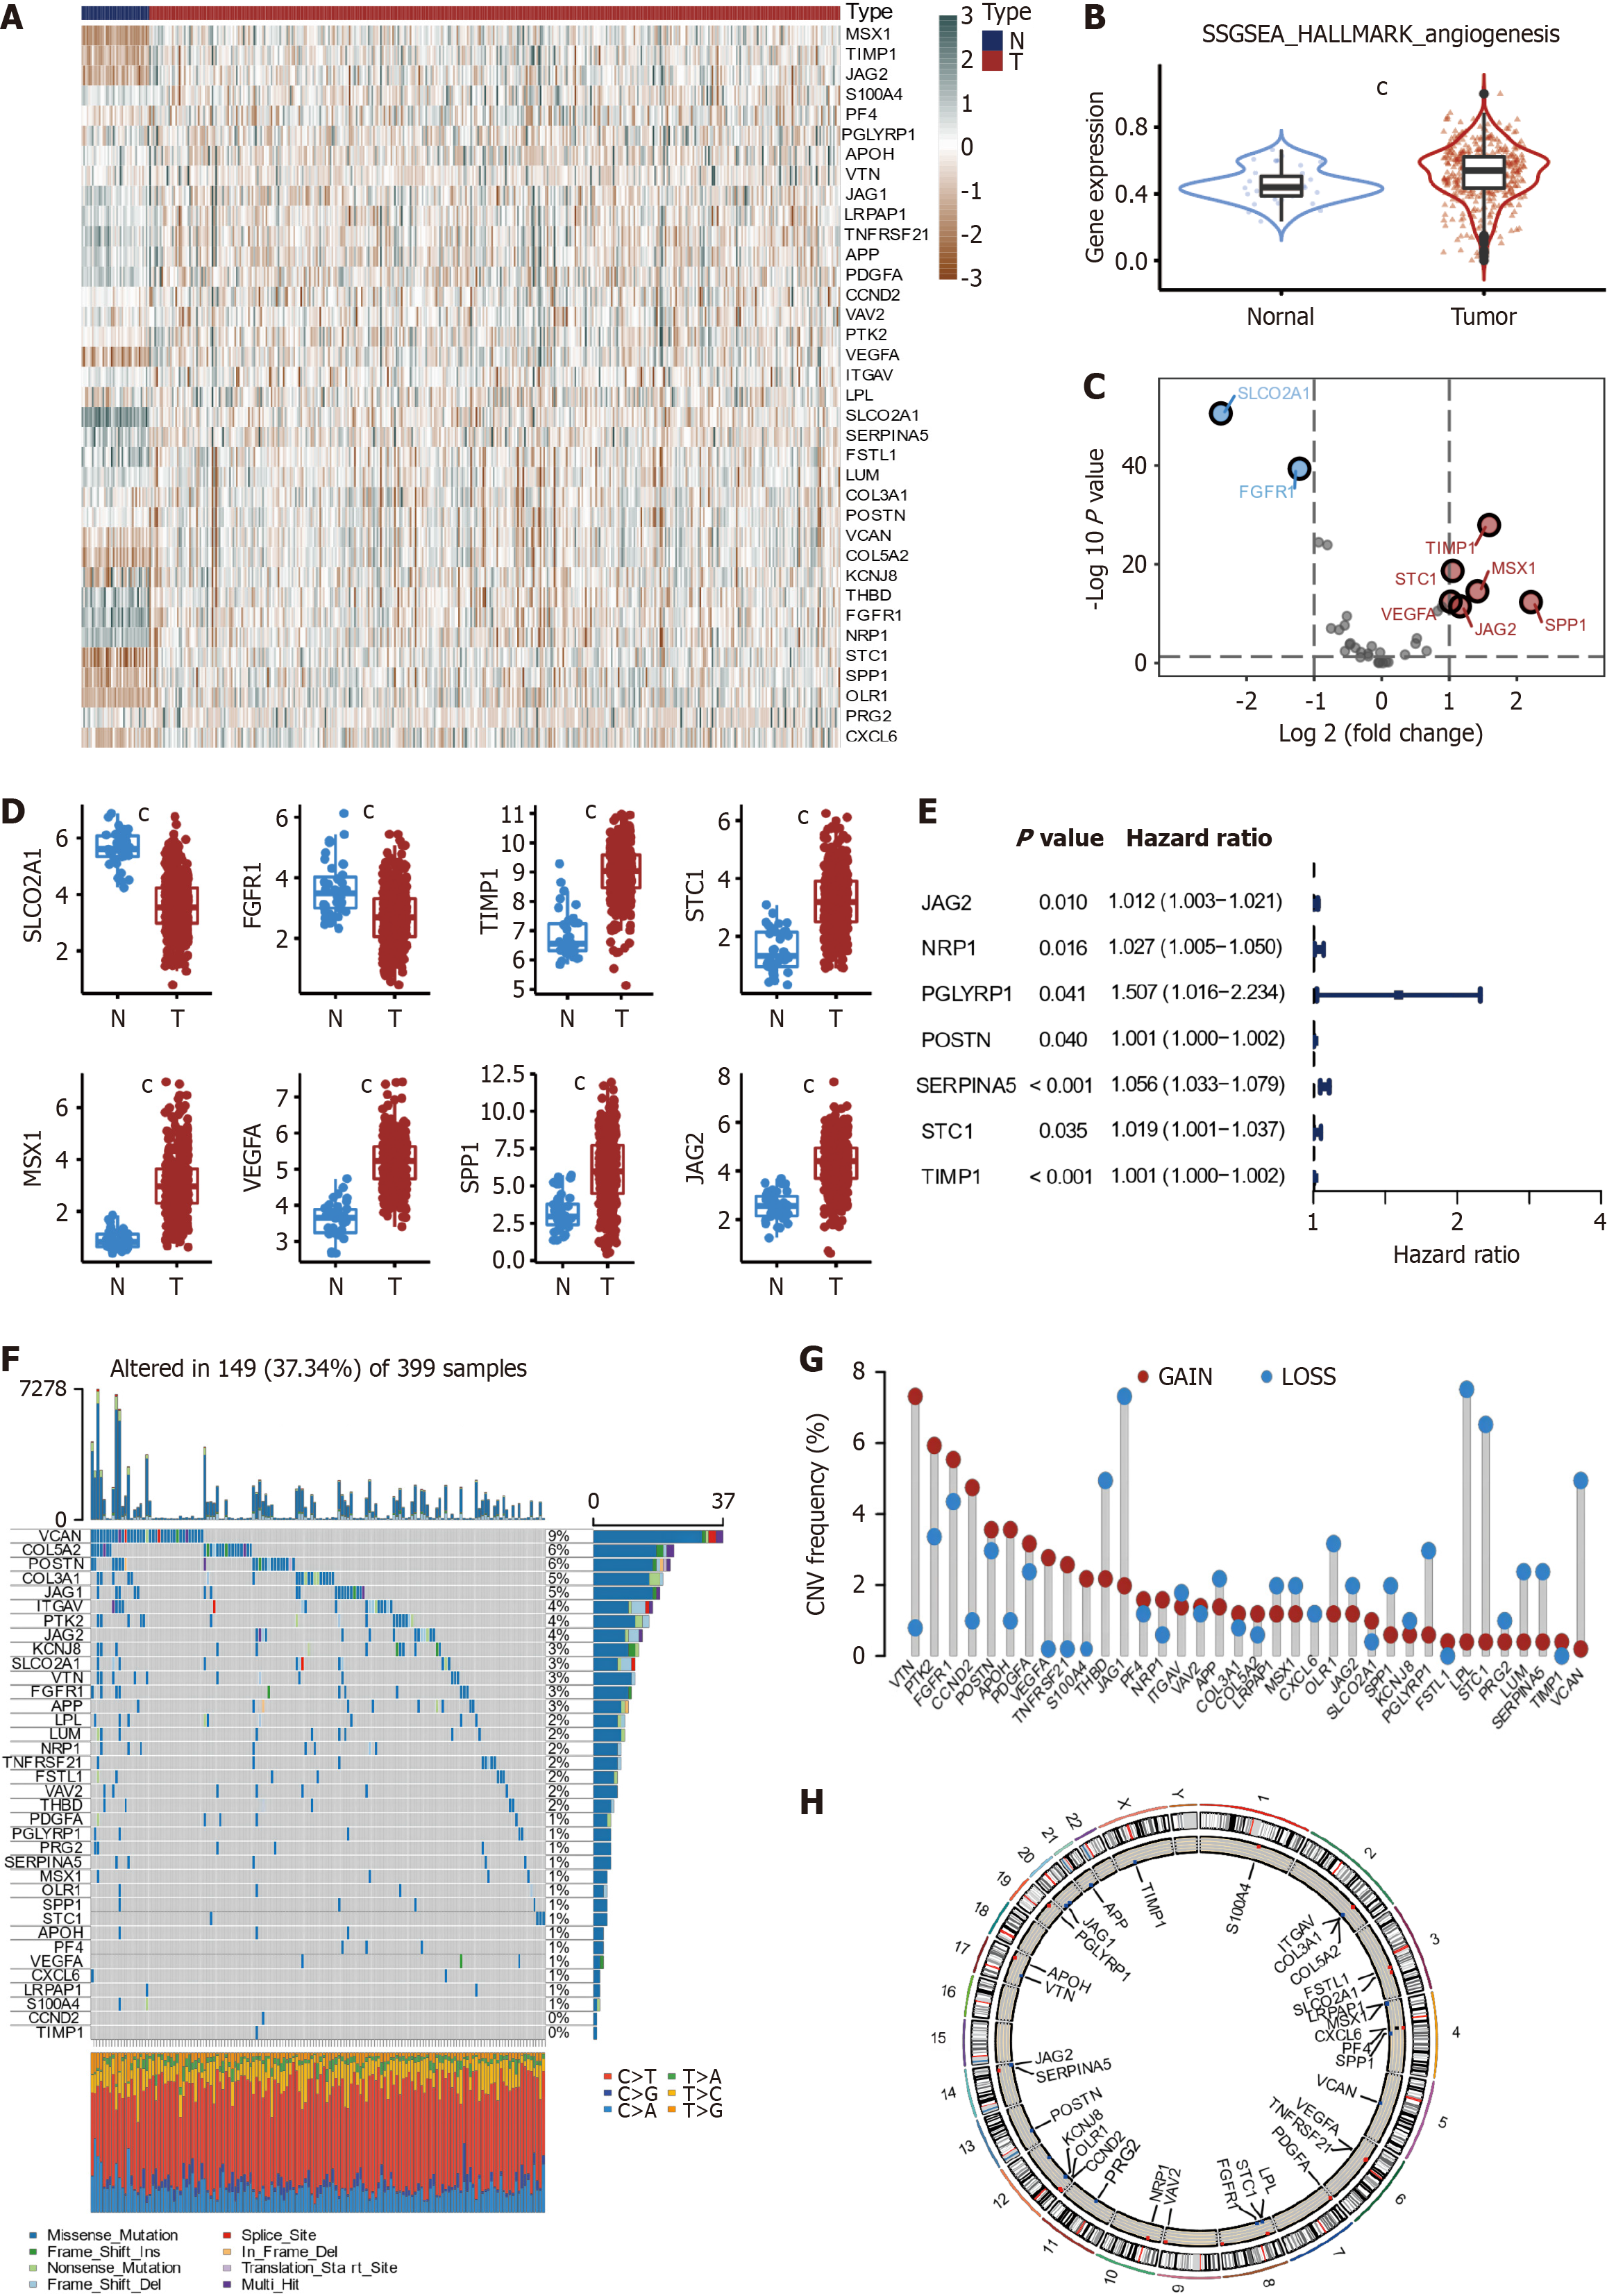
Figure 2 Expression landscape of angiogenesis-related genes in colon cancer.
A: Heatmap (green: low expression level; brown: high expression level) of the angiogenesis-related genes (ARGs) between the nontumor (blue) and tumor samples (red); B: Differences in angiogenesis pathway single-sample gene set enrichment analysis score between normal and colon cancer (CC) tissues; C: Volcano plot of the differential ARGs; D: The expression of 8 differentially expressed angiogenesis-related genes between normal and CC tissues; E: Univariate Cox regression analysis of 36 angiogenesis-related genes and seven genes with P < 0.05; F: Mutation frequencies and types of ARGs; G: The location of copy number variation (CNV) alteration of 36 ARGs on 23 chromosomes; H: Chromosomal localization of ARGs with CNV. ARGs: Angiogenesis-related genes. cP < 0.001.
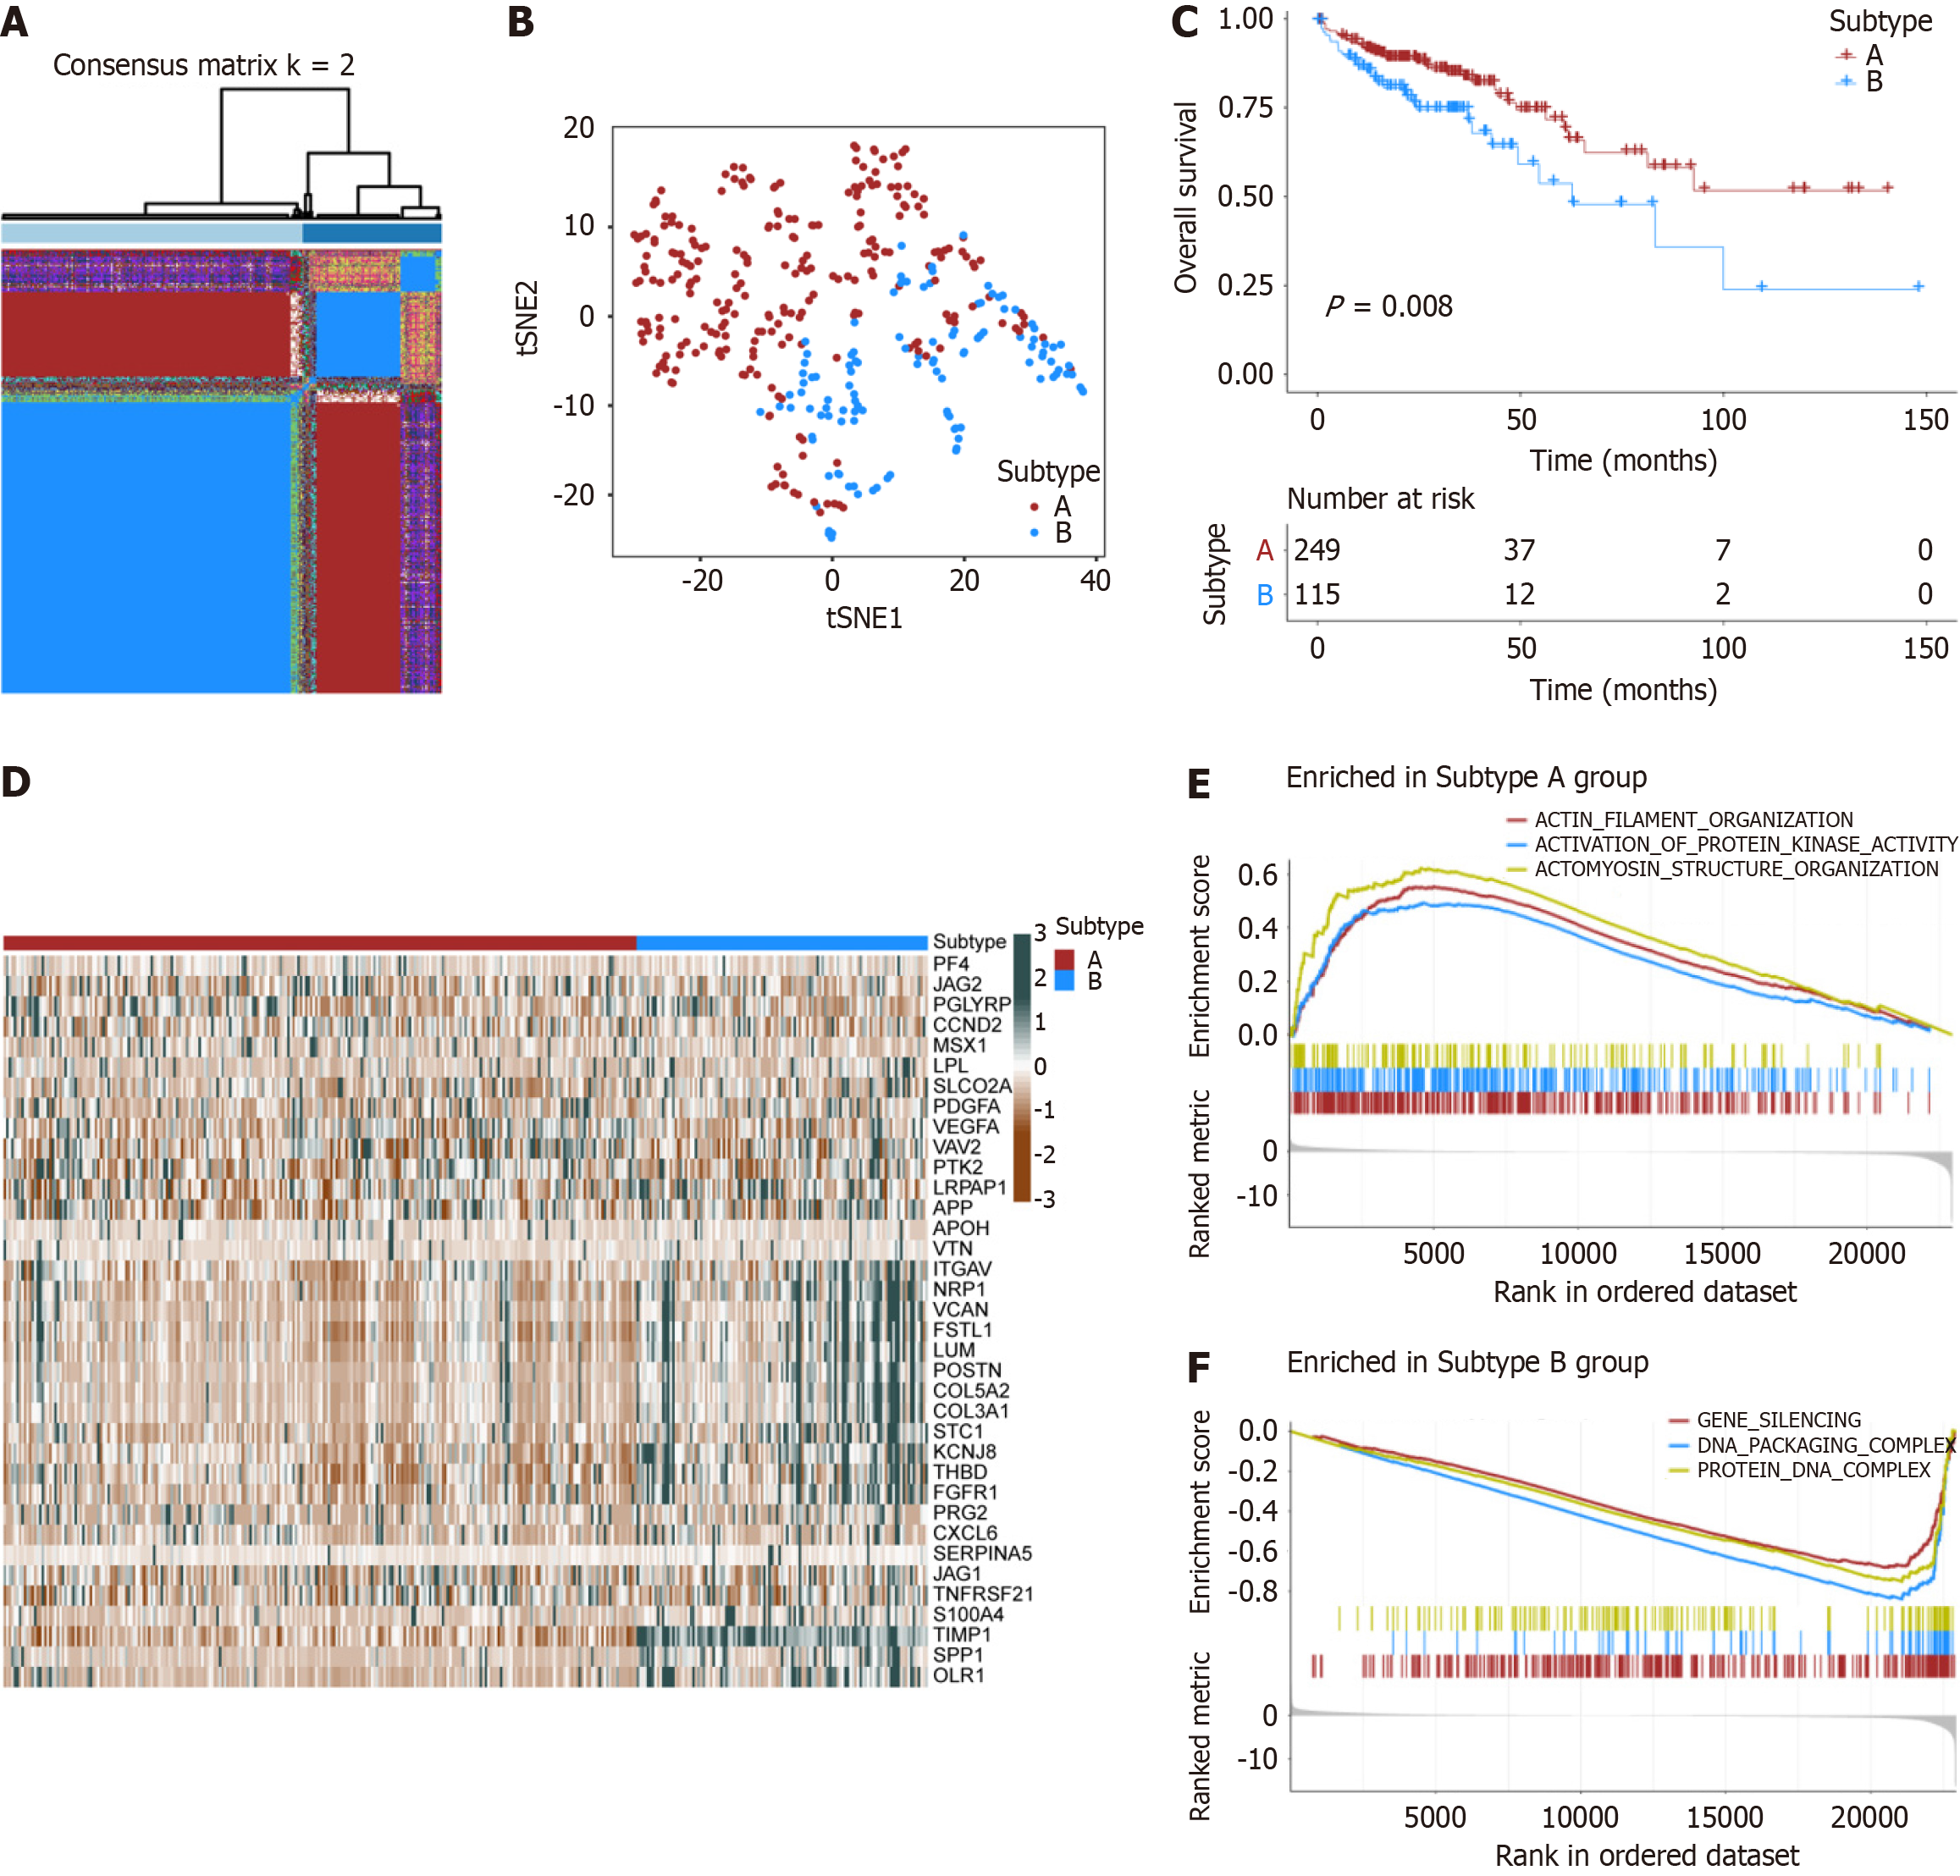
Figure 3 Tumor consensus clustering based on angiogenesis-related genes.
A: Two angiogenesis clusters were identified according to the K-means consensus clustering matrix (k = 2); B. The t-SNE analysis for the transcriptome profiles of two angiogenesis subtypes; C: Kaplan-Meier curves between two angiogenesis subtypes; D: The heatmap showed the differences in expression levels of angiogenesis-related genes between the two angiogenesis subgroups; E and F: Gene Set Enrichment Analysis for Go terms in two angiogenesis subtypes.
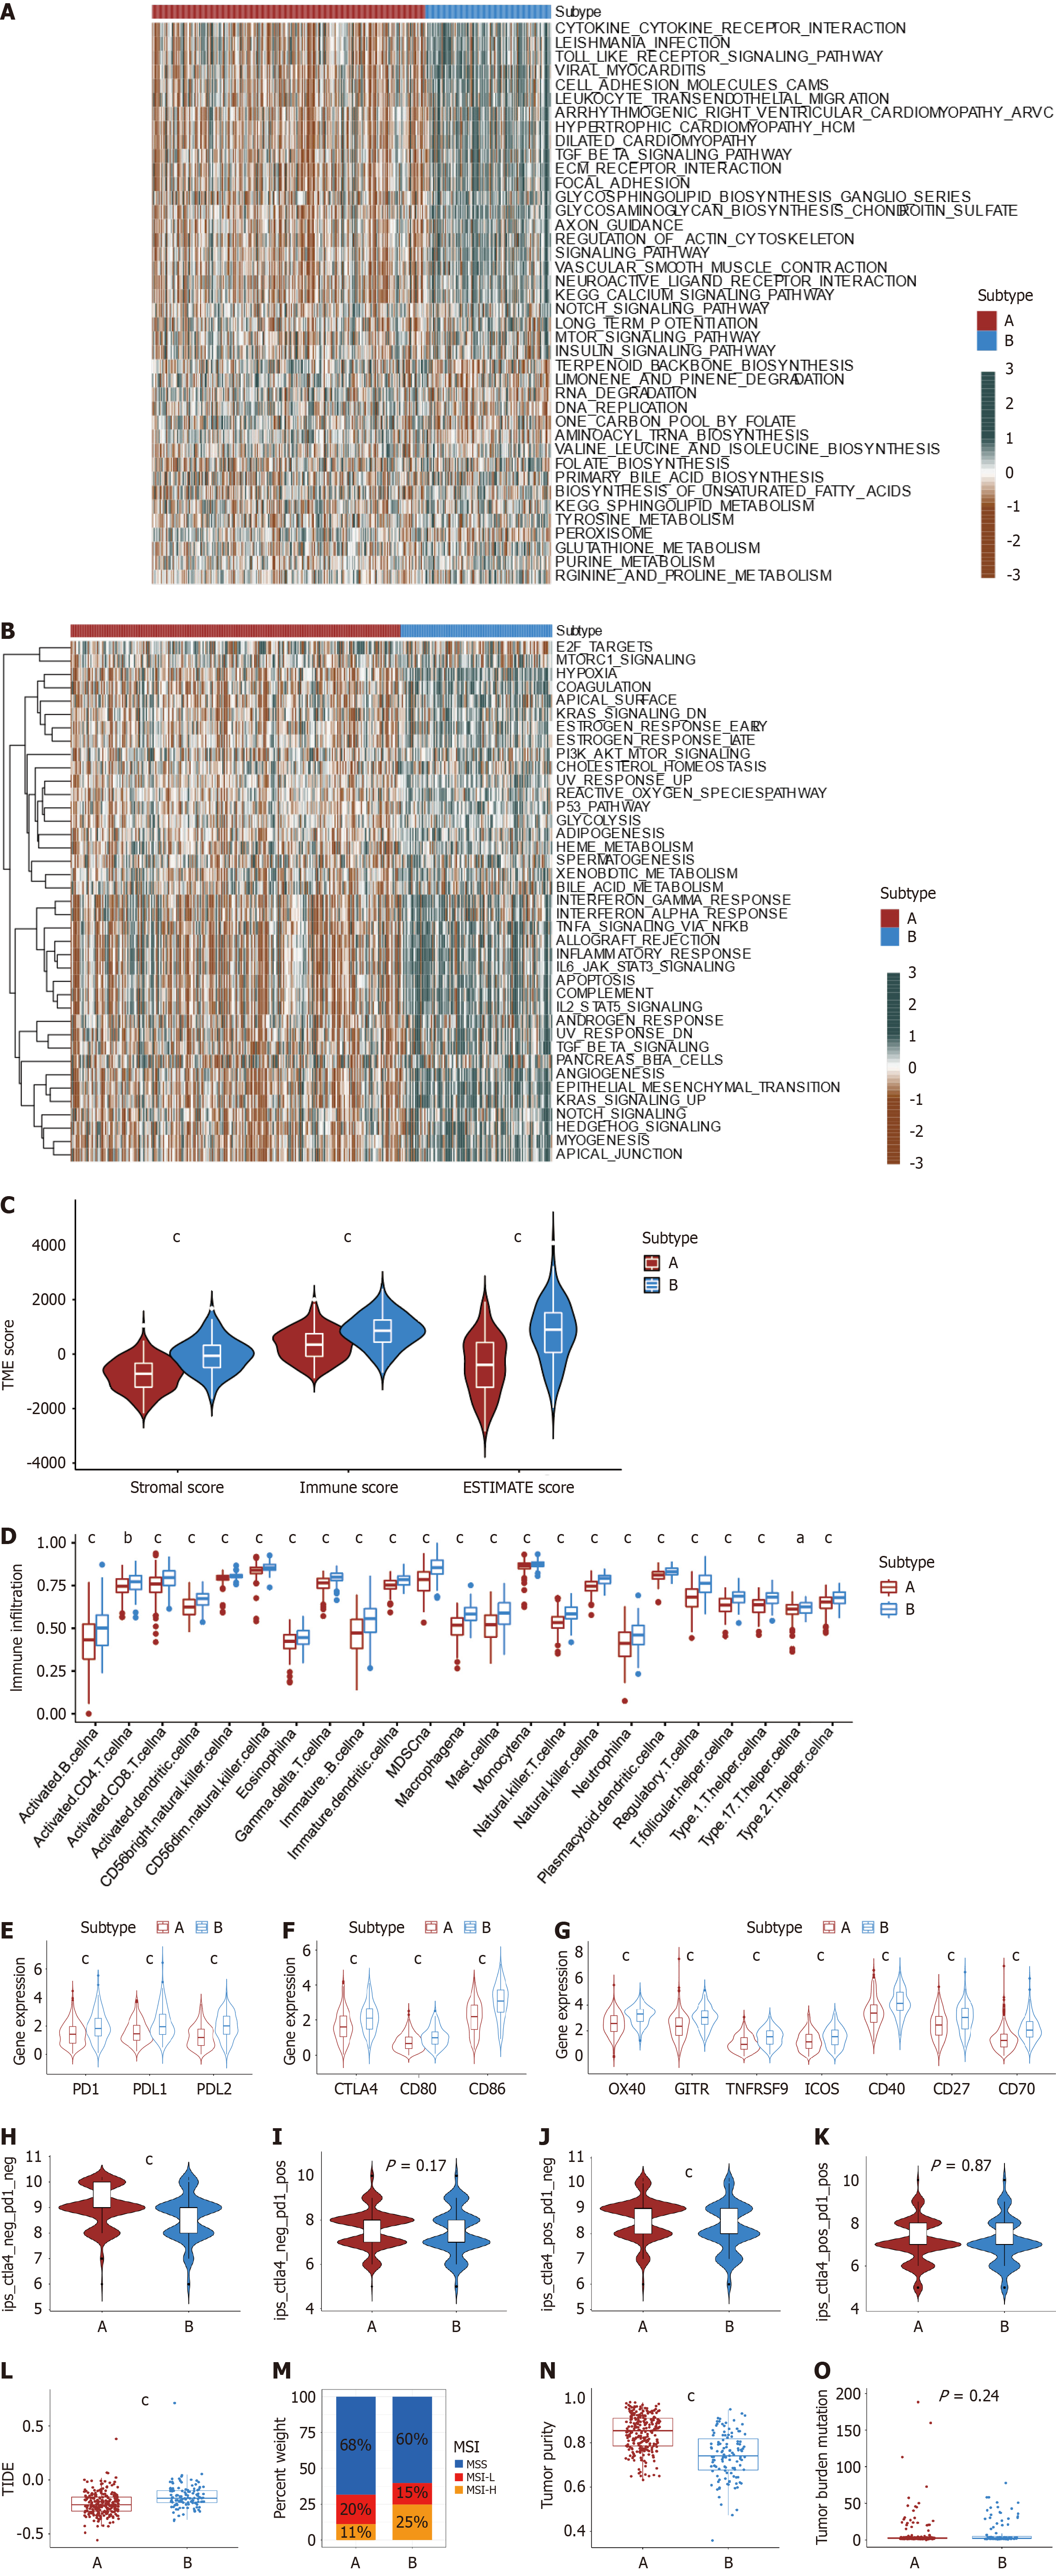
Figure 4 Identification of characterization in angiogenesis subtypes.
A and B: The differences in Kyoto Encyclopedia of Genes and Genomes and HALLMARKER pathway single-sample gene set enrichment analysis scores between the two angiogenesis subgroups; C: Correlations between the two angiogenesis subgroups and tumor microenvironment score; D: The abundance of immune cells in two angiogenesis subtypes; E: Differential expression of PD-1, PD-L1, and PD-L2 between two angiogenesis subtypes (P < 0.001); F: Differential CTLA4, CD80, and CD86 expression between two angiogenesis subtypes (P < 0.001); G: Differential expression of OX40, GITR, TNFRSF9, ICOS, CD40, CD27 and CD70 between two angiogenesis subtypes (P < 0.001); H-K: Immunopheno score in two angiogenesis subtypes; L: Tumor Immune Dysfunction and Exclusion scores in two angiogenesis subtypes; M: The proportion of angiogenesis subtypes in the three modification patterns [microsatellite stability (MSI), blue; MSI-low red; MSI-high orange]; N: Differences in tumor purity between two angiogenesis subtypes in colon cancer (CC) patients (P < 0.001); O: Differences in tumor mutational burden between two angiogenesis subtypes in CC patients (P < 0.001). aP < 0.05; bP < 0.01; cP < 0.001.
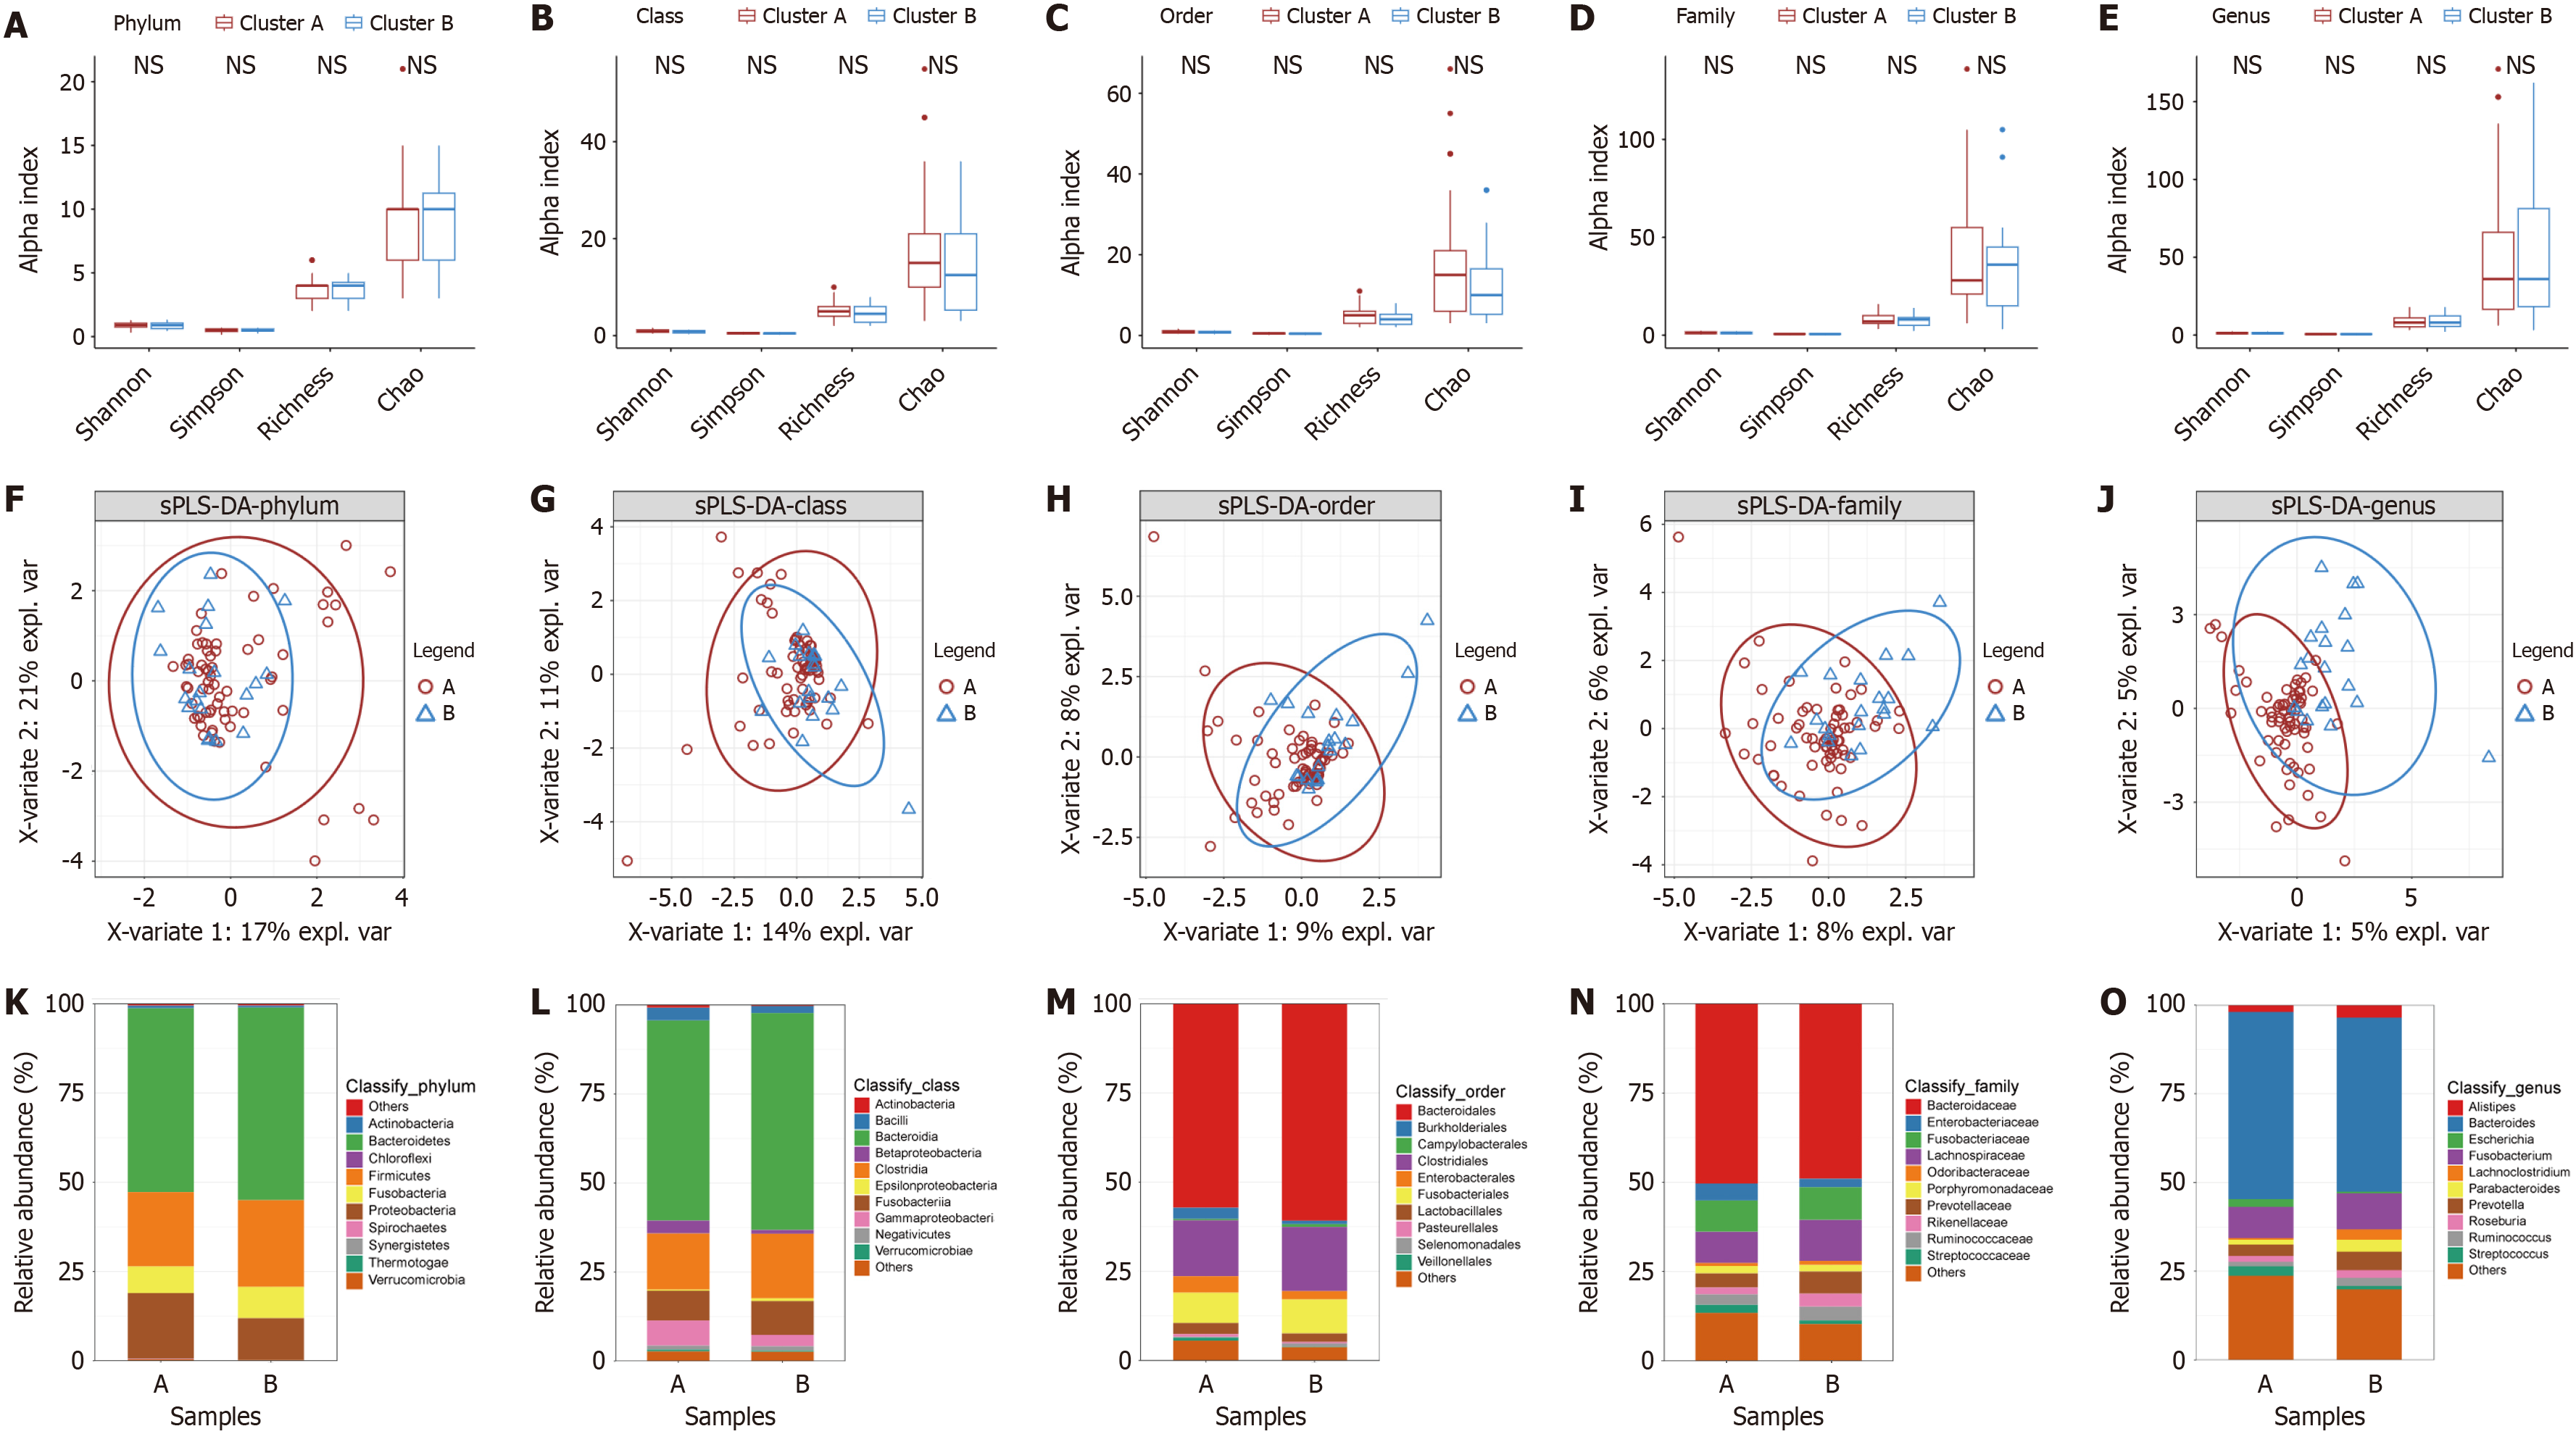
Figure 5 Identification of intratumoral microbial compositions in angiogenesis subtypes.
A-E: The alpha diversity (Shannon index, Simpson index, richness index, and Chao index) among different subtypes at the phylum, class, order, family, and genus levels; F-J: The Partial least squares discrimination analysis maps among different subtypes at the phylum, class, order, family, and genus levels; K-O: The microbiota profiles of the top 10 most abundant microbe in two subtypes at the phylum, class, order, family, and genus levels.
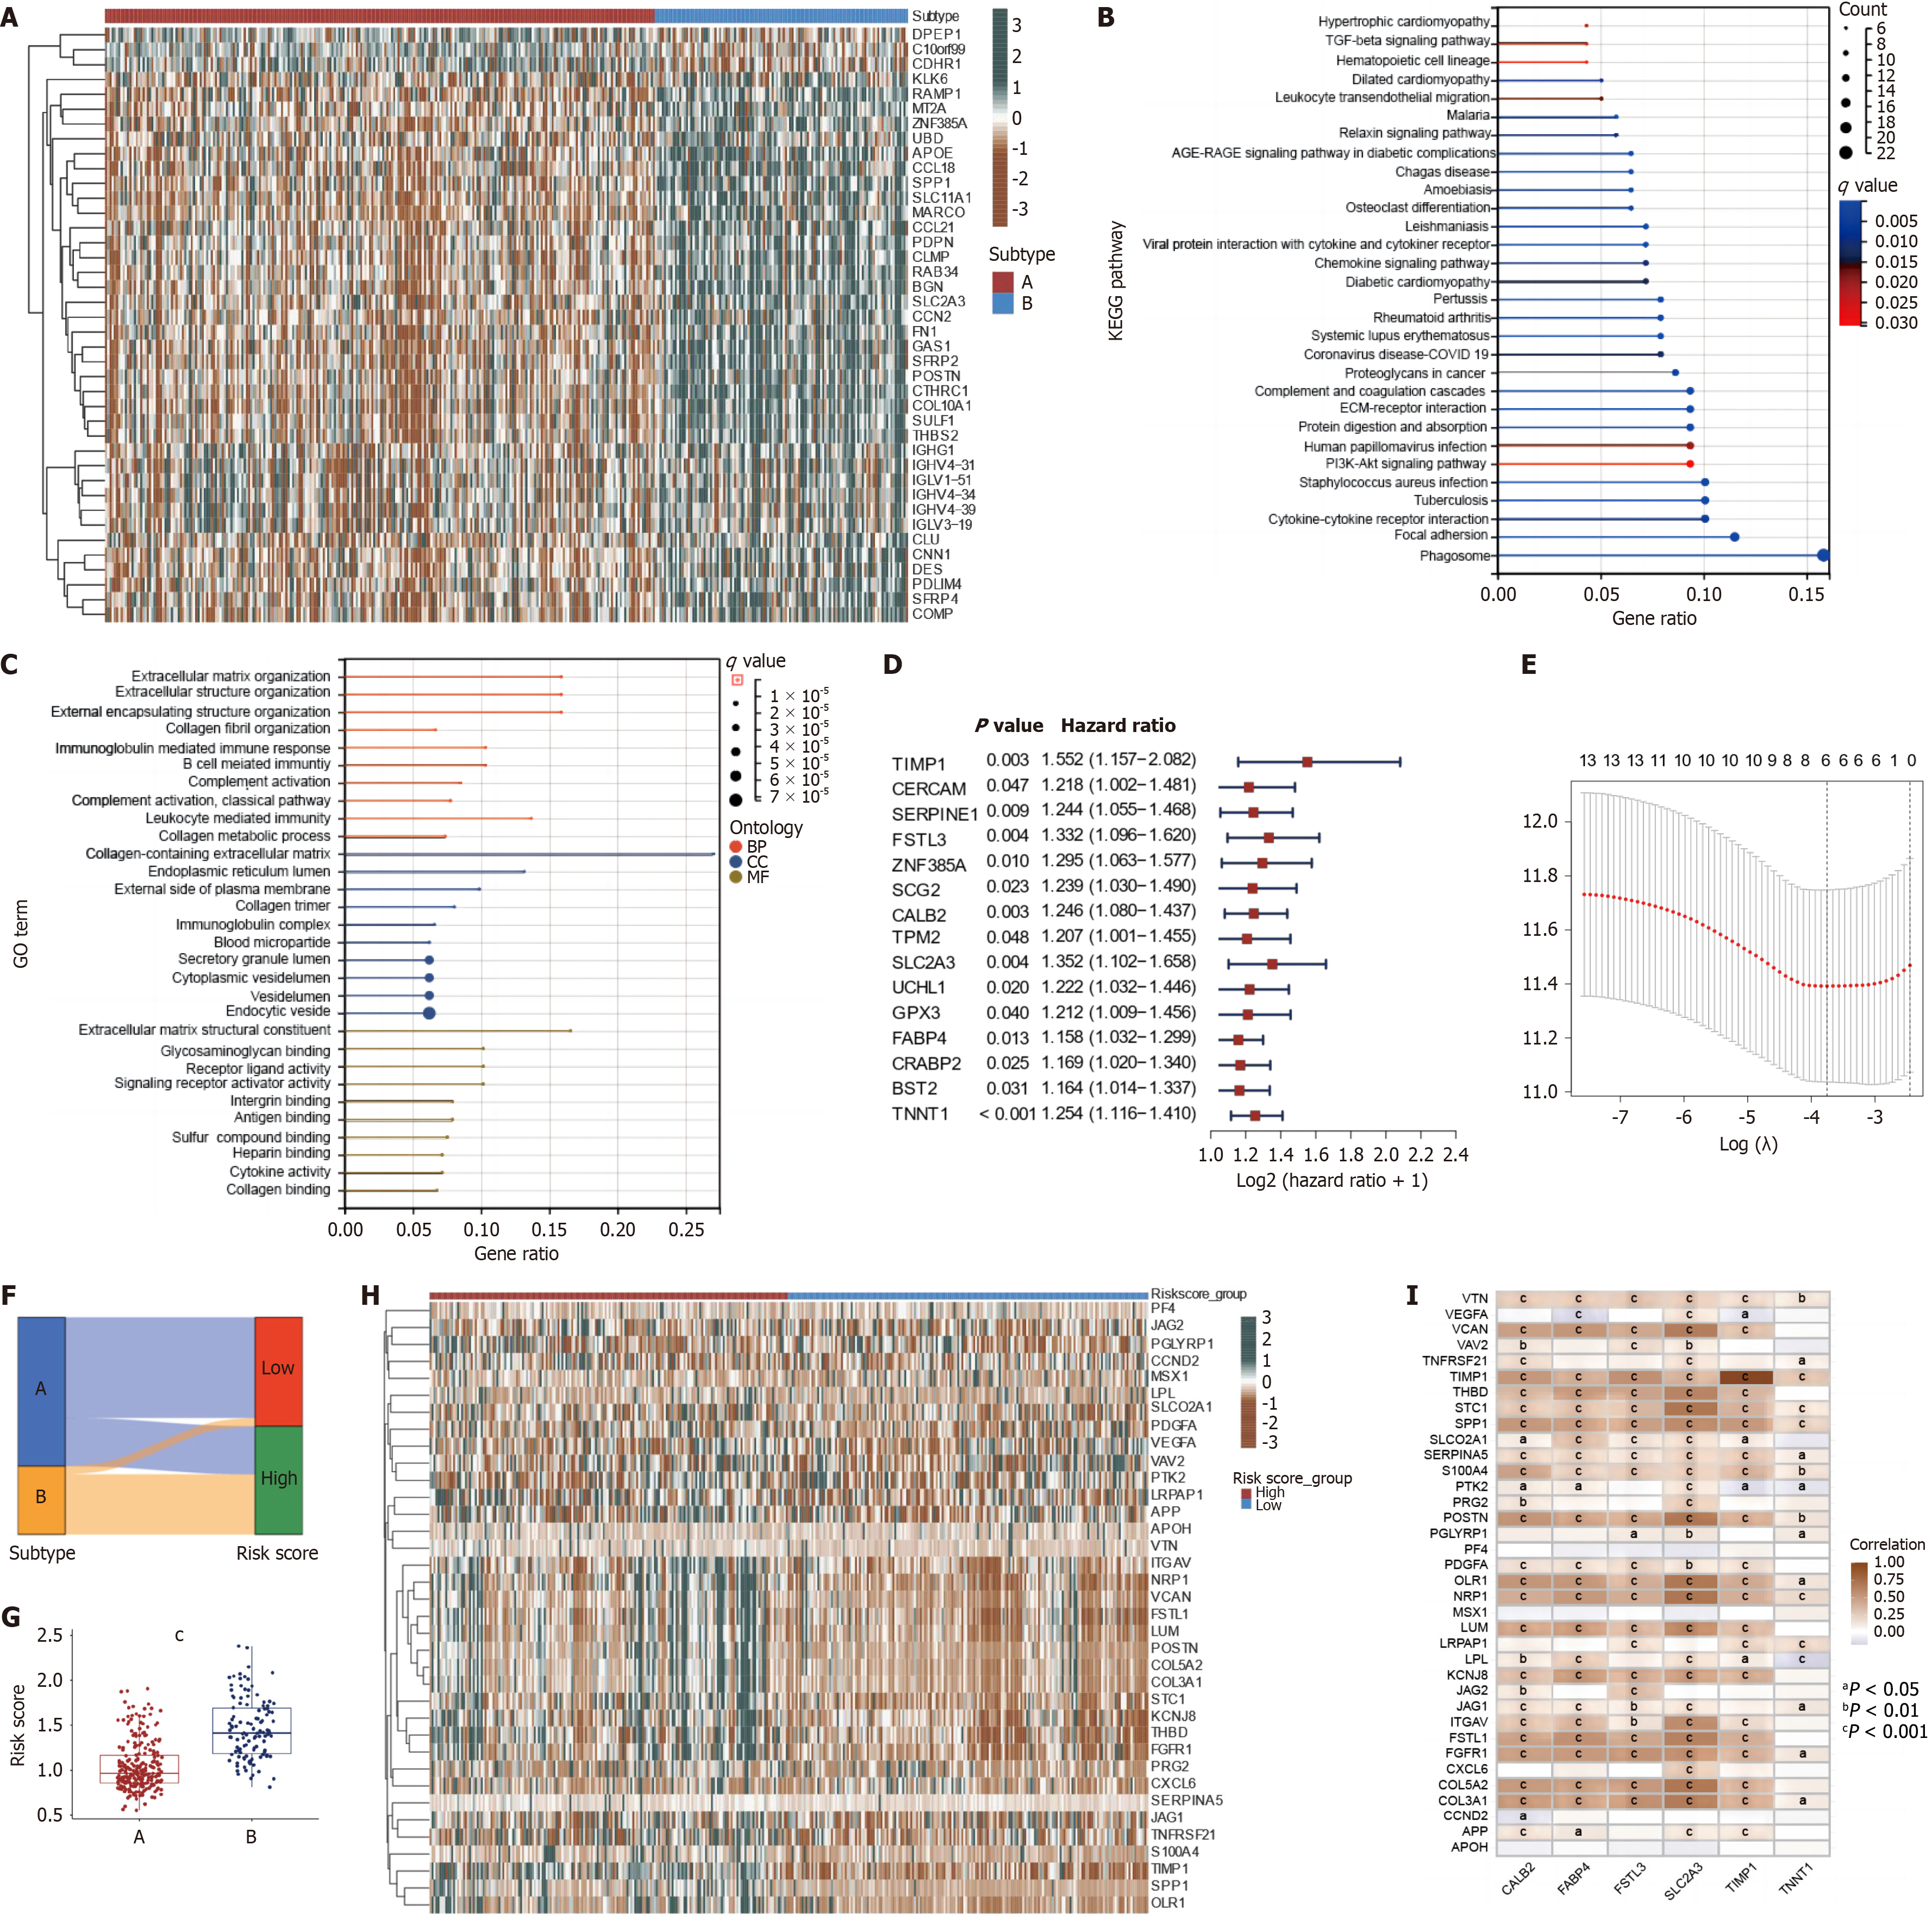
Figure 6 Identification of differentially expressed genes between angiogenesis subtypes and construction of the prognostic model.
A: Differentially expressed genes (DEGs) between two angiogenesis subtypes; B and C: Kyoto Encyclopedia of Genes and Genomes and Gene Ontology enrichment analyses of DEGs between two angiogenesis subtypes; D: Univariate Cox regression analysis of each DEG between two angiogenesis subtypes and 13 genes with P < 0.05; E: Cross-validation for tuning the parameter selection in the Least absolute shrinkage and selection operator regression; F: Sankey diagram of subtype distributions in angiogenesis subtypes and angiogenesis-related score (ARS) groups; G: Differences in ARS among two angiogenesis subtypes in colon cancer patients (P < 0.001); H: Heatmap (green: low expression level; brown: high expression level) of the angiogenesis-related genes between the low and high ARS groups; I: Correlations between the expression of 36 Angiogenesis related-genes and selected 6 genes in the ARS model. aP < 0.05; bP < 0.01; cP < 0.001.
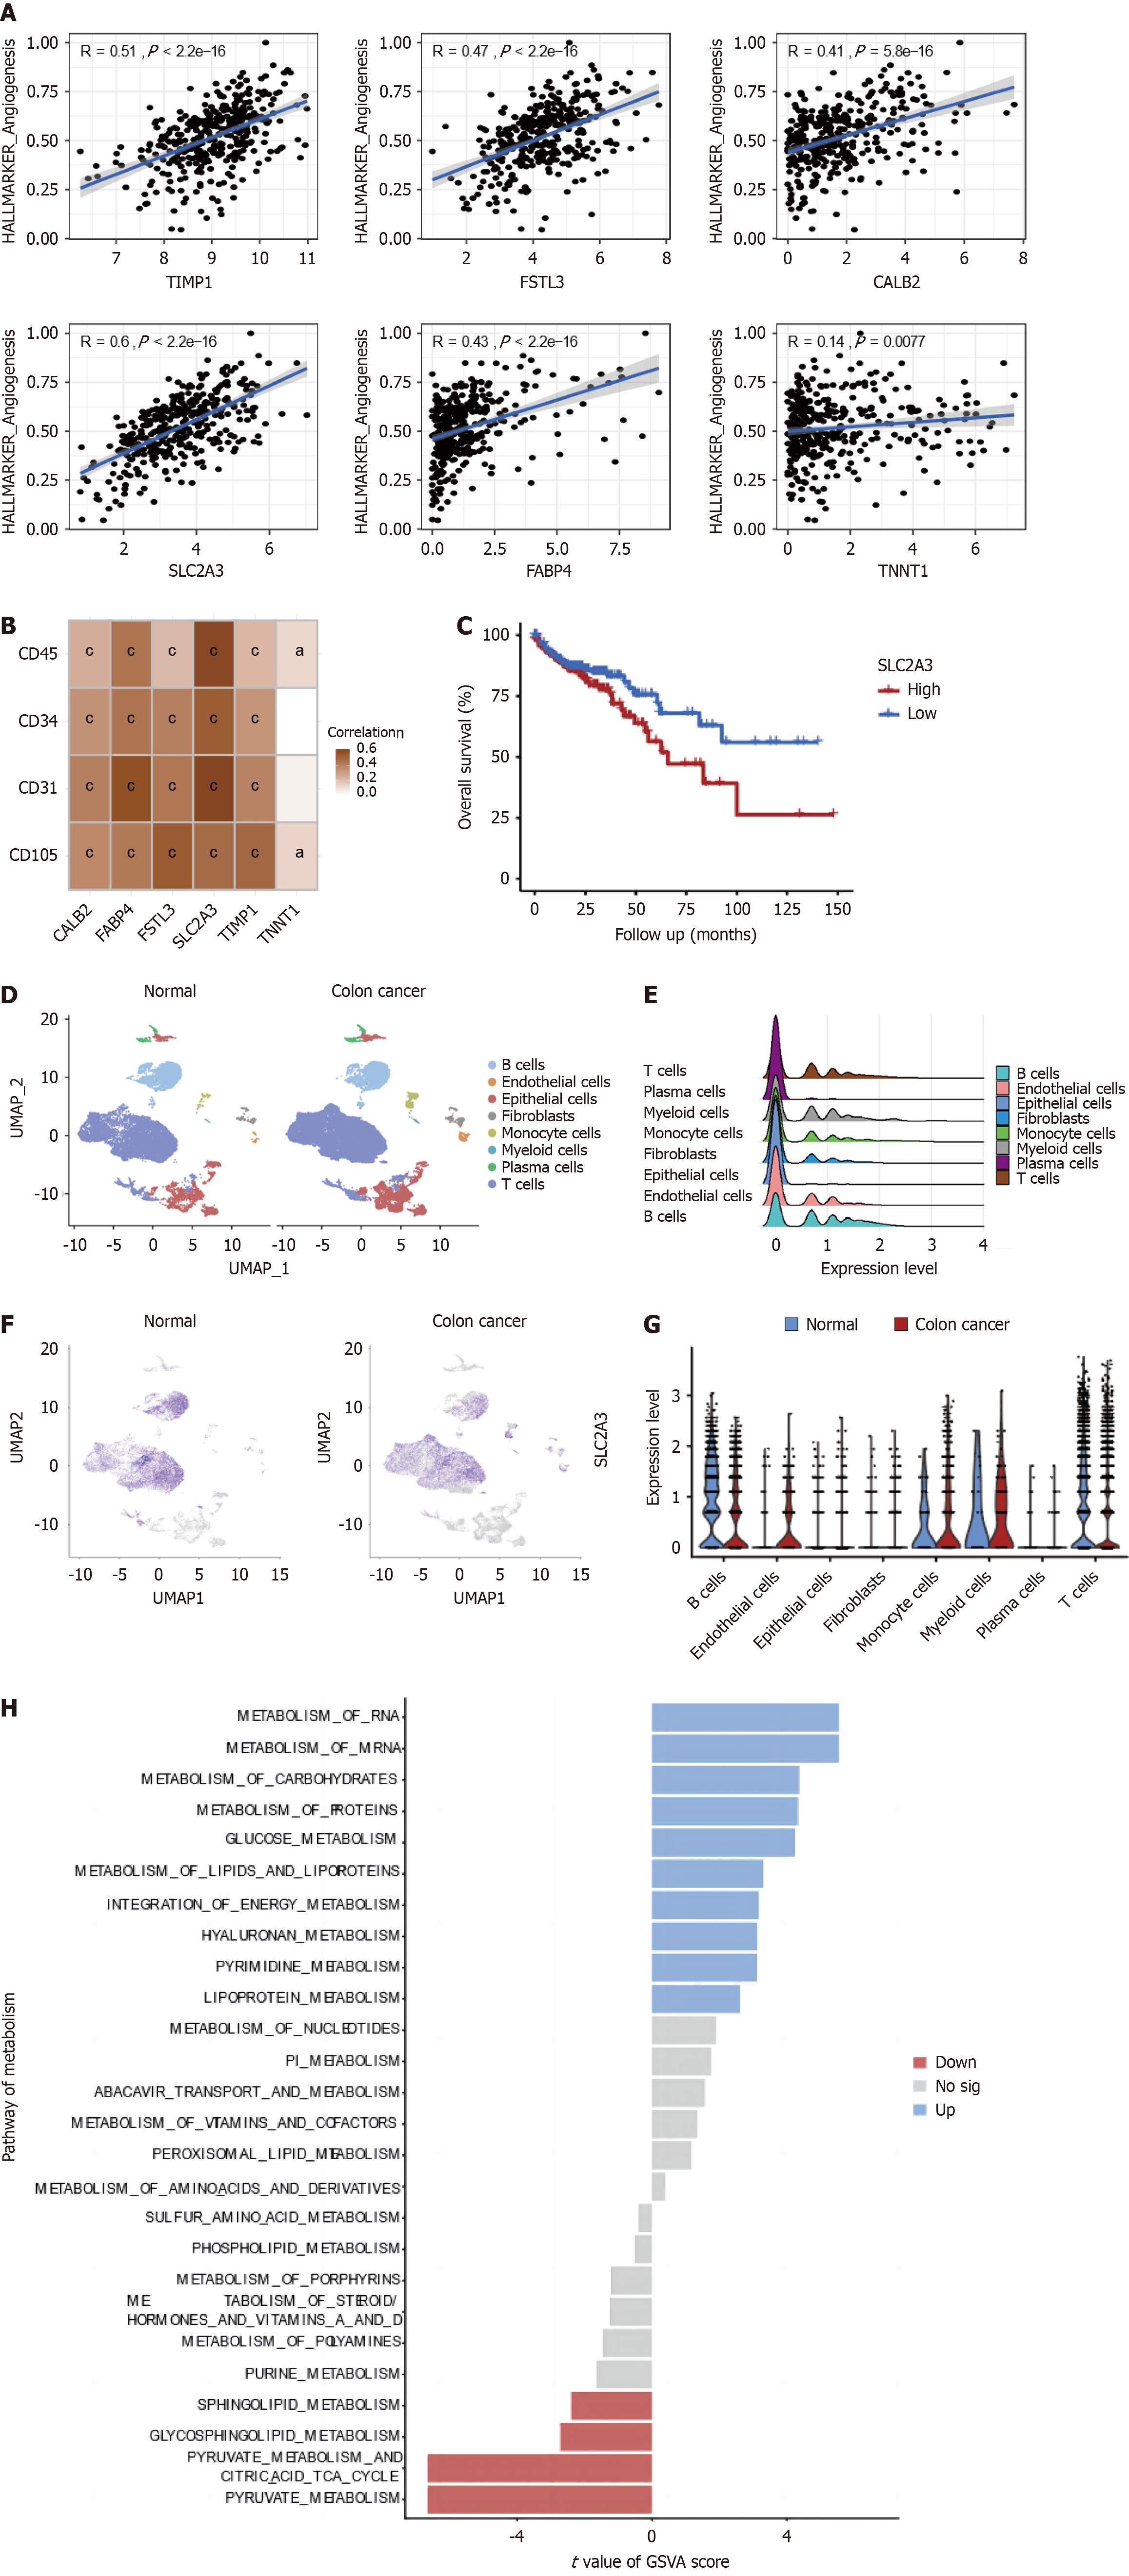
Figure 7 Single-cell analysis for SLC2A3 in colon cancer.
A: Correlations between selected 6 genes in the angiogenesis-related score (ARS) model and angiogenesis pathway single-sample gene set enrichment analysis score; B: Correlations between selected 6 genes in the ARS model and marker of the endothelial cell; C: Kaplan-Meier survival curves between low and high expression of SLC2A3 groups; D: Different distinct clusters in normal and colon cancer (CC) tissue by t-SNE analysis; E: The expression levels of SLC2A3 in different cell types; F: The expression levels of SLC2A3 in normal and CC tissue; G: The expression levels of SLC2A3 in different cell types between normal and CC tissue; H: Differences in Gene Set Variation Analysis analysis of metabolism-related pathways in endothelial cells between normal and CC tissues. aP < 0.05; bP < 0.01; cP < 0.001.
Figure 8 Immunohistochemistry, and immunofluorescent for SLC2A3 and cell migration, proliferation, and tube formation for SLC2A3 overexpression cells.
A: The immunohistochemistry of SLC2A3 in normal and colon cancer (CC) tissue; B: Immunofluorescence experiment demonstrates colocalization of SLC2A3 and CD31 in CC tissue; C: Cell proliferation ability of SLC2A3 overexpression cells was measured using the EdU experiment; D: Migratory ability of SLC2A3 overexpression cells was measured using the transwell migration assay; E: Tube formation assay was used to determine the effect of SLC2A3 overexpression on angiogenesis, and the number of nodes and total length were measured using Image J software. bP < 0.01; cP < 0.001.
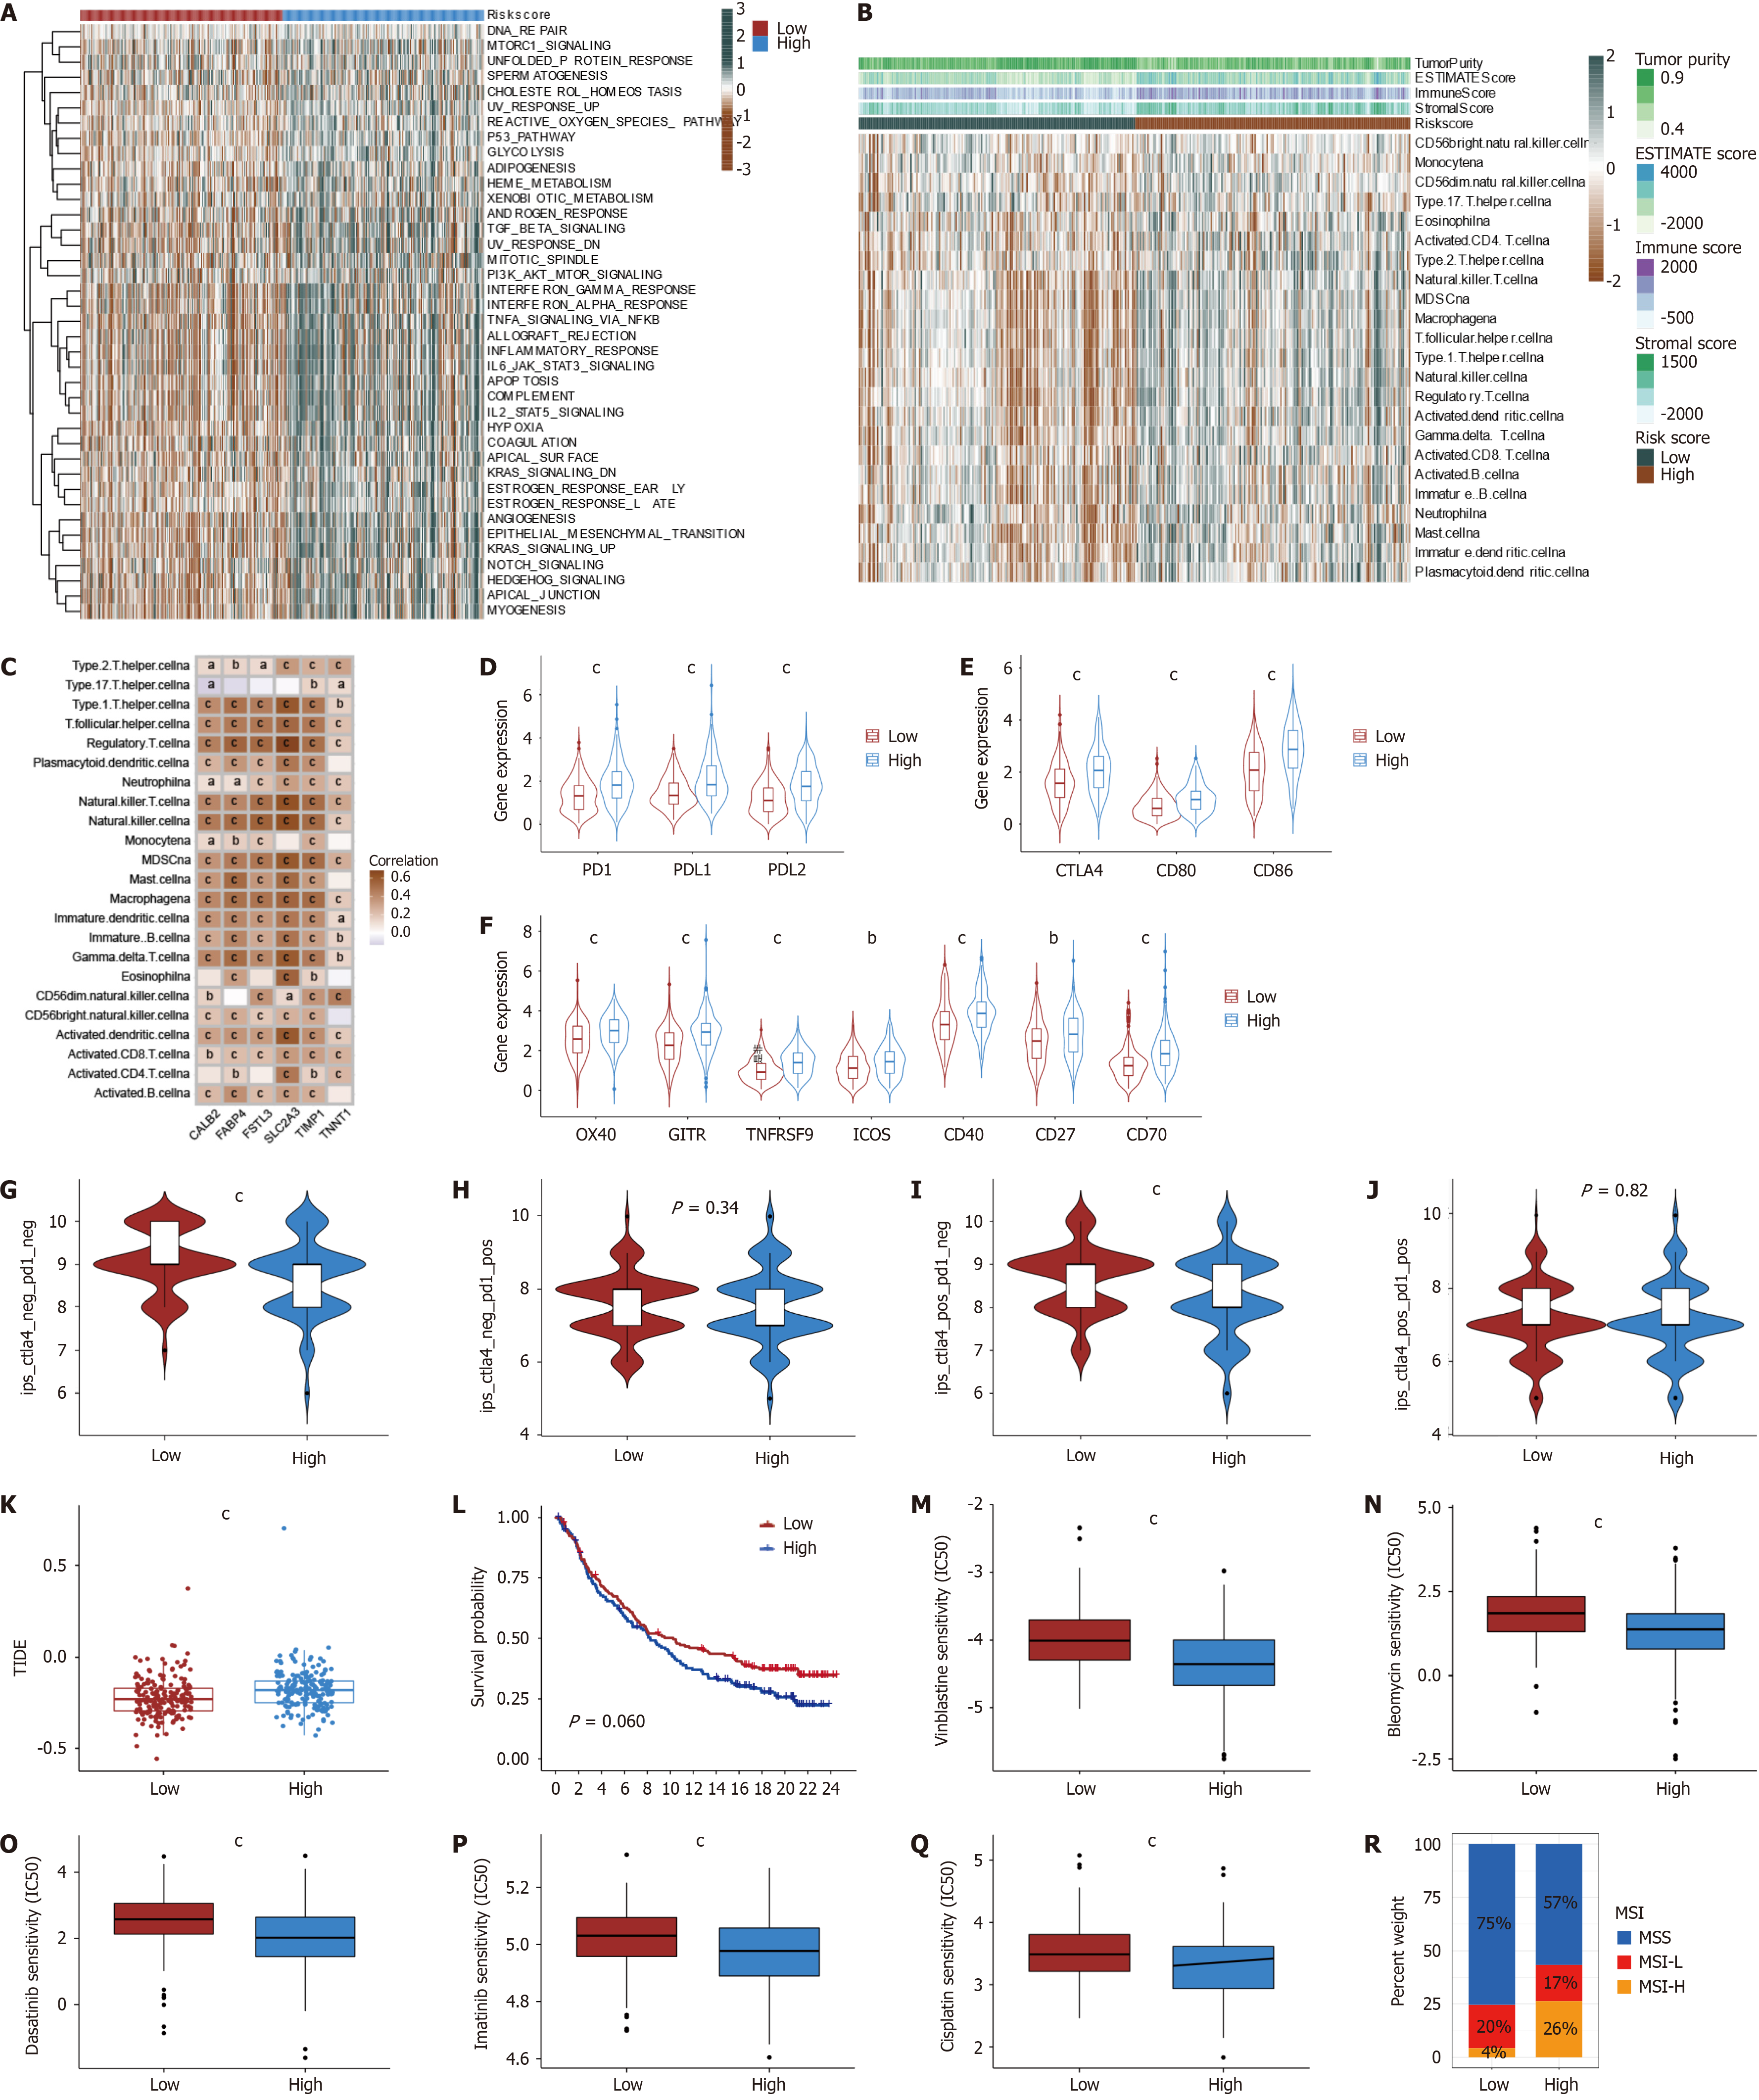
Figure 9 Identification of characterization, the abundance of immune cells, immune checkpoint, and immunotherapy effect between low and high-risk angiogenesis-related signature groups.
A: The heatmap showed the differences in HALLMARKER pathway single-sample gene set enrichment analysis scores between the two angiogenesis-related signature (ARS) groups; B: Differences in the abundance of immune cells between two ARS groups; C: Correlations between the abundance of immune cells and selected 6 genes in the ARS model; D: Differences in PD-1, PD-L1, and PD-L2 expression between two ARS groups (P < 0.001); E: Differences in CTLA4, CD80, and CD86 expression between two ARS groups (P < 0.001); F: Differences in OX40, GITR, TNFRSF9, ICOS, CD40, CD27, CD70 expression between two ARS groups (P < 0.001); G-J: Immunopheno score in two groups; K: Tumor immune dysfunction and Exclusion in two ARS groups; L: Survival analyses for two ARS groups in the anti-PD-L1 immunotherapy cohort using Kaplan-Meier curves (IMvigor210 cohort, P = 0.060); M-Q: Relationships between ARS groups and chemotherapeutic sensitivity; R: The proportion of high and low ARS groups in the three modification patterns. Microsatellite stability, blue; microsatellite instability-low red; microsatellite instability-high orange. aP < 0.05; bP < 0.01; cP < 0.001.
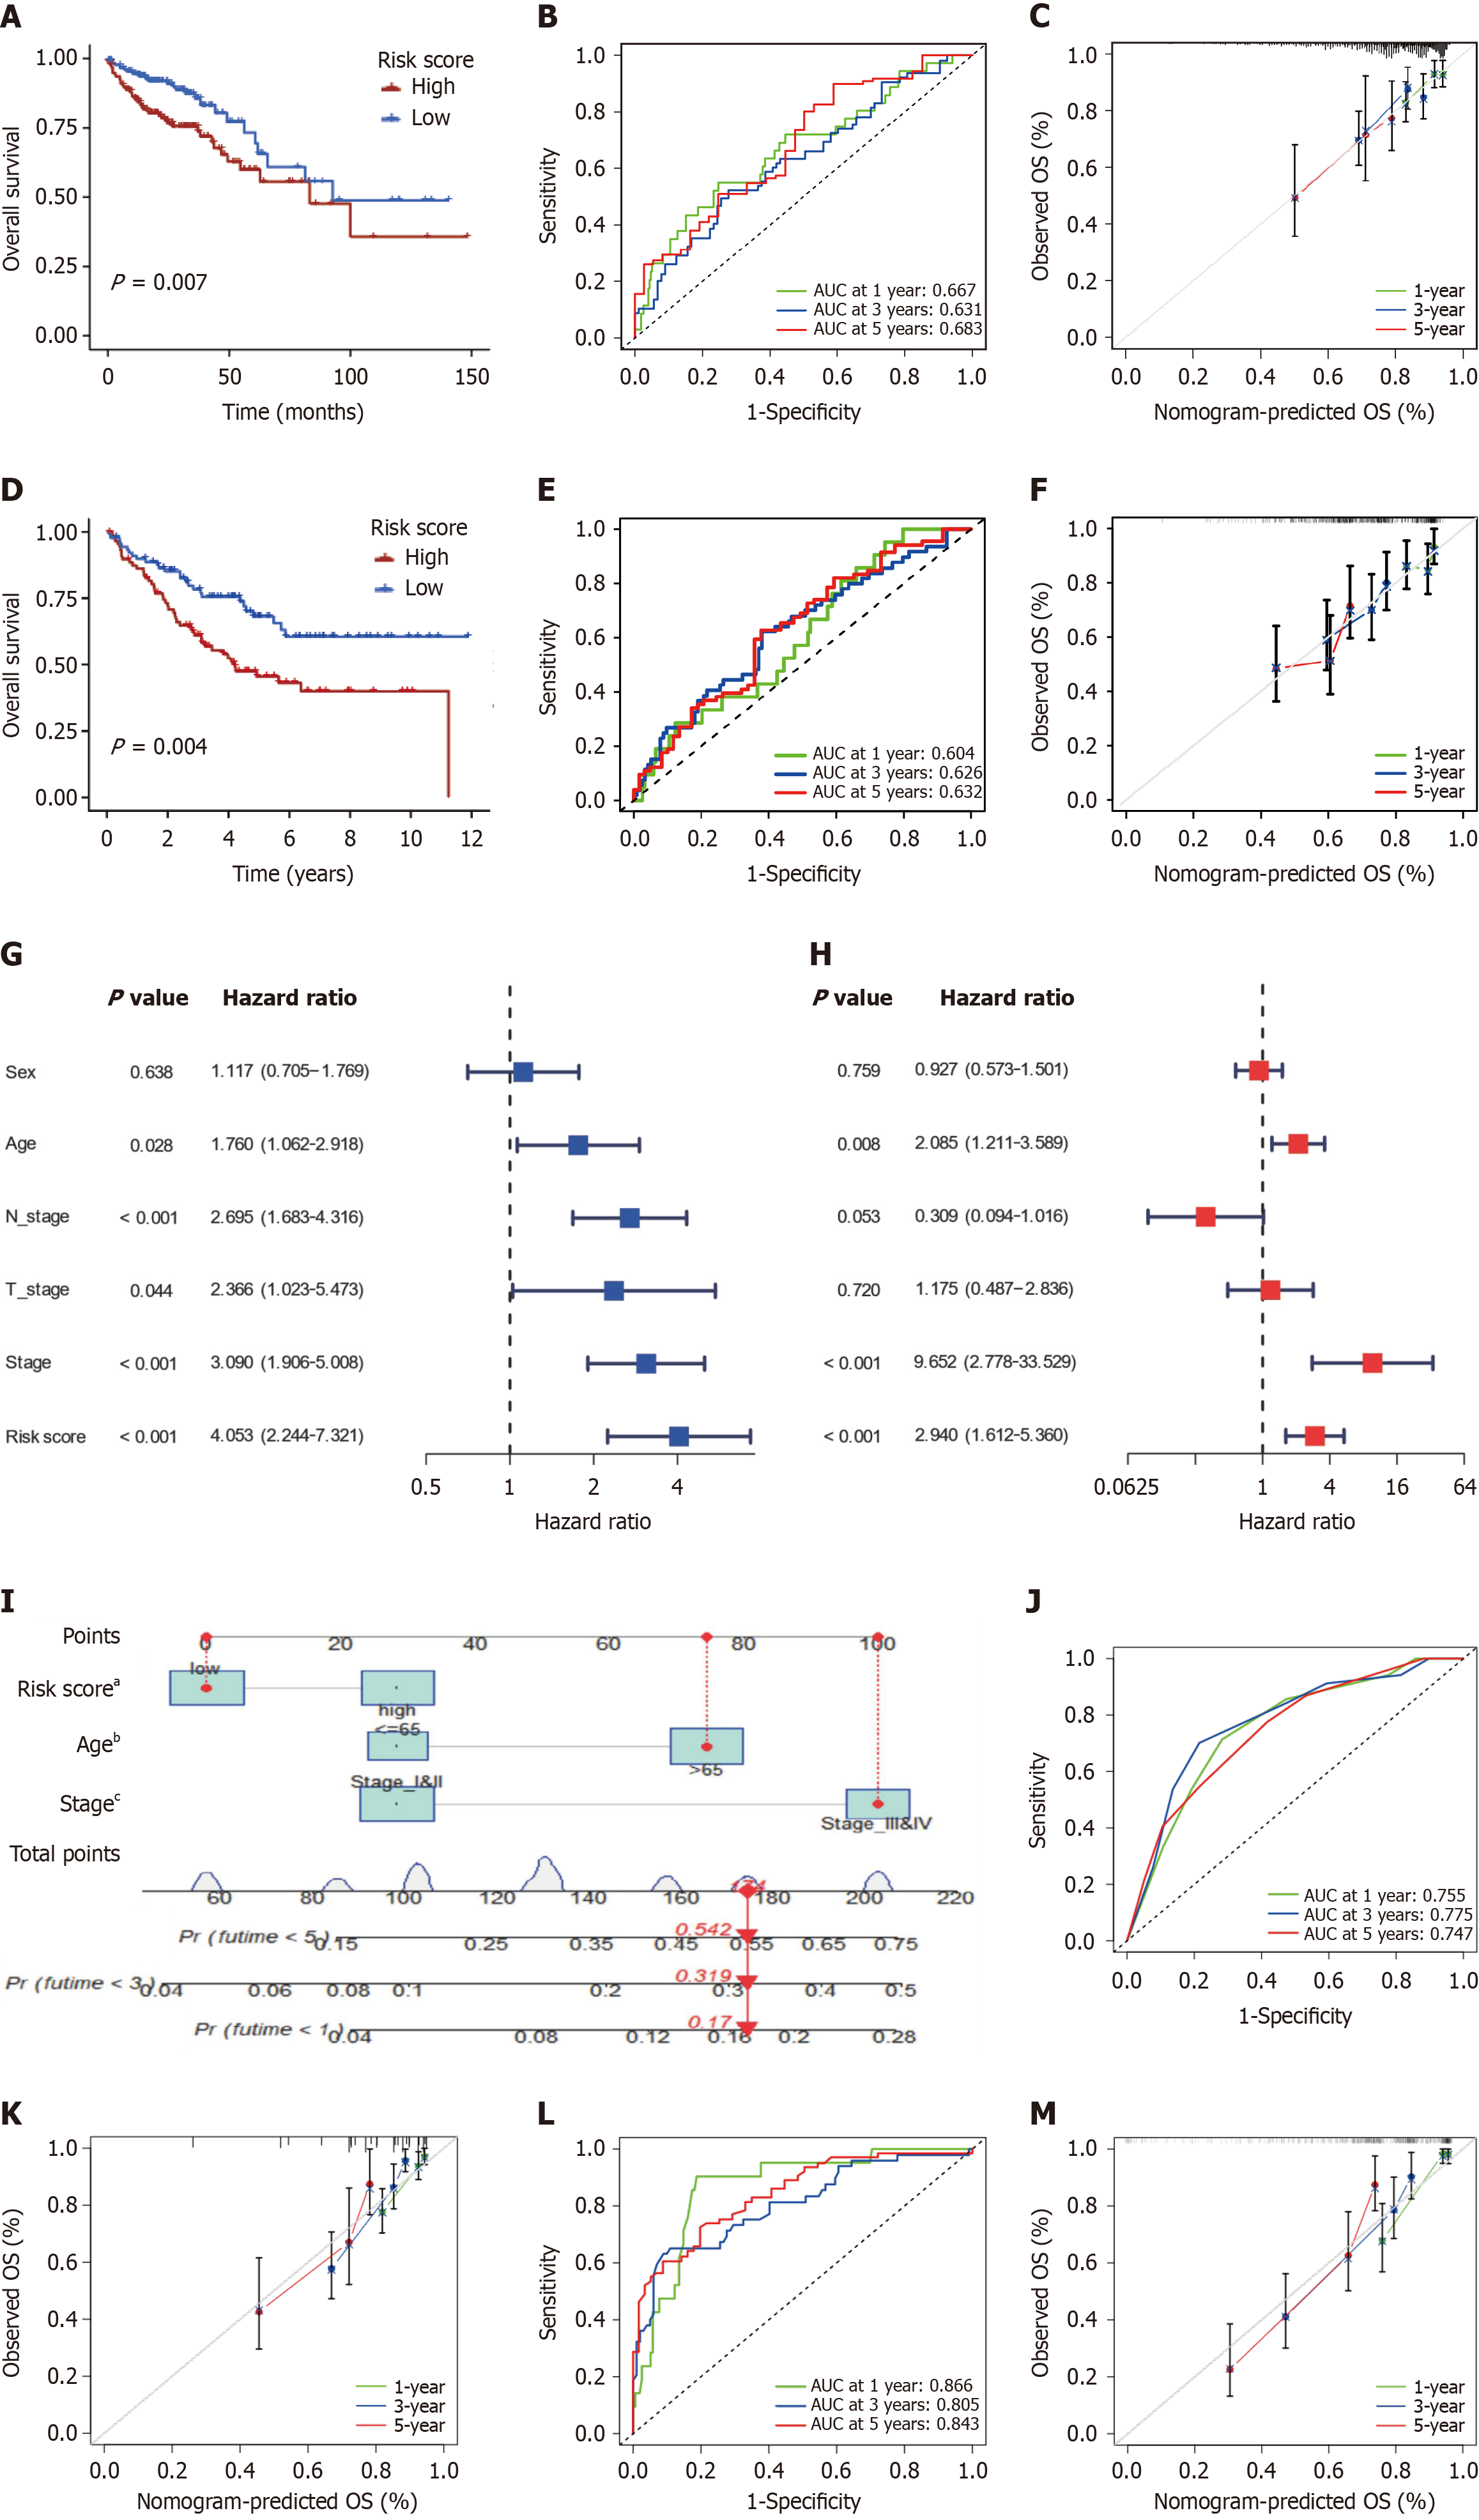
Figure 10 Construction, Internal, and validation of the angiogenesis-related signature model and the Nomogram.
A: Survival analyses for low and high angiogenesis-related signature (ARS) groups in The Cancer Genome Atlas Colon Adenocarcinoma (TCGA-COAD) cohort using Kaplan-Meier curves (P = 0.007); B: Time-dependent receiver operator characteristic (ROC) curves for ARS in the TCGA-COAD cohort; C: Calibration plots for ARS in the TCGA-COAD cohort; D: Survival analyses for low and high ARS groups in the GSE17536 cohort (P = 0.004); E: Time-dependent ROC curves for the ARS in the GSE17536 cohort; F: Calibration plots for the ARS in the GSE17536 cohort; G and H: Univariate and Multivariate Cox regression analysis of clinicopathological features and the ARS; I: Nomogram based on ARS, age, and tumor stage for predicting overall survival; J and K: Time-dependent ROC curves and calibration plot for nomogram in TCGA cohort; L and M: Time-dependent ROC and calibration plot curves for nomogram in GSE17536 cohort. AUC: Area under the curve. aP < 0.05; bP < 0.01; cP < 0.001.
- Citation: Yang Y, Qiu YT, Li WK, Cui ZL, Teng S, Wang YD, Wu J. Multi-Omics analysis elucidates tumor microenvironment and intratumor microbes of angiogenesis subtypes in colon cancer. World J Gastrointest Oncol 2024; 16(7): 3169-3192
- URL: https://www.wjgnet.com/1948-5204/full/v16/i7/3169.htm
- DOI: https://dx.doi.org/10.4251/wjgo.v16.i7.3169


