Copyright
©The Author(s) 2024.
World J Gastrointest Oncol. Jul 15, 2024; 16(7): 3118-3157
Published online Jul 15, 2024. doi: 10.4251/wjgo.v16.i7.3118
Published online Jul 15, 2024. doi: 10.4251/wjgo.v16.i7.3118
Figure 1 Weighted gene coexpression network analysis combined with immune infiltration reveals immune-related genes.
A: Scale independence, average connectivity, and scale-free topology are determined using a weighted value of β = 16, which satisfies the scale-free network law; B: Dendrogram of coexpression network modules; C: Correlation analysis between modules and matrix scores, immune scores, algorithm scores, and tumor purity in ESTIMAT; D: Scatter plot analysis between the light pink module and immune scores, with orange bars representing the gene distribution of light pink module in 13 patients receiving ablation for hepatocellular carcinoma (HCC), and red bars representing the distribution of immune scores in 13 patients receiving ablation for HCC; E and F: Gene Ontology analysis (E) and Kyoto Encyclopedia of Genes and Genomes pathway analysis (F) of genes in the light pink module. PPIA: Peptidylprolyl isomerase A; SLC29A3: Solute carrier family 29 member 3.
Figure 2 Identification of prognostic immune-related genes for hepatocellular carcinoma ablation therapy using machine learning.
A: The forest plot shows 48 significant independent risk genes (IRGs) based on single-factor Cox regression analysis; B: Seven candidate genes were identified through least absolute shrinkage and selection operator analysis (LASSO) analysis with a lambda value of 0.04; C: Partial likelihood deviance of the LASSO coefficient distribution with a lambda value of 0.04; D: Violin plots showing the expression of 10 IRGs in patients at different risk levels; E: The risk levels and survival status of 365 hepatocellular carcinoma (HCC) patients are displayed; F: Kaplan-Meier curves were created to compare the differences in prognosis between the high-risk and low-risk groups based on the risk scores derived from LASSO analysis; G: Receiver operating characteristic (ROC) analysis at 1, 3, and 5-year time points based on the risk scores derived from LASSO analysis; H: Survival curve analysis for the 10 IRGs; I: ROC analysis of the 10 IRGs at 1, 3, and 5 years. SLC44A1: Solute carrier family 44 member 1; PARP12: Poly(ADP-ribose) polymerase family member 12; DNAJC1: DnaJ heat shock protein family (Hsp40) member C1; RAMP3: Receptor activity modifying protein 3; NDUFAF1: NADH: Ubiquinone oxidoreductase complex assembly Factor 1; SLC29A3: Solute carrier family 29 member 3; VSIG4: V-Set and immunoglobulin domain containing 4; PPIA: Peptidylprolyl isomerase A; CHPF2: Chondroitin polymerizing factor 2; ADGRE5: Adhesion G protein-coupled receptor E5.
Figure 3 Relationships between peptidylprolyl isomerase A and solute carrier family 29 member 3 expression and immune cell infiltration.
A: Enrichment plot of the GSEA Immunological Signature Database; B: Venn diagram showing the intersection of 1793 immune-related genes downloaded from the ImmPort website and 9 independent prognostic genes; C and D: Lollipop plots showing the correlation of peptidylprolyl isomerase A (PPIA) (C) and solute carrier family 29 member 3 (SLC29A3) (D) with immune infiltration; aP < 0.05, indicates a significant difference; E: Correlation between PPIA and 7 immune cells; F: Correlation between SLC29A3 and 8 immune cells. PPIA: Peptidylprolyl isomerase A; SLC29A3: Solute carrier family 29 member 3; Cor: Correlation coefficient.
Figure 4 Univariate and multivariate Cox proportional hazards regression analyses were used to identify prognosis-related genes.
A: Violin plots depicting the relationship between pathological grade and risk score; B: Violin plots depicting the relationship between tumor stage and risk score; C and D: Prognostic performance of risk scores based on both univariate (C) and multivariate (D) Cox regression analyses; E and F: Prognostic performance of peptidylprolyl isomerase A (PPIA) (E) and solute carrier family 29 member 3 (SLC29A3) (F) based on multivariate Cox regression analysis; G and H: Nomograms showing the relationship between various clinicopathological parameters and the expression of PPIA (G) and SLC29A3 (H); aP < 0.05, indicates a significant difference. The predicted 1-year, 3-year, and 5-year survival probabilities and the actual 1-year, 3-year, and 5-year survival probabilities are presented in the nomograms. PPIA: Peptidylprolyl isomerase A; SLC29A3: Solute carrier family 29 member 3.
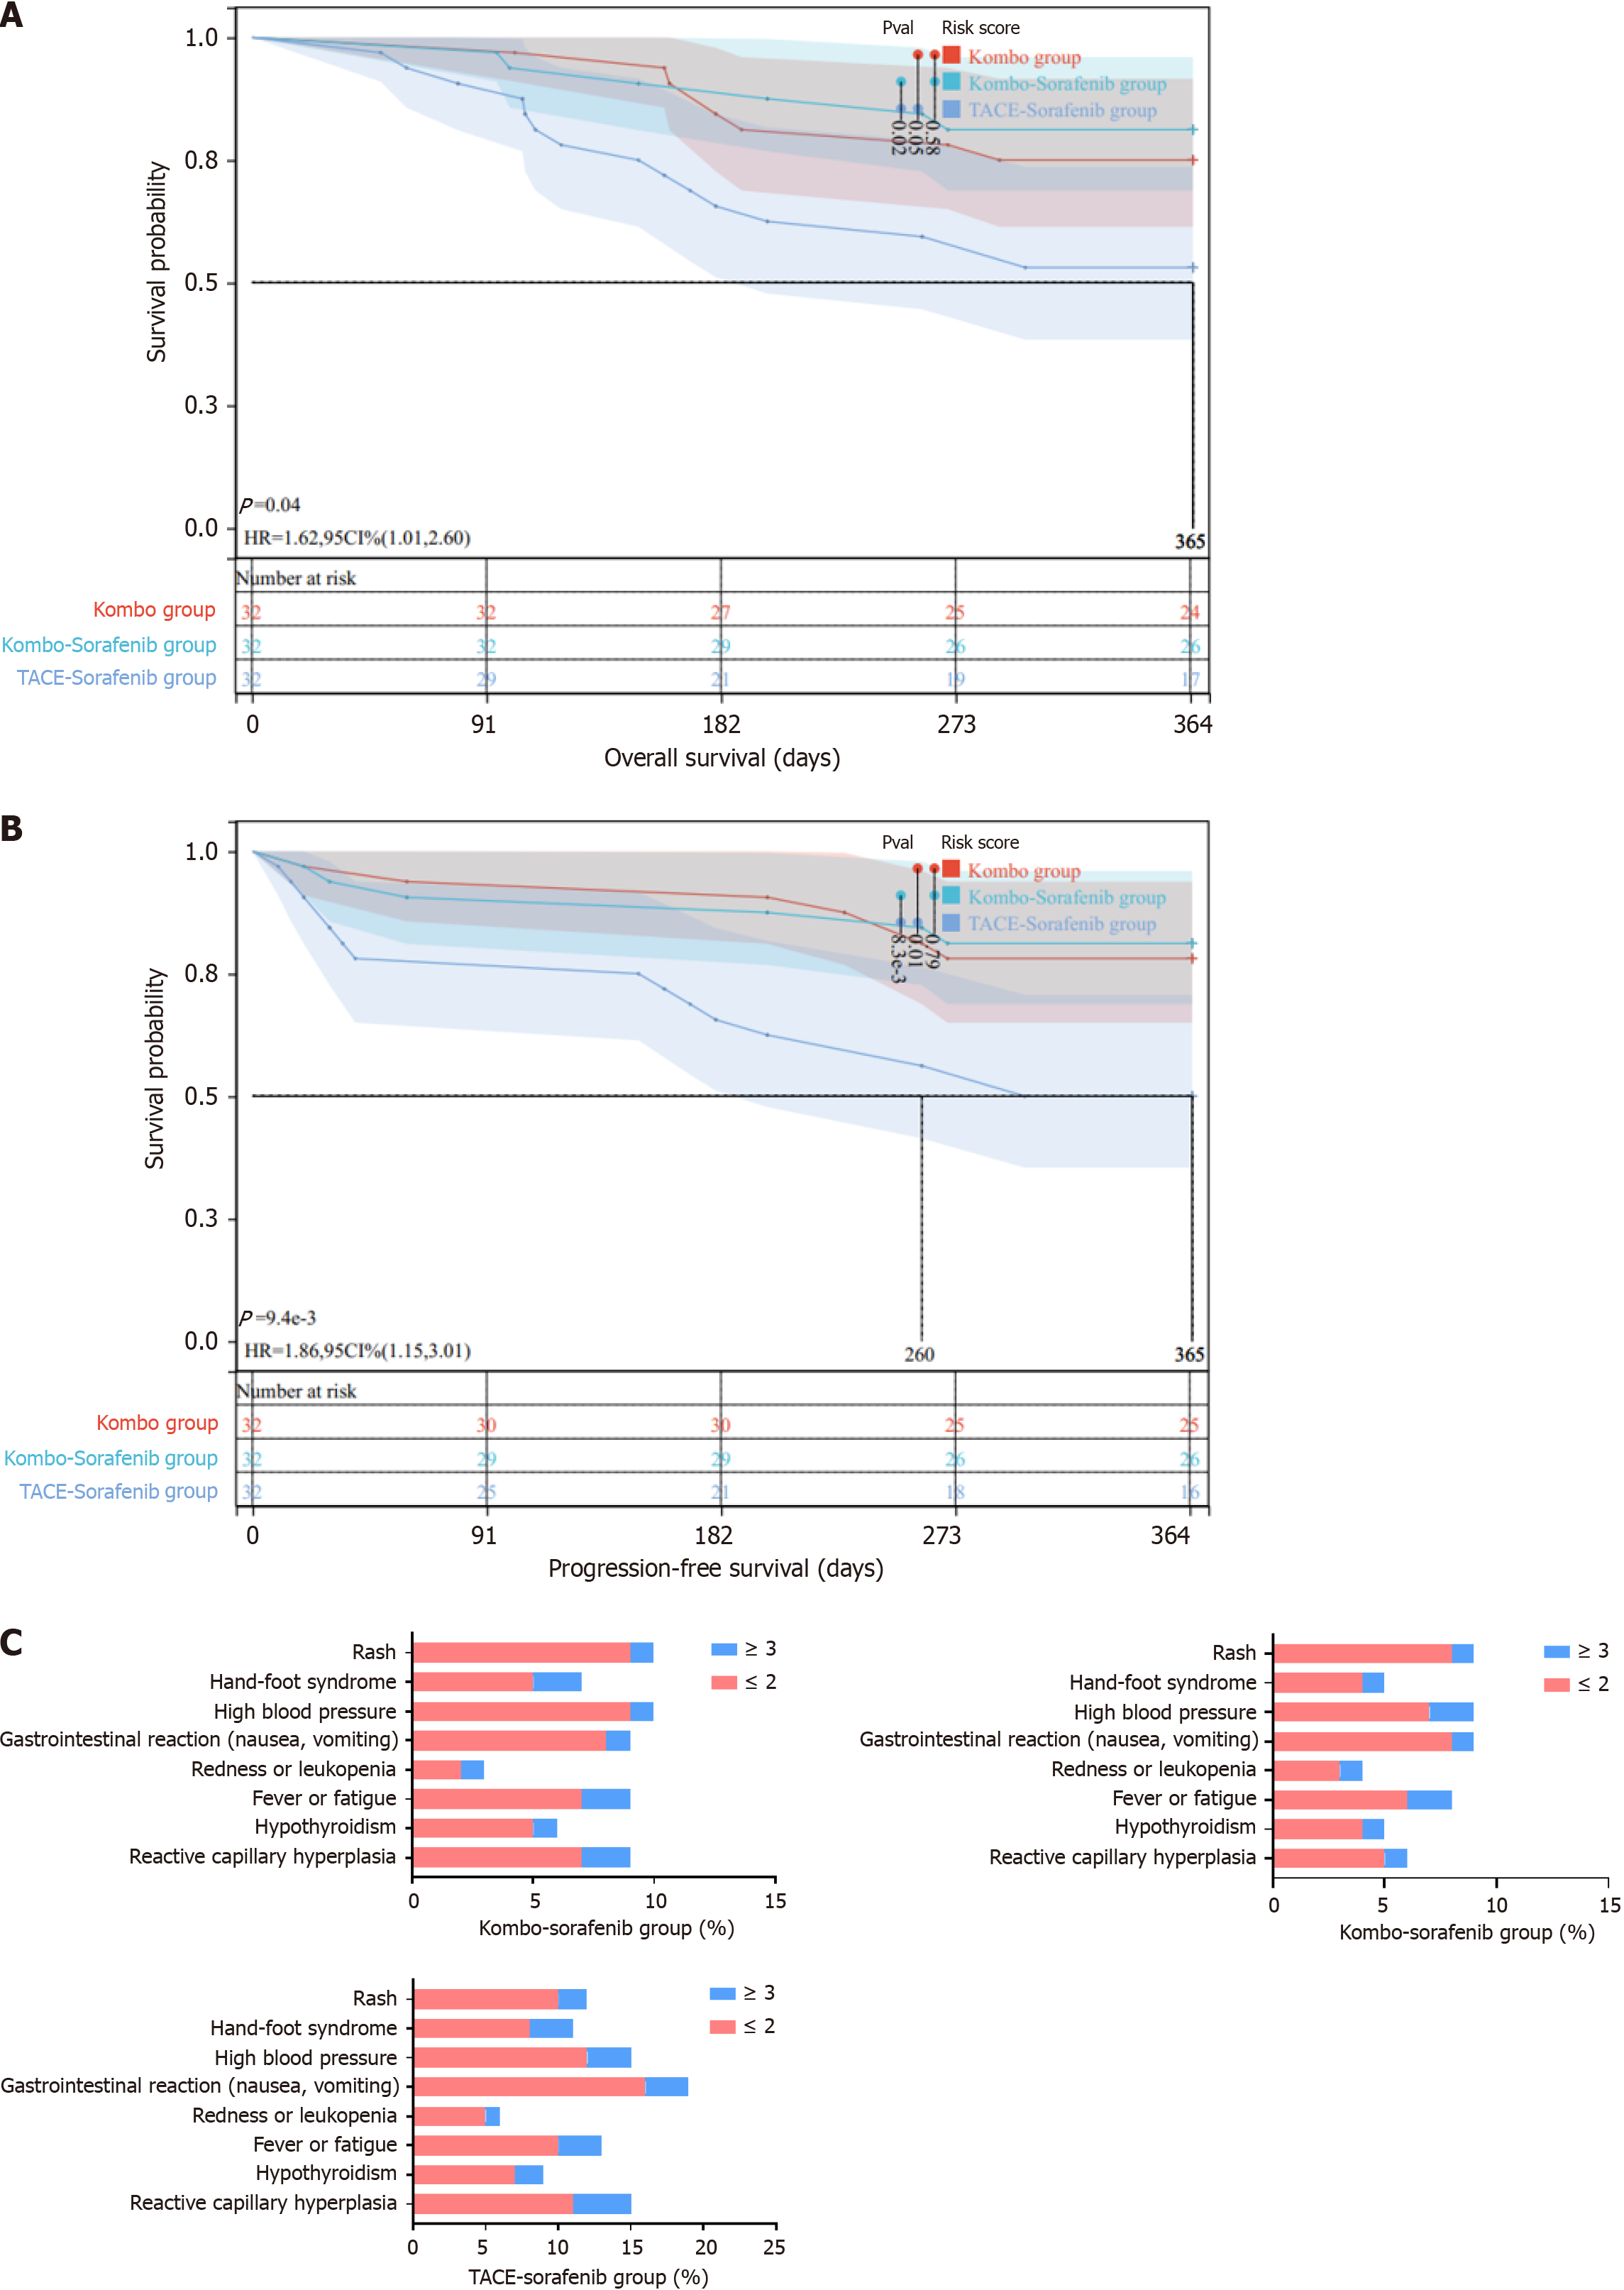
Figure 5 Evaluation of the efficacy and safety of Kombo knife and sorafenib combination therapy.
A: Overall survival in each group; B: Progression-free survival in each group; C: Adverse reactions in each group; ≤ 2 indicates adverse reactions of grade less than or equal to 2; > 3 indicates adverse reactions of grade greater than 3. HR: Hazard ratio; TACE: Transarterial chemoembolization.
Figure 6 Detection of immune function in the peripheral blood of hepatocellular carcinoma patients before and after treatment.
A: Flow cytometry was used to isolate CD3+ T cells from the peripheral blood mononuclear cells (PBMCs) of healthy donors, patients before and after treatment with Kombo knife, and patients before and after combined treatment with Kombo knife and sorafenib for hepatocellular carcinoma (HCC); B: Flow cytometry was used to isolate CD4+ T cells and CD8+ T cells from the peripheral blood of healthy donors, patients before and after treatment with Kombo knife, and patients before and after combined treatment with Kombo knife and sorafenib for HCC treatment; C: Flow cytometry was used to isolate natural killer cells from the PBMCs of healthy donors, patients before and after treatment with Kombo knife, and patients before and after combined treatment with Kombo knife and sorafenib for HCC treatment; D: Flow cytometry was used to isolate Treg cells from the PBMCs of healthy donors, patients before and after treatment with Kombo knife, and patients before and after combined treatment with Kombo knife and sorafenib for HCC treatment; E: The numbers of CD3+ T cells, CD4+ T cells, and CD8+ T cells were counted before and after treatment in each treatment group, and the ratios of CD4+ T cells to CD8+ T cells were compared; F: Enzyme-linked immunosorbent assay (ELISA) was used to measure the levels of Th1 and Th2 cytokines in peripheral blood; G: ELISA was used to measure the level of heat shock protein 70 in peripheral blood; H and I: The expression of peptidylprolyl isomerase A was detected using real-time quantitative reverse transcription polymerase chain reaction (RT-qPCR) (H) and Western blot (I) techniques; J and K: The expression of solute carrier family 29 member 3 was detected using RT-qPCR (J) and Western blot (K) techniques. All the groups included 32 patients, with mean ± SD values. aP < 0.05, indicates a significant difference between groups with P < 0.05. NK: Natural killer cell; IL: Interleukin.
Figure 7 The effects of peripheral blood mononuclear cells with increased immune function on hepatocellular carcinoma cells.
A: Optical microscopy images of JHH7 and HuH7 cells cocultured with peripheral blood mononuclear cells (PBMCs) from posttreatment patients for 24 h. Arrows indicate tumor cells; Bar = 100 μm; B: Transwell plate culture of tumor colony formation after 24 h of coculture of JHH7 and HuH7 cells with PBMCs from posttreatment patients; C: Quantification of tumor colony numbers; D: Transwell plate culture of JHH7 and HuH7 cells from posttreatment patients. Cells that penetrated the matrix basement membrane were stained with crystal violet; Bar = 20 μm; E: Quantification of cells in the Transwell experiment; F: Comparison of the hepatocellular carcinoma (HCC) cell death ratio; G: Collection of Annexin V/PI-stained cells and detection of the ratio of Annexin V/PI-positive cells by flow cytometry; H: Statistical analysis of the cell apoptosis ratio based on graph G-test; I and J: Detection of peptidylprolyl isomerase A expression in HCC cells by real-time quantitative reverse transcription polymerase chain reaction (RT-qPCR) (I) and Western blot (J) analysis; untreated HCC cells were used as controls; K and L: Detection of solute carrier family 29 member 3 expression in HCC cells by RT-qPCR (K) and Western blot (L); untreated HCC cells were used as controls. All cell experiments were repeated three times, and the values are expressed as the mean ± SD. aP value < 0.05, indicates a significant difference between the two groups with a P value < 0.05. PPIA: Peptidylprolyl isomerase A; SLC29A3: Solute carrier family 29 member 3.
Figure 8 The effects of posttreatment with peripheral blood mononuclear cells on tumor formation and immune function in hepatocellular carcinoma mice were studied.
A: The influence of patient peripheral blood mononuclear cells (PBMCs) on the tumor growth of hepatocellular carcinoma (HCC) mice before and after treatment; B: Changes in relative tumor volume in each group of mice; C: Hematoxylin and eosin staining showing the histopathological morphology of tumor tissue, Bar = 400 ×; D: Immunohistochemical detection of the quantity of Ki-67 and analysis of the ratio of Ki-67-positive cells in the transplanted tumor, with arrows indicating tumor cell nuclei, Bar = 400 ×; E: TUNEL staining analysis of cell apoptosis and analysis of the ratio of transplanted tumor cell apoptosis, with arrows indicating tumor cell nuclei, Bar = 400 ×; F: Immunohistochemical detection of CD34 expression to assess tumor microvessel density, Bar = 400 ×; G: Immunohistochemical detection of immune checkpoints programmed cell death 1, programmed cell death ligand 1, and cytotoxic T lymphocyte-associated antigen-4, Bar = 400 ×; H and I: Real-time quantitative reverse transcription polymerase chain reaction (H) and Western blot (I) detection of the expression of peptidylprolyl isomerase A and solute carrier family 29 member 3 in tumor tissue. All groups included 6 mice per group, and the values are presented as the means ± SD. aP < 0.05 indicates a significant difference between the two groups (P < 0.05). PD-1: Programmed cell death 1; PD-L1: Programmed cell death ligand 1; CTLA-4: Cytotoxic T lymphocyte-associated antigen-4; PPIA: Peptidylprolyl isomerase A; SLC29A3: Solute carrier family 29 member 3.
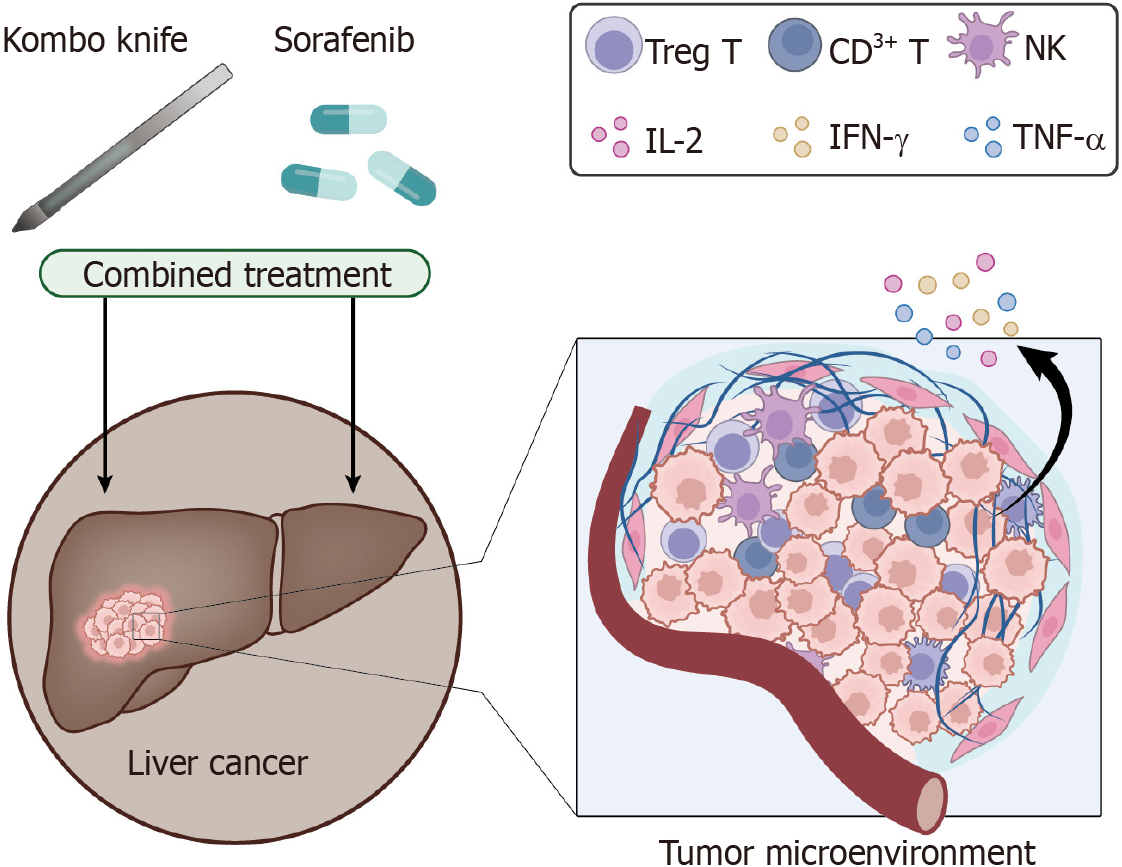
Figure 9 Schematic diagram of the molecular mechanism by which the novel hybrid cold-hot ablation technique (Kombo knife) combined with sorafenib treats hepatocellular carcinoma by affecting the body's immune function.
NK: Natural killer; IL: Interleukin; IFN: Interferon; TNF: Tumor necrosis factor.
- Citation: Cao Y, Li PP, Qiao BL, Li QW. Kombo knife combined with sorafenib in liver cancer treatment: Efficacy and safety under immune function influence. World J Gastrointest Oncol 2024; 16(7): 3118-3157
- URL: https://www.wjgnet.com/1948-5204/full/v16/i7/3118.htm
- DOI: https://dx.doi.org/10.4251/wjgo.v16.i7.3118


