Copyright
©The Author(s) 2024.
World J Gastrointest Oncol. Jul 15, 2024; 16(7): 3082-3096
Published online Jul 15, 2024. doi: 10.4251/wjgo.v16.i7.3082
Published online Jul 15, 2024. doi: 10.4251/wjgo.v16.i7.3082
Figure 1 Differential expression of BCAR3 in cancer tissues and normal counterparts from The Cancer Genome Altas and Genotype Tissue Expression databases, analyzed by Mann-Whitney U test.
aP < 0.05. ACC: Adrenalcortical carcinoma; BLCA: Bladder urothelial carcinoma; BRCA: Breast invasive carcinoma; CESC: Cervical squamous cell carcinoma and endocervical adenocarcinoma; CHOL: Cholangiocarcinoma; COAD: Colon adenocarcinoma; DLBC: Diffuse large B cell lymphoma; ESCA: Esophageal carcinoma; GBM: Glioblastoma multiforme; HNSC: Head and Neck squamous cell carcinoma; KICH: Kidney chromophobe; KIRC: Kidney renal clear cell carcinoma; KIRP: Kidney renal papillary cell carcinoma; LAML: Acute myeloid leukemia; LGG: Brain lower grade glioma; LIHC: Liver hepatocellular carcinoma; LUAD: Lung adenocarcinoma; LUSC: Lung squamous cell carcinoma; MESO: Mesothelioma; OV: Ovarian serous cystadenocarcinoma; PAAD: Pancreatic adenocarcinoma; PCPG: Pheochromocytoma and paraganglioma; PRAD: Prostate adenocarcinoma; READ: Rectum adenocarcinoma; SARC: Sarcoma; SKCM: Skin cutaneous melanoma; STAD: Stomach adenocarcinoma; TGCT: Testicular germ cell tumor; THCA: Thyroid carcinoma; THYM: Thymoma; UCEC: Uterine corpus endometrial carcinoma; UCS: Uterine carcinosarcoma; UVM: Uveal melanoma.
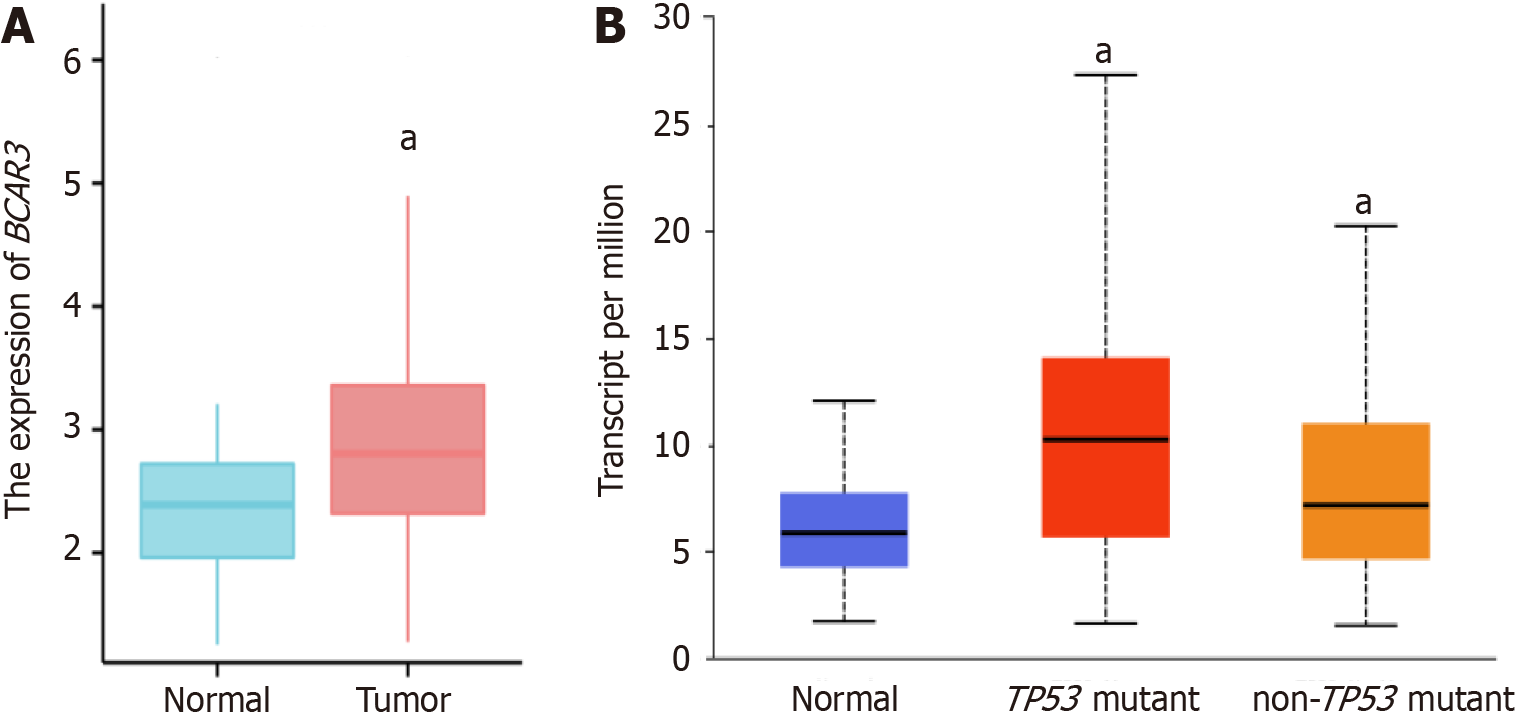
Figure 2 Differential expression of BCAR3.
A: The difference of BCAR3 expression in normal tissue and liver cancer tissue; B: Expression difference of BCAR3 in normal, TP53 mutant and non-TP53 mutant hepatocellular carcinoma tissues. aP < 0.05.
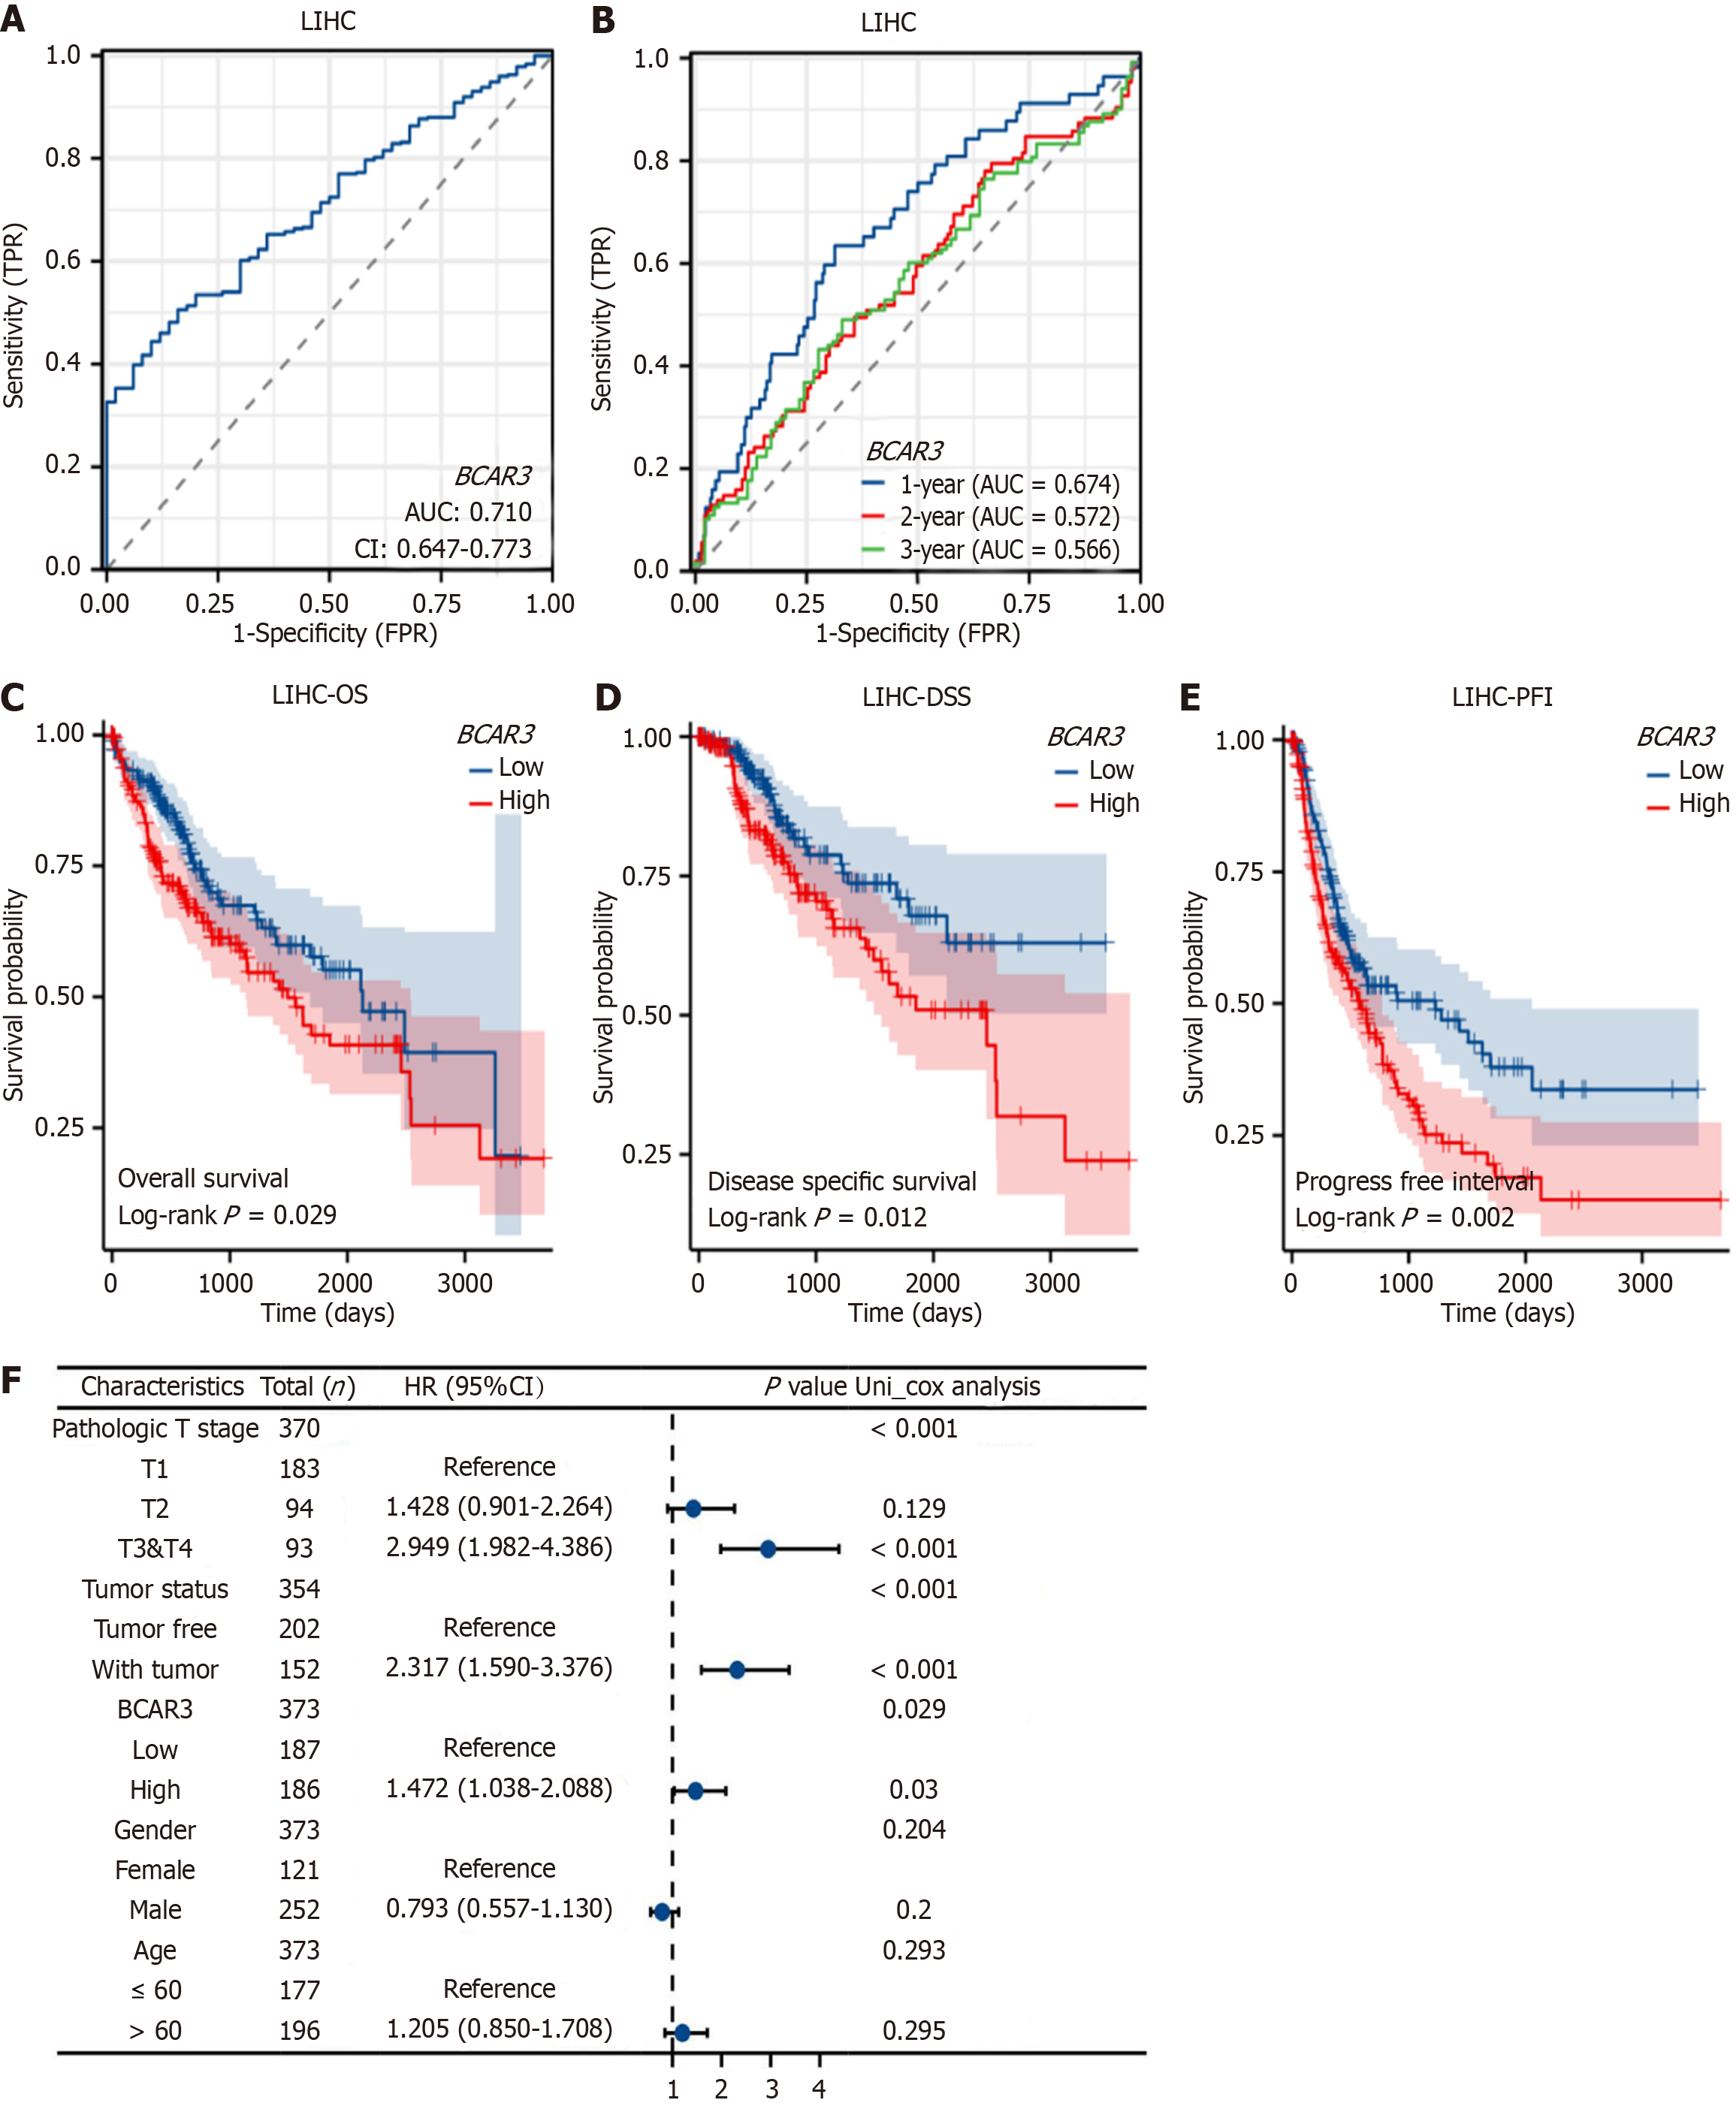
Figure 3 Effect of BCAR3 on diagnosis and prognosis of hepatocellular carcinoma.
A: Receiver operating characteristic (ROC) curve and area under curve (AUC) value of BCAR3 gene expression in diagnosing hepatocellular carcinoma (HCC). The blue curve represents the ROC curve and AUC = 0.71; B: ROC curve and AUC value of BCAR3 gene expression in predicting the 1, 2 and 3 year survival time of HCC patients. Larger AUC values corresponding to better prediction performance; C-E: Effects of BCAR3 expression on overall survival (OS), disease specific survival and progression free interval of HCC. Comparison between high expression group and low expression group was performed by Log rank; F: Forest plot for univariate cox regression analysis of BCAR3 expression with OS in HCC with different clinicopathologic features. High expression of BCAR3 is a risk factor for HCC. AUC: Area under curve.
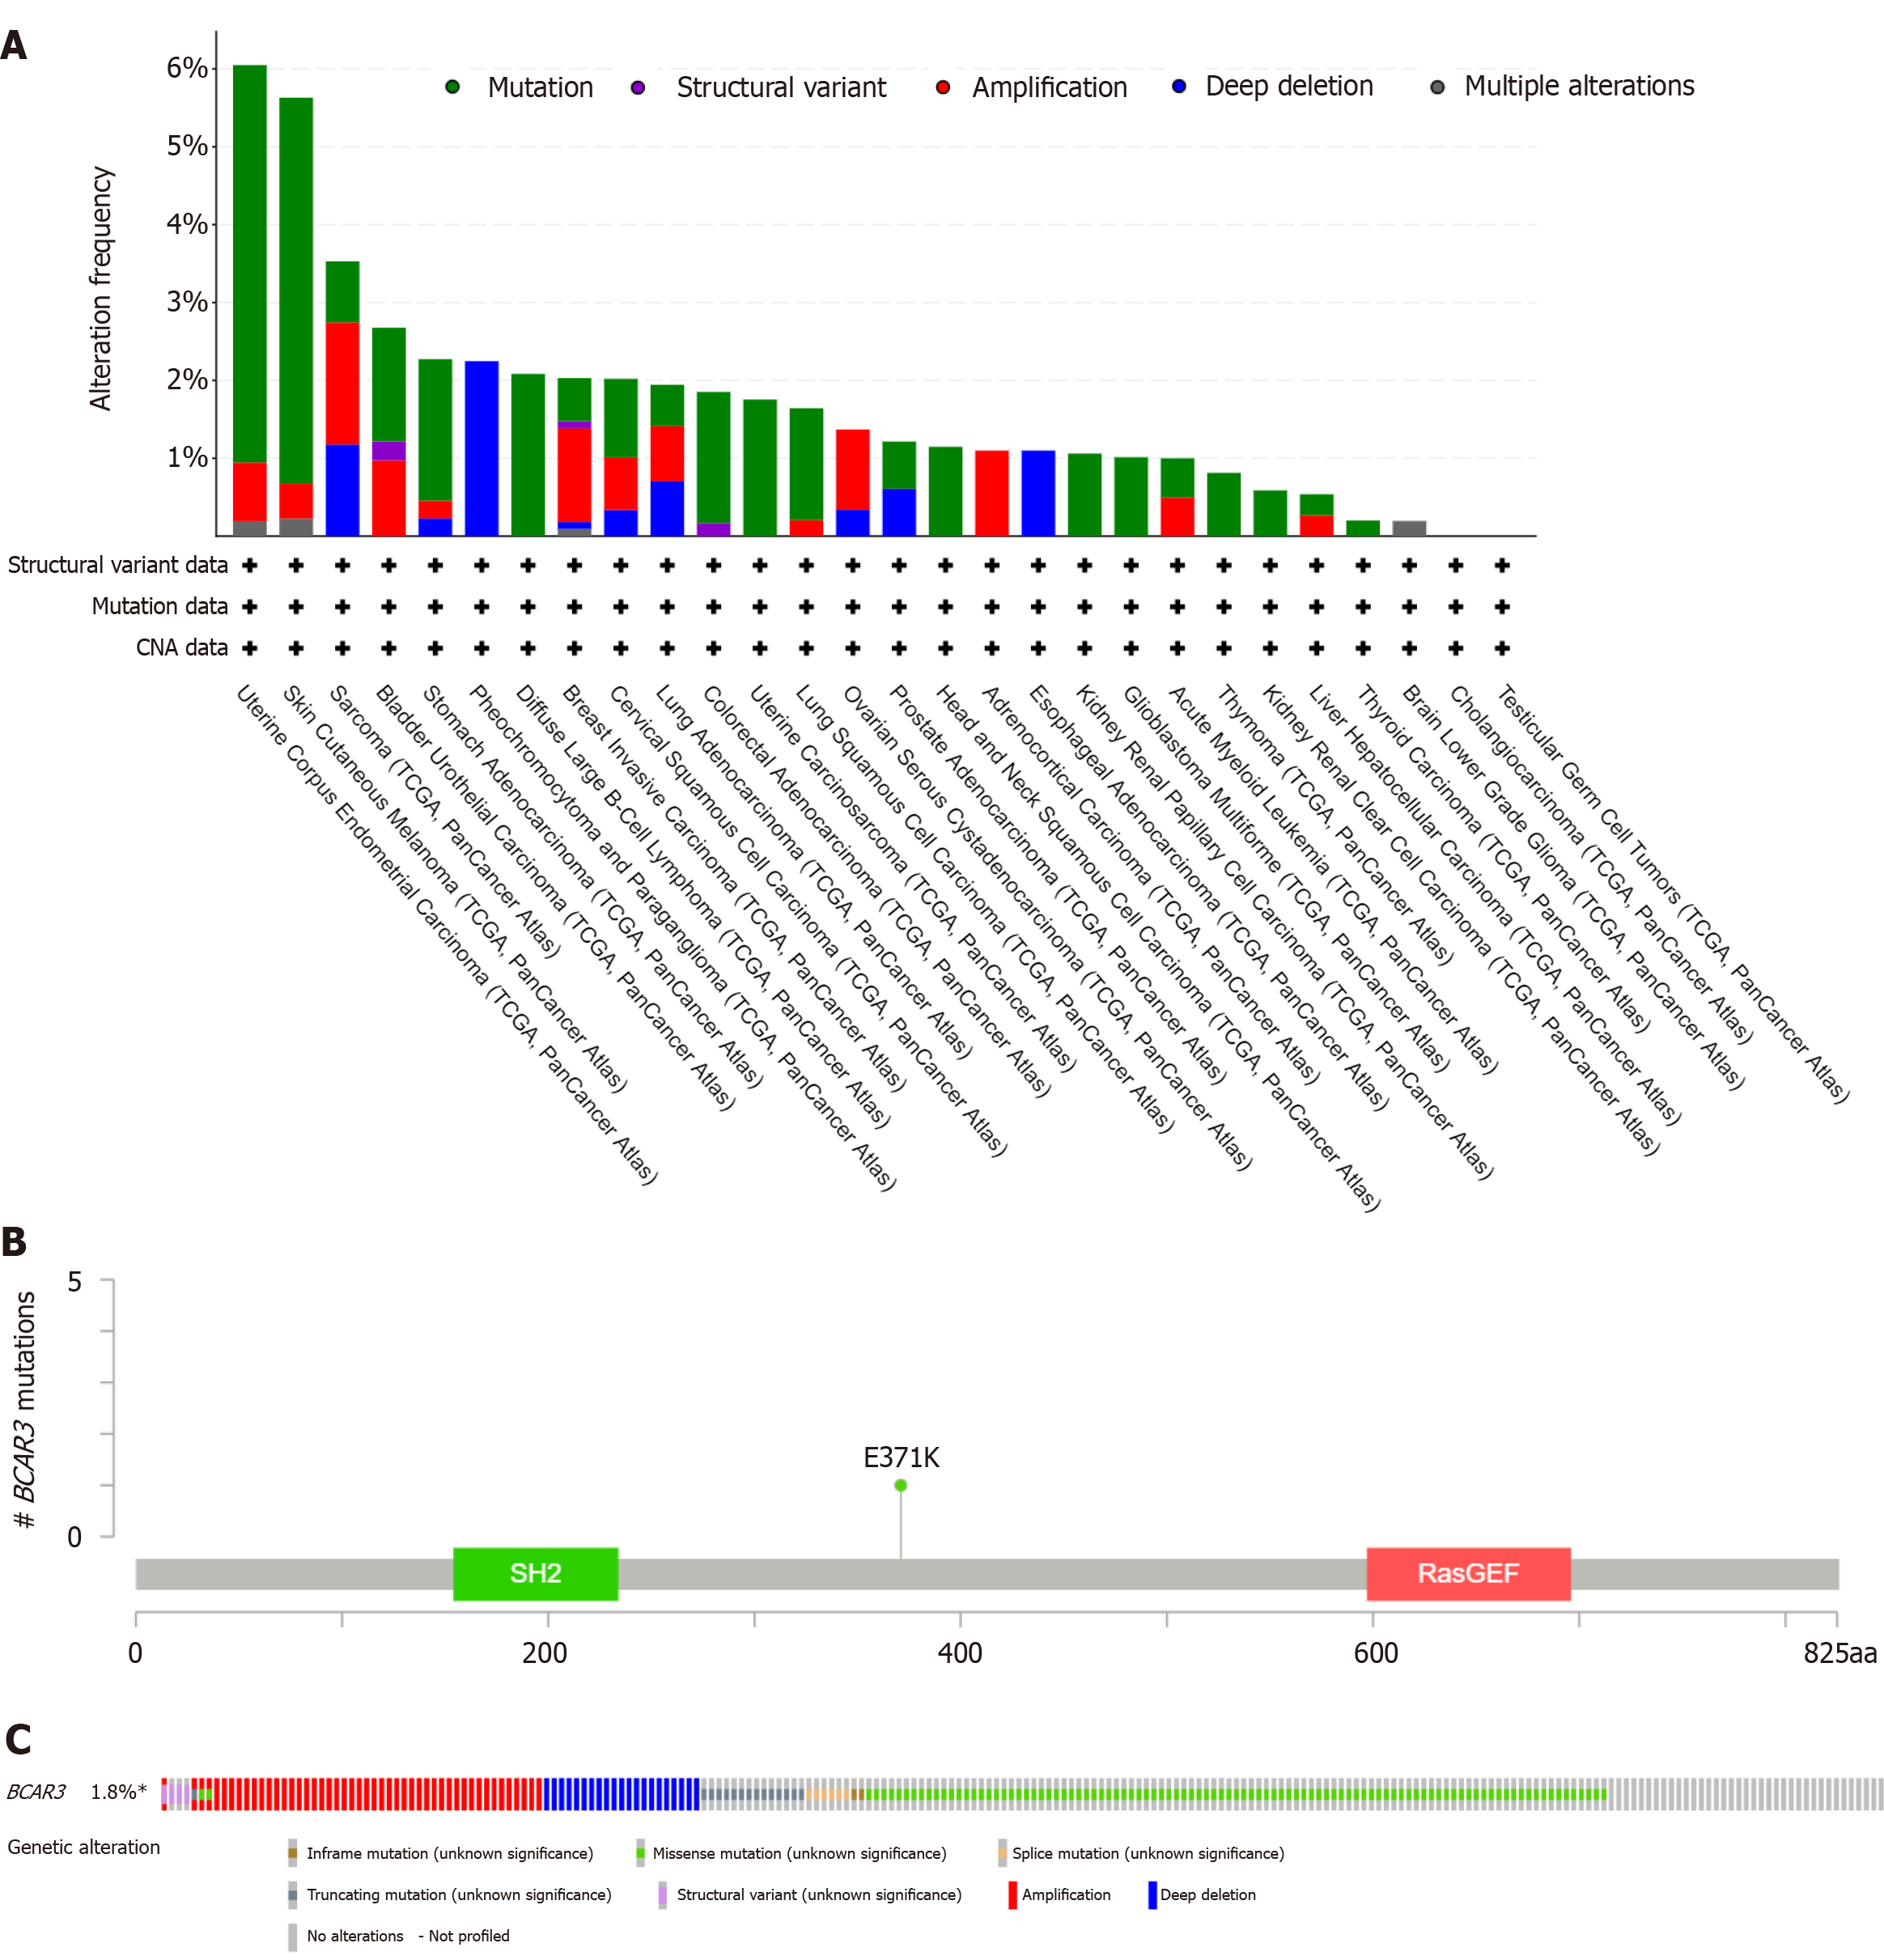
Figure 4 Genetic and epigenetic alterations of BCAR3 in hepatocellular carcinoma patients from The Cancer Genome Altas dataset.
A: Genetic features of BCAR3, including, including mutation, structural variant, amplification, deep deletion and multiple alteration, in different tumors of The Cancer Genome Altas analyzed by cBioPortal; B: Mutation site of BCAR3 in hepatocellular carcinoma (HCC); C: The mutation rate of BCAR3 in HCC.
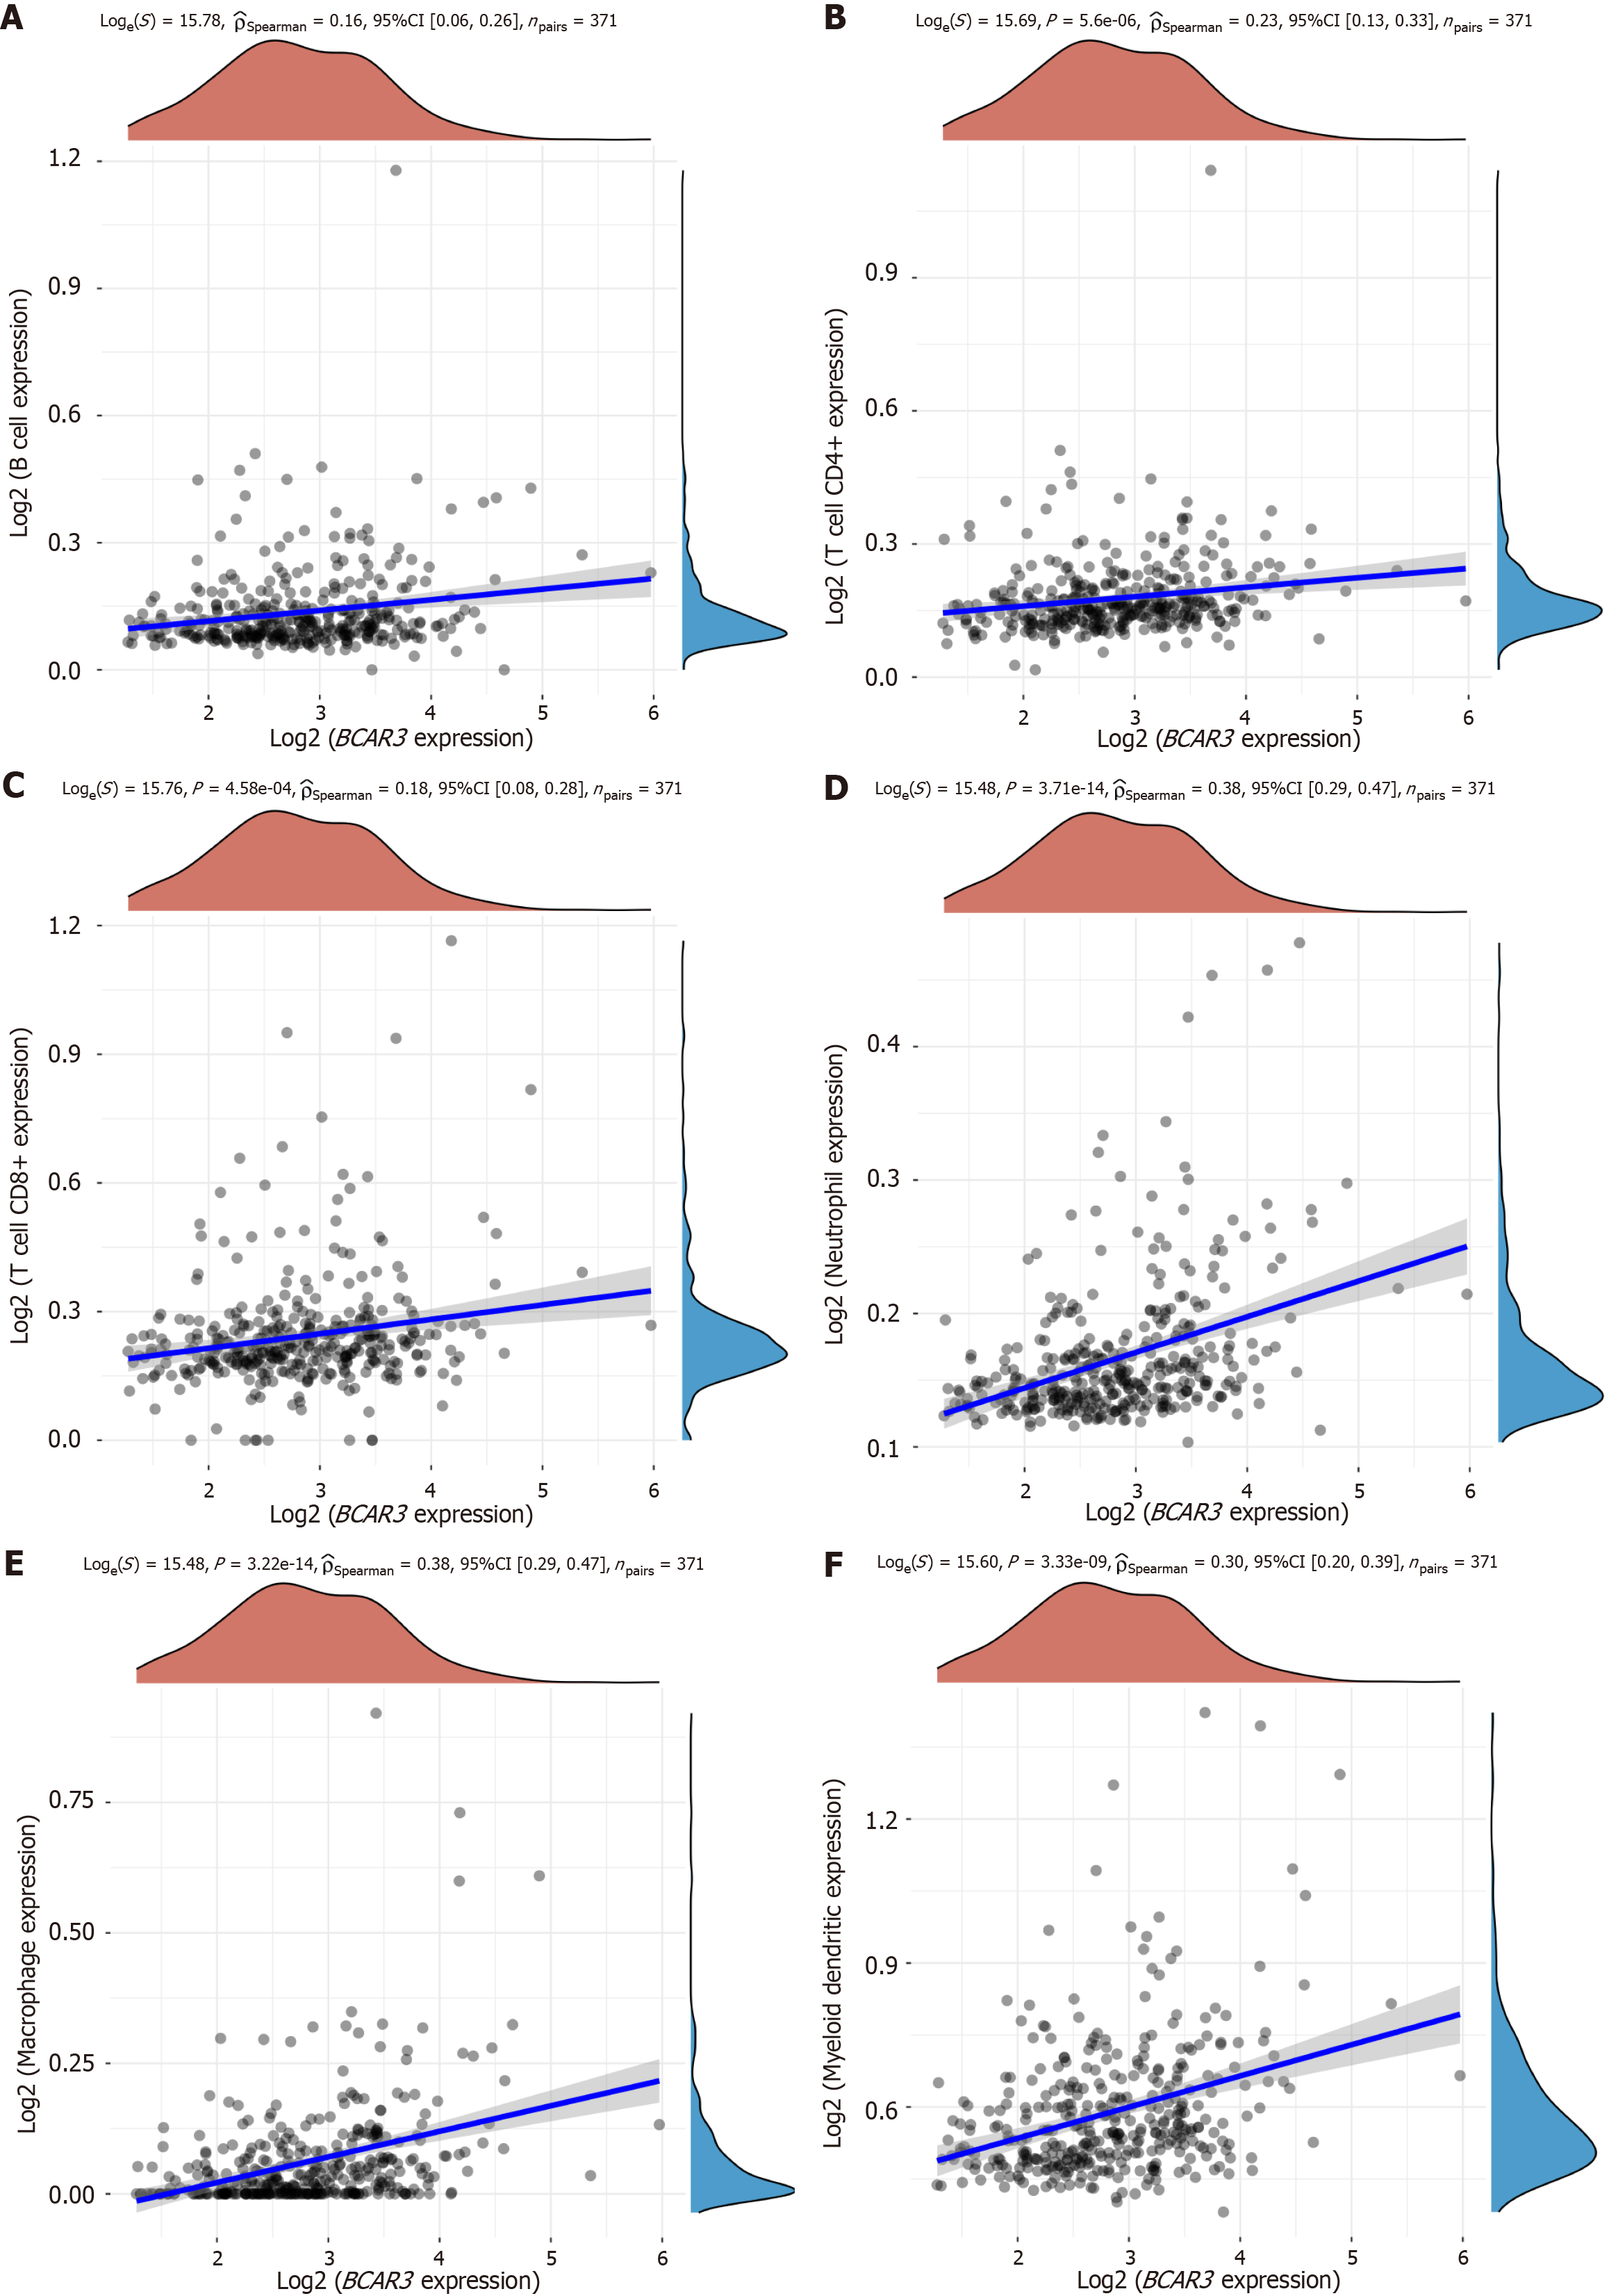
Figure 5 Relationship between the expression of BCAR3 and immune invasion of hepatocellular carcinoma.
A: B cells; B: T cells CD4+; C: T cells CD8+; D: Neutrophil; E: Macrophage; F: Myeloid dendritic cells were positively correlated with BCAR3.
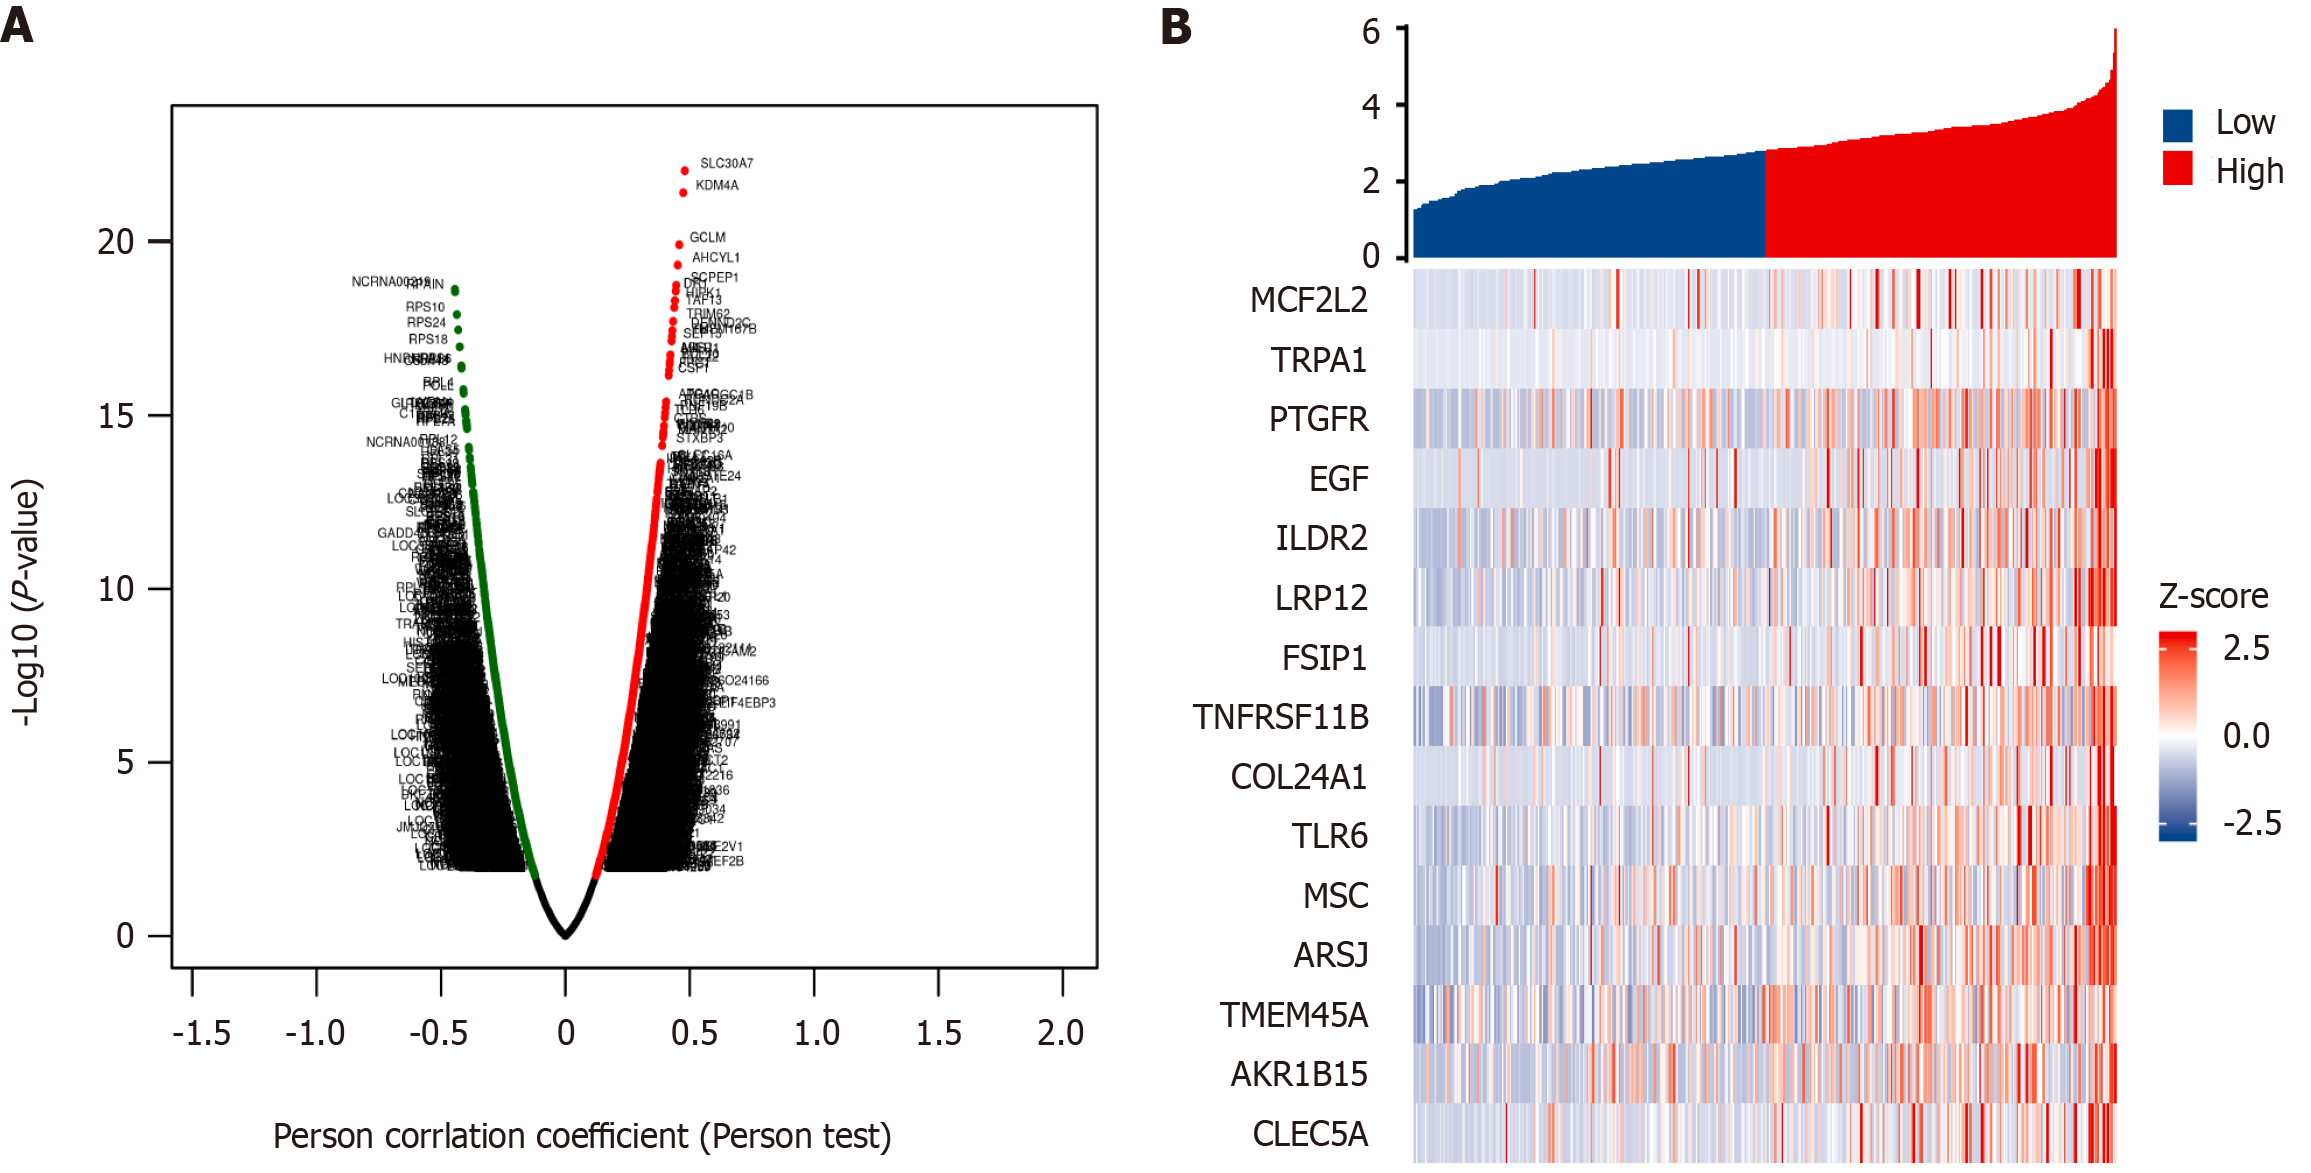
Figure 6 The co-expressed genes associated with BCAR3 expression in hepatocellular carcinoma.
A: Volcanic map of BCAR3-related co-expression genes obtained by the LinkedOmics. heat maps; B: Heat map of the top 15 differently expressed genes between high and low BCAR3 expression groups.
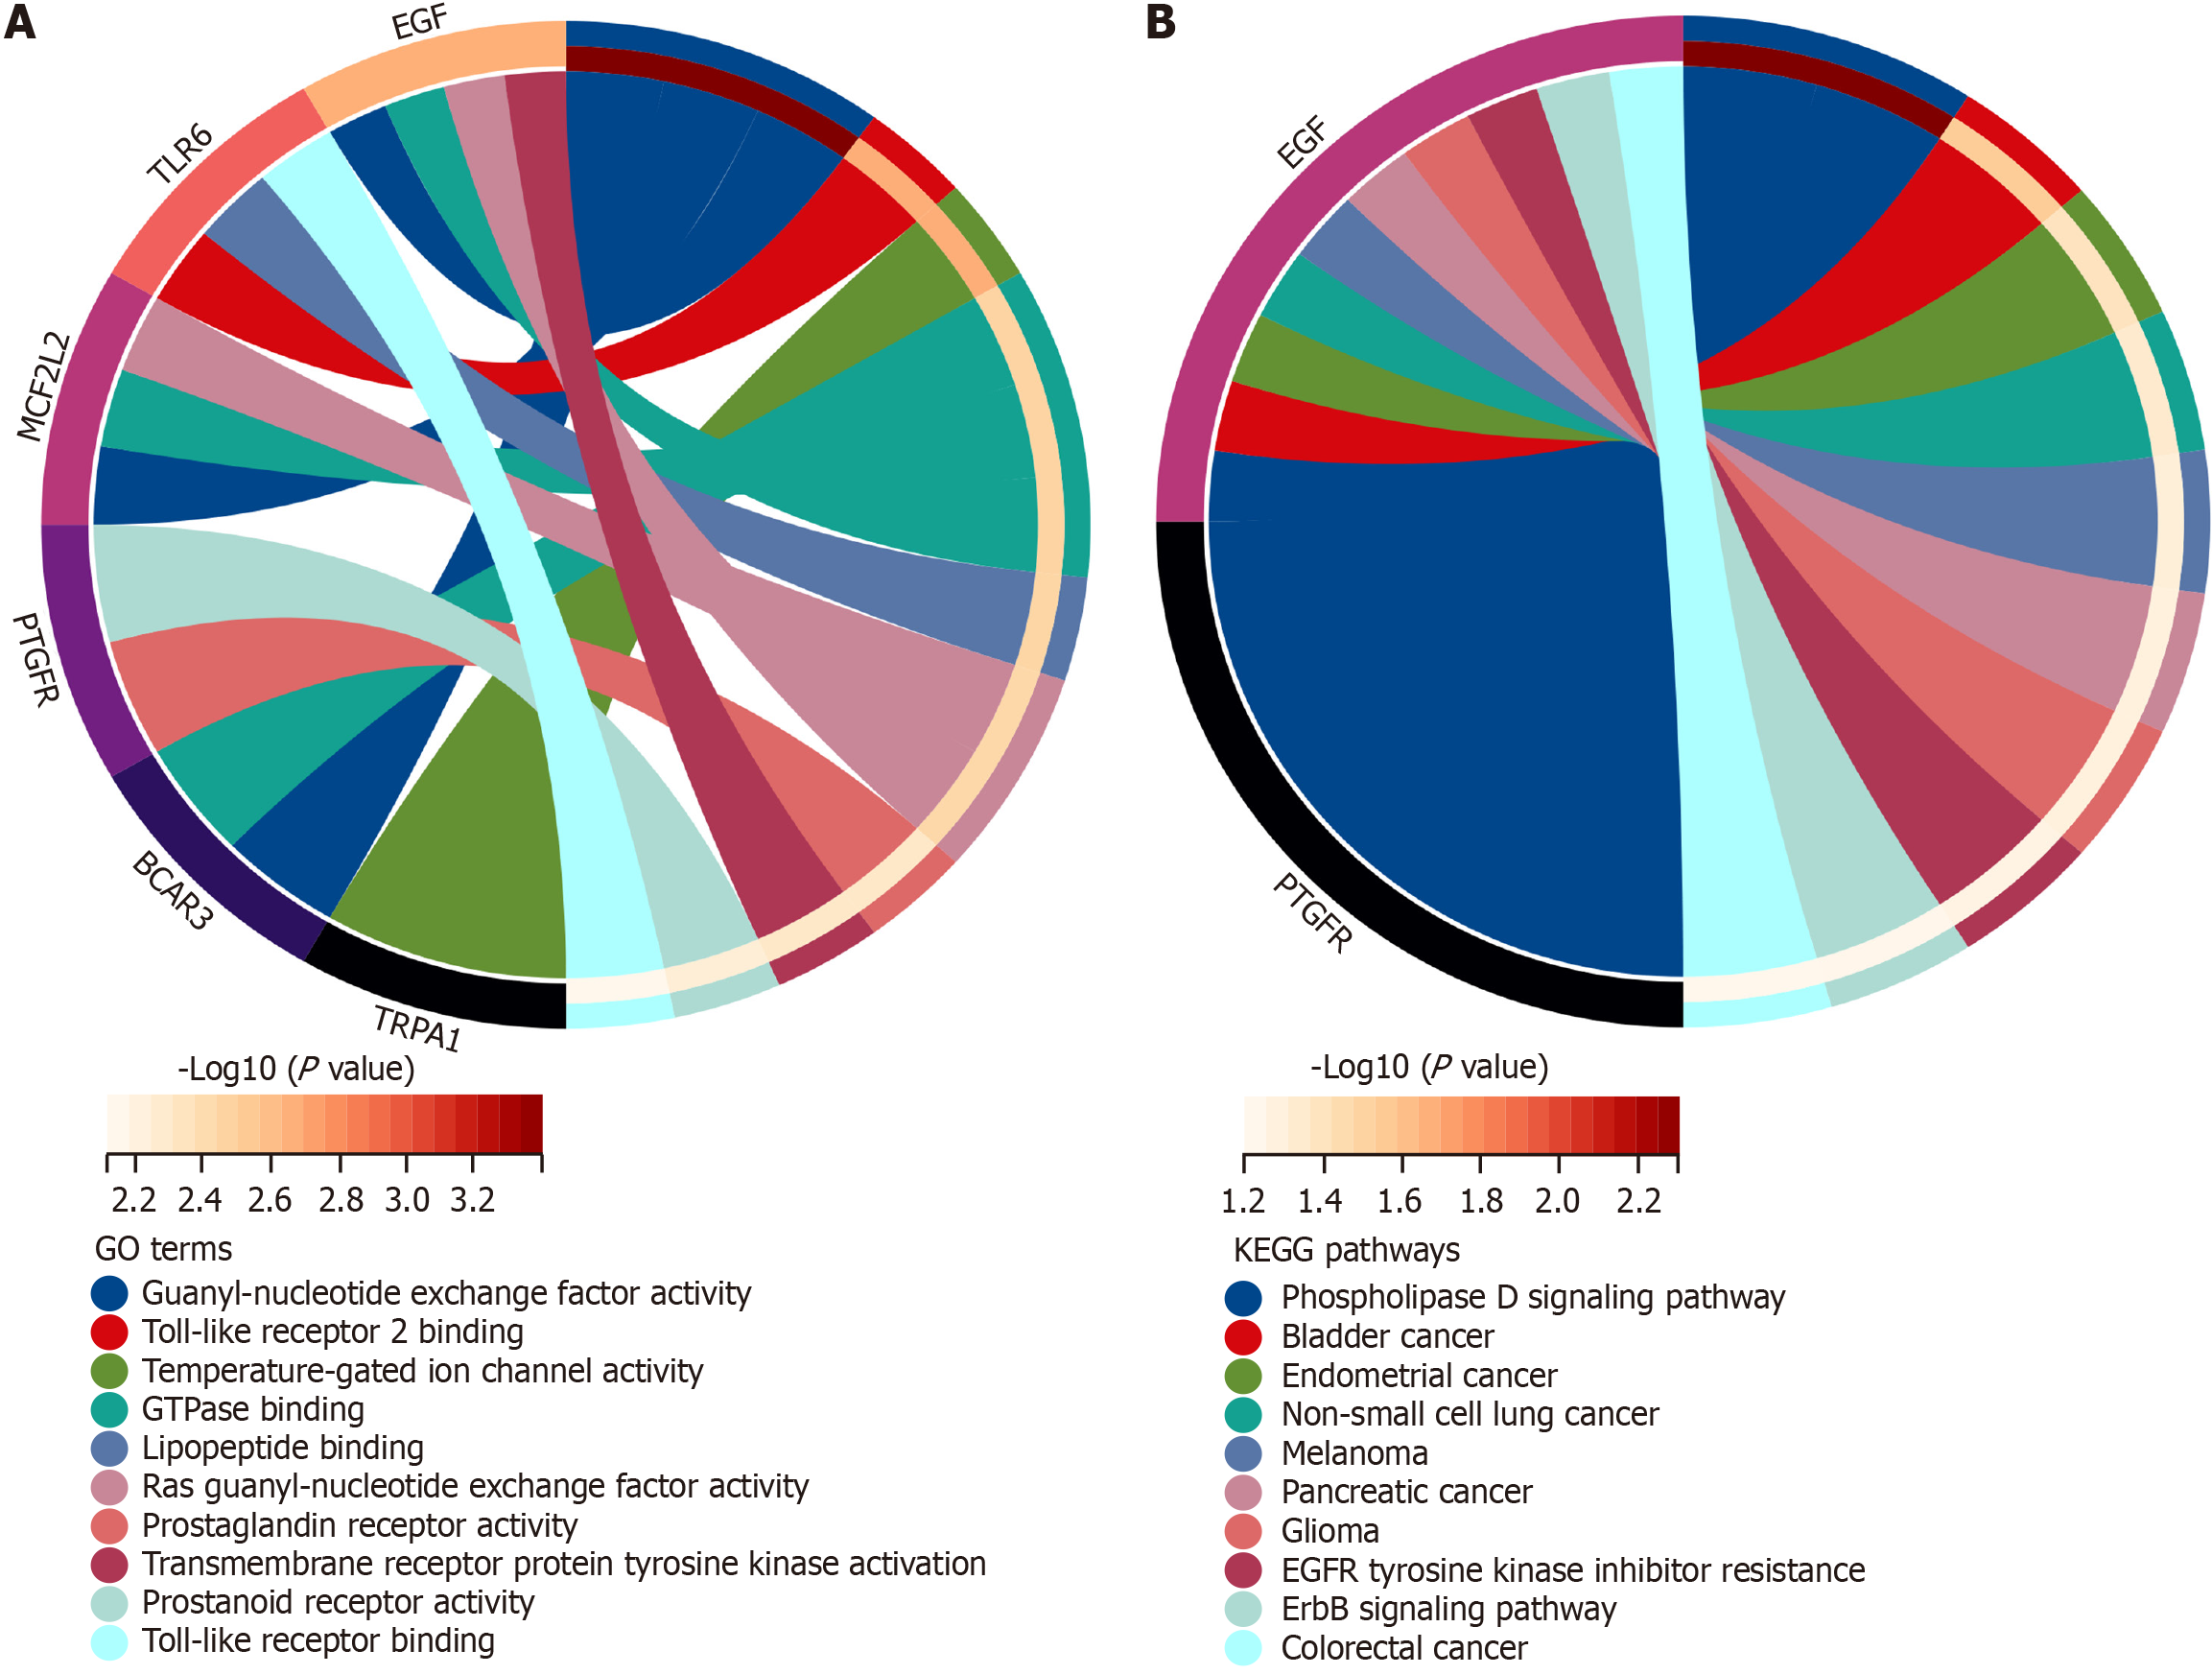
Figure 7 Functional enrichment analysis of BCAR3 gene in hepatocellular carcinoma.
A: Gene ontology enrichment analysis of BCAR3 by Metascape, including positive regulation of guanyl-nucleotide exchange factor activity and GTPase regulator activity; B: Kyoto encyclopedia of genes and genomes pathway analysis of BCAR3 expression by Metascape, including positive regulation of ERBB signaling pathway and positive regulation of epidermal growth factor receptor signaling pathway.
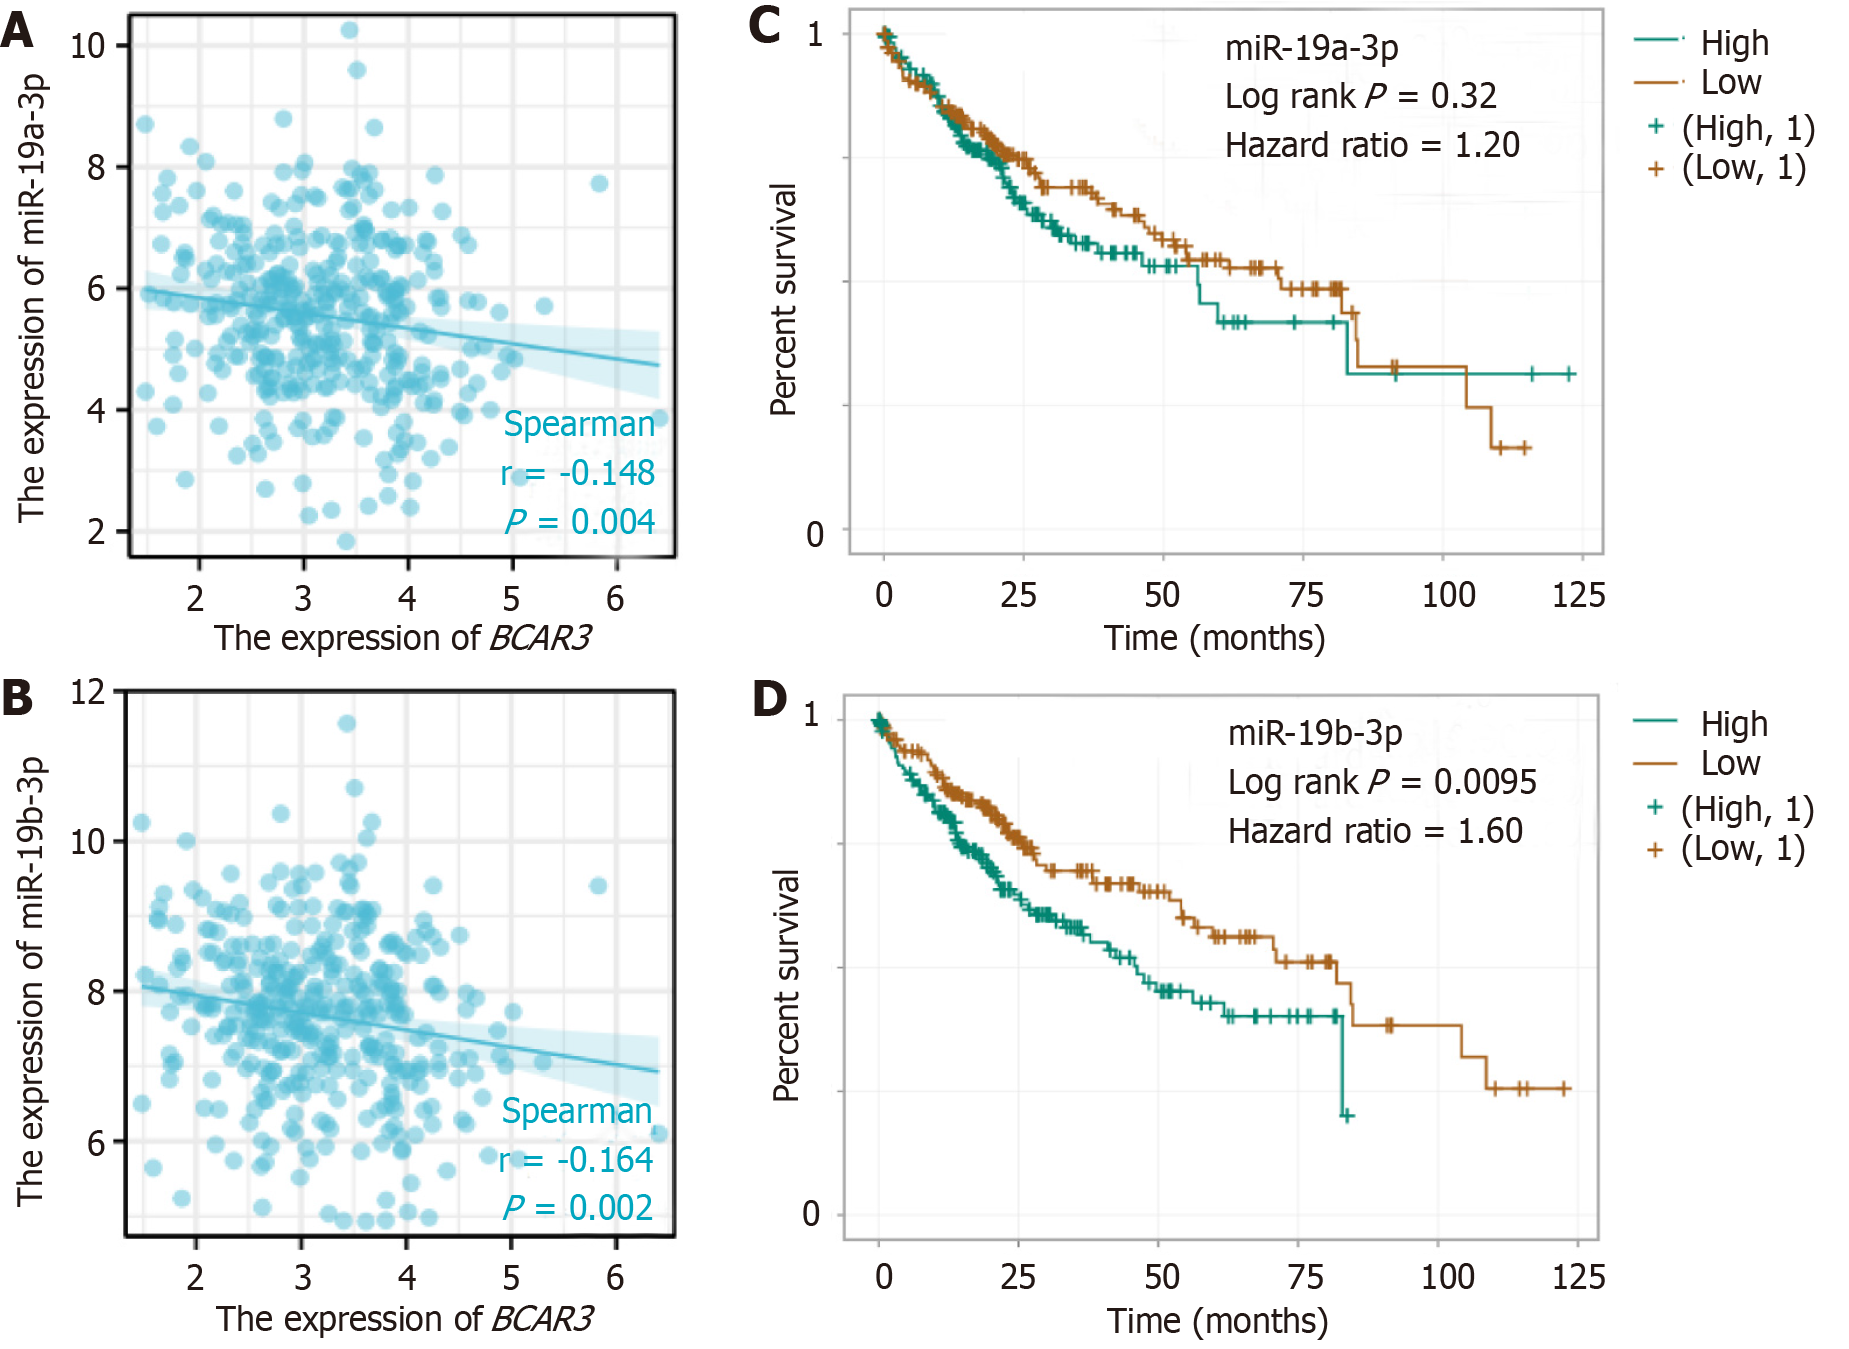
Figure 8 Correlation, and survival curve analyses between BCAR3 and 2 miRNAs.
A: Negative regulatory relationship between BCAR3 and miR-19a-3p, analyzed by Spearman correlate analysis; B: Negative regulatory relationship between BCAR3 and miR-19b-3p, analyzed by Spearman correlate analysis; C and D: Kaplan-Meier survival analysis of miR-19a-3p and miR-19b-3p expression in hepatocellular carcinoma (HCC) patients. Comparison between high expression group and low expression group was performed by Log rank. Hazard ratio (HR) represents the risk factor of the high expression group relative to the low expression group sample. HR > 1 indicates that the miRNA is a risk factor for HCC.
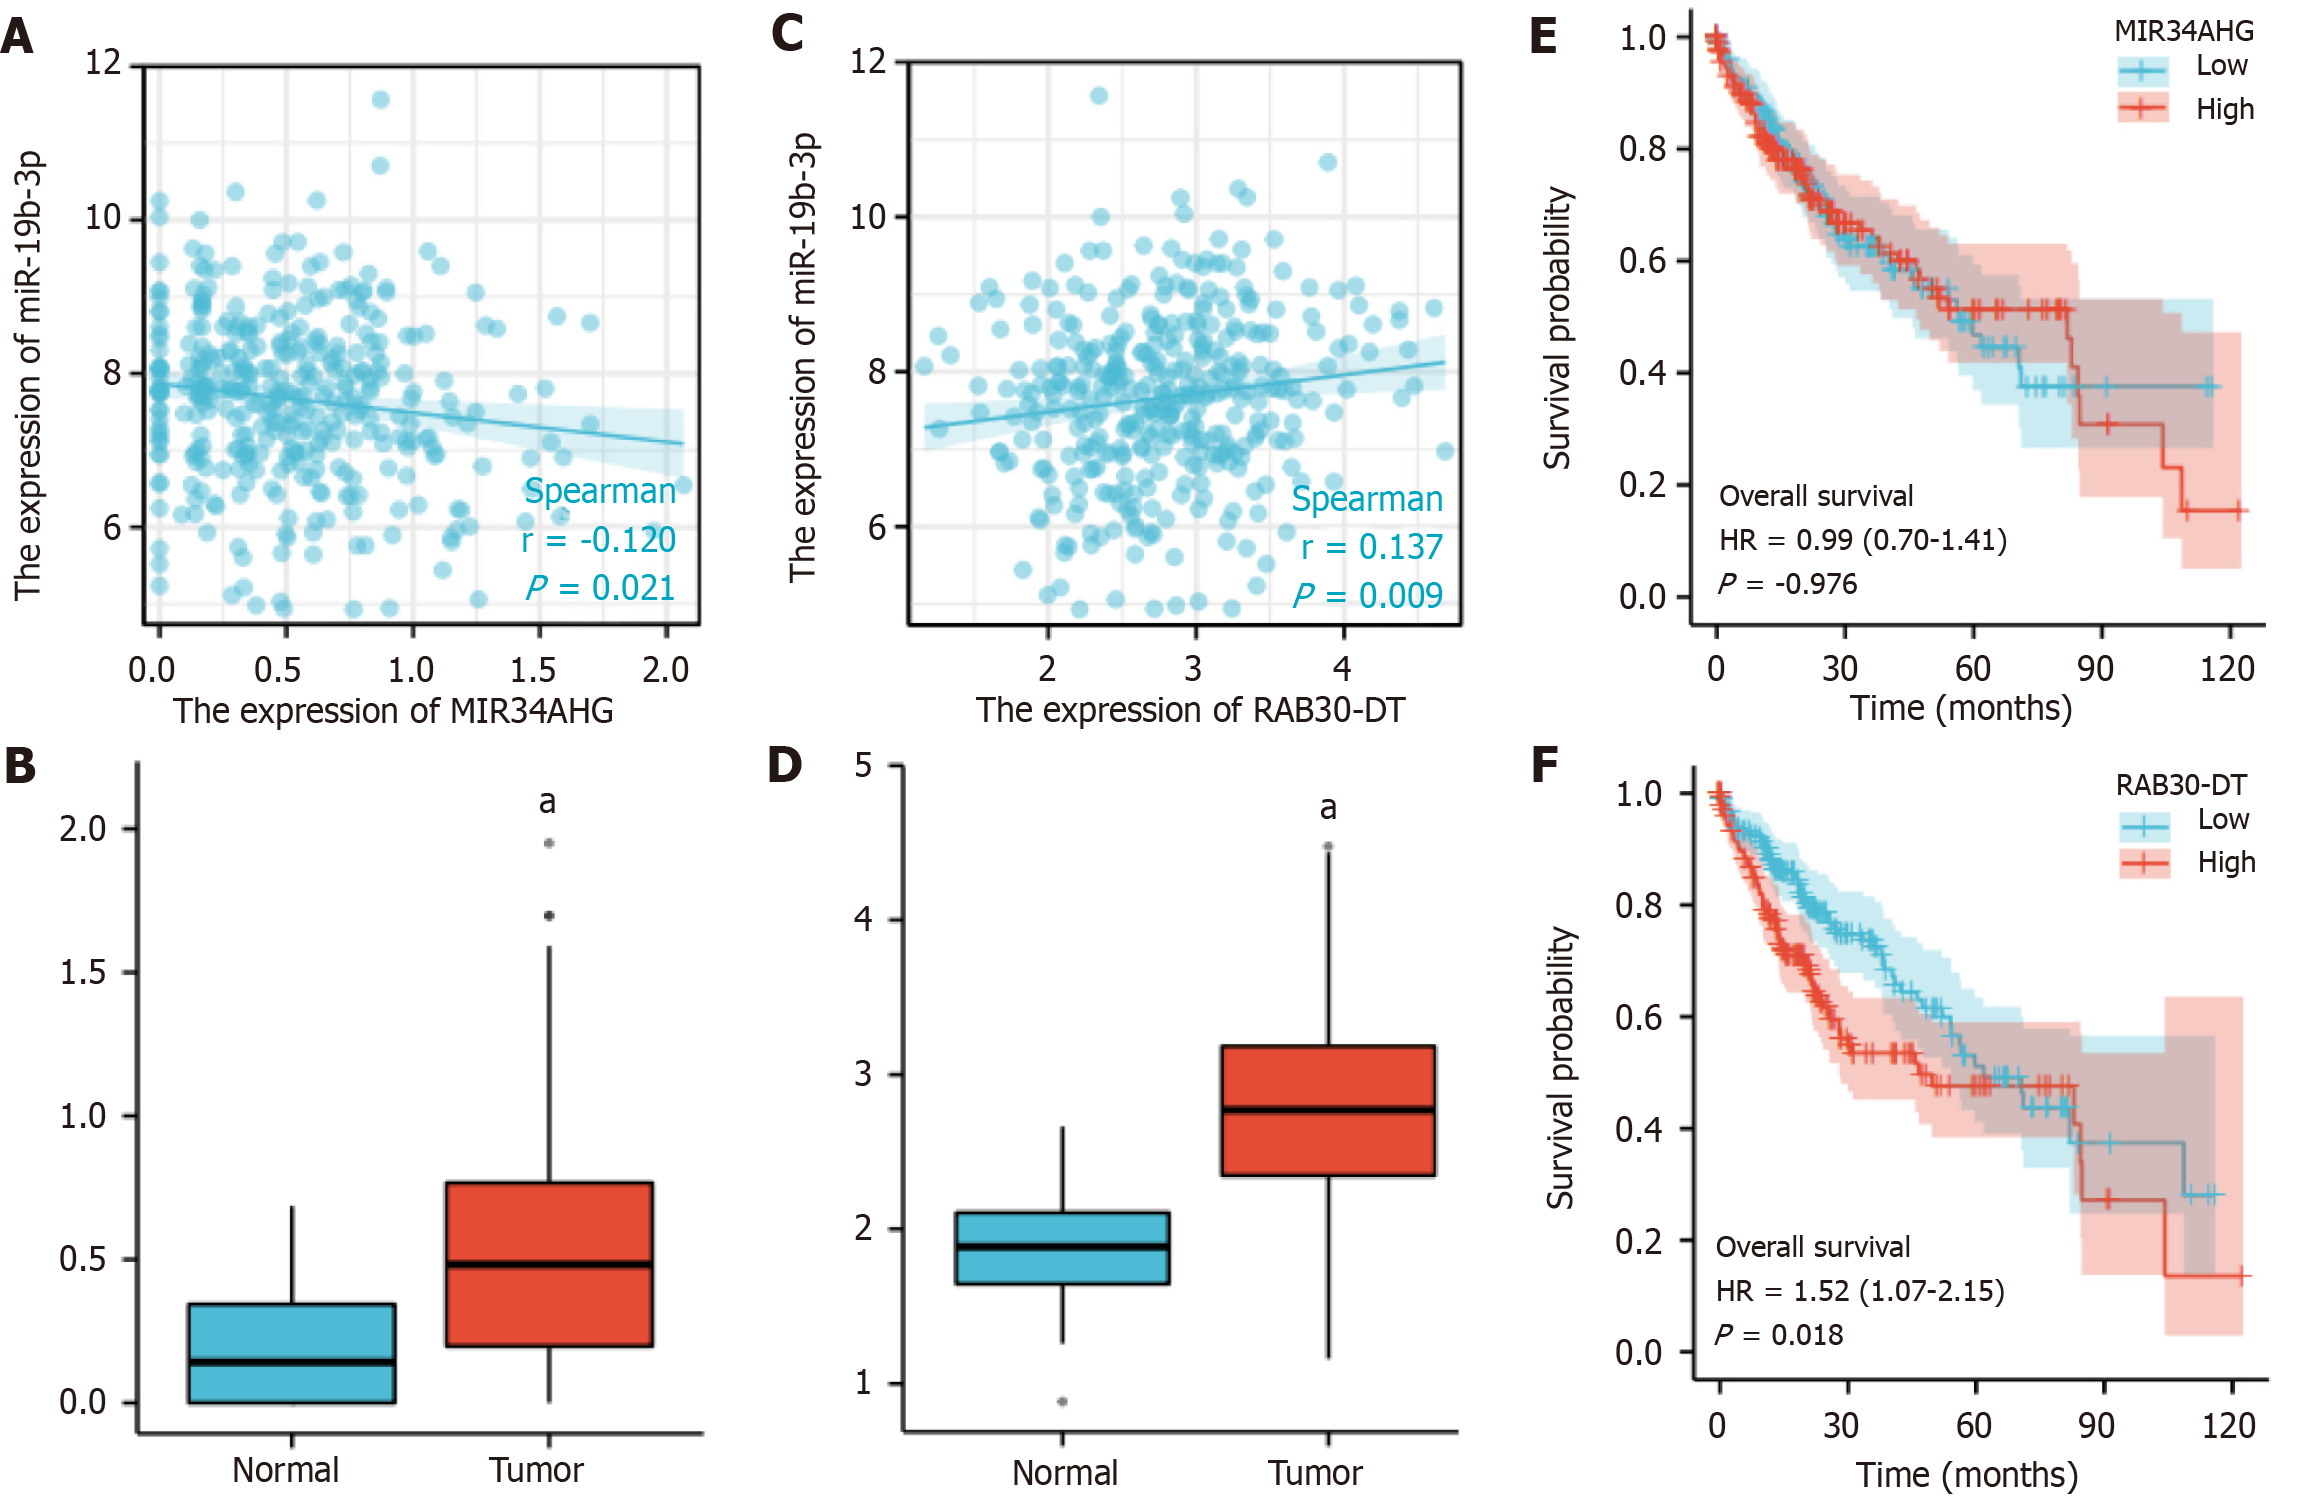
Figure 9 Correlation, difference, and survival curve analyses between miR-19b-3p- BCAR3-related long-stranded non-coding RNA and miRNA in hepatocellular carcinoma, respectively.
A: Negative regulatory relationship between MIR34AHG long-stranded non-coding RNA (lncRNA) and miR-19b-3p, analyzed by Spearman correlate analysis; B: Differential expression of MIR34AHG lncRNA in hepatocellular carcinoma (HCC) tissue; C: Positive regulatory relationship between RAB30-DT lncRNA and miR-19b-3p, analyzed by Spearman correlate analysis; D: Differential expression of RAB30-DT in HCC tissue; E: Kaplan-Meier survival analysis of MIR34AHG lncRNA expression in HCC patients; F: Kaplan-Meier survival analysis of RAB30-DT lncRNA expression in HCC patients. aP value < 0.05.
- Citation: Shi HQ, Huang S, Ma XY, Tan ZJ, Luo R, Luo B, Zhang W, Shi L, Zhong XL, Lü MH, Chen X, Tang XW. BCAR3 and BCAR3-related competing endogenous RNA expression in hepatocellular carcinoma and their prognostic value. World J Gastrointest Oncol 2024; 16(7): 3082-3096
- URL: https://www.wjgnet.com/1948-5204/full/v16/i7/3082.htm
- DOI: https://dx.doi.org/10.4251/wjgo.v16.i7.3082


