Copyright
©The Author(s) 2024.
World J Gastrointest Oncol. Jul 15, 2024; 16(7): 2971-2987
Published online Jul 15, 2024. doi: 10.4251/wjgo.v16.i7.2971
Published online Jul 15, 2024. doi: 10.4251/wjgo.v16.i7.2971
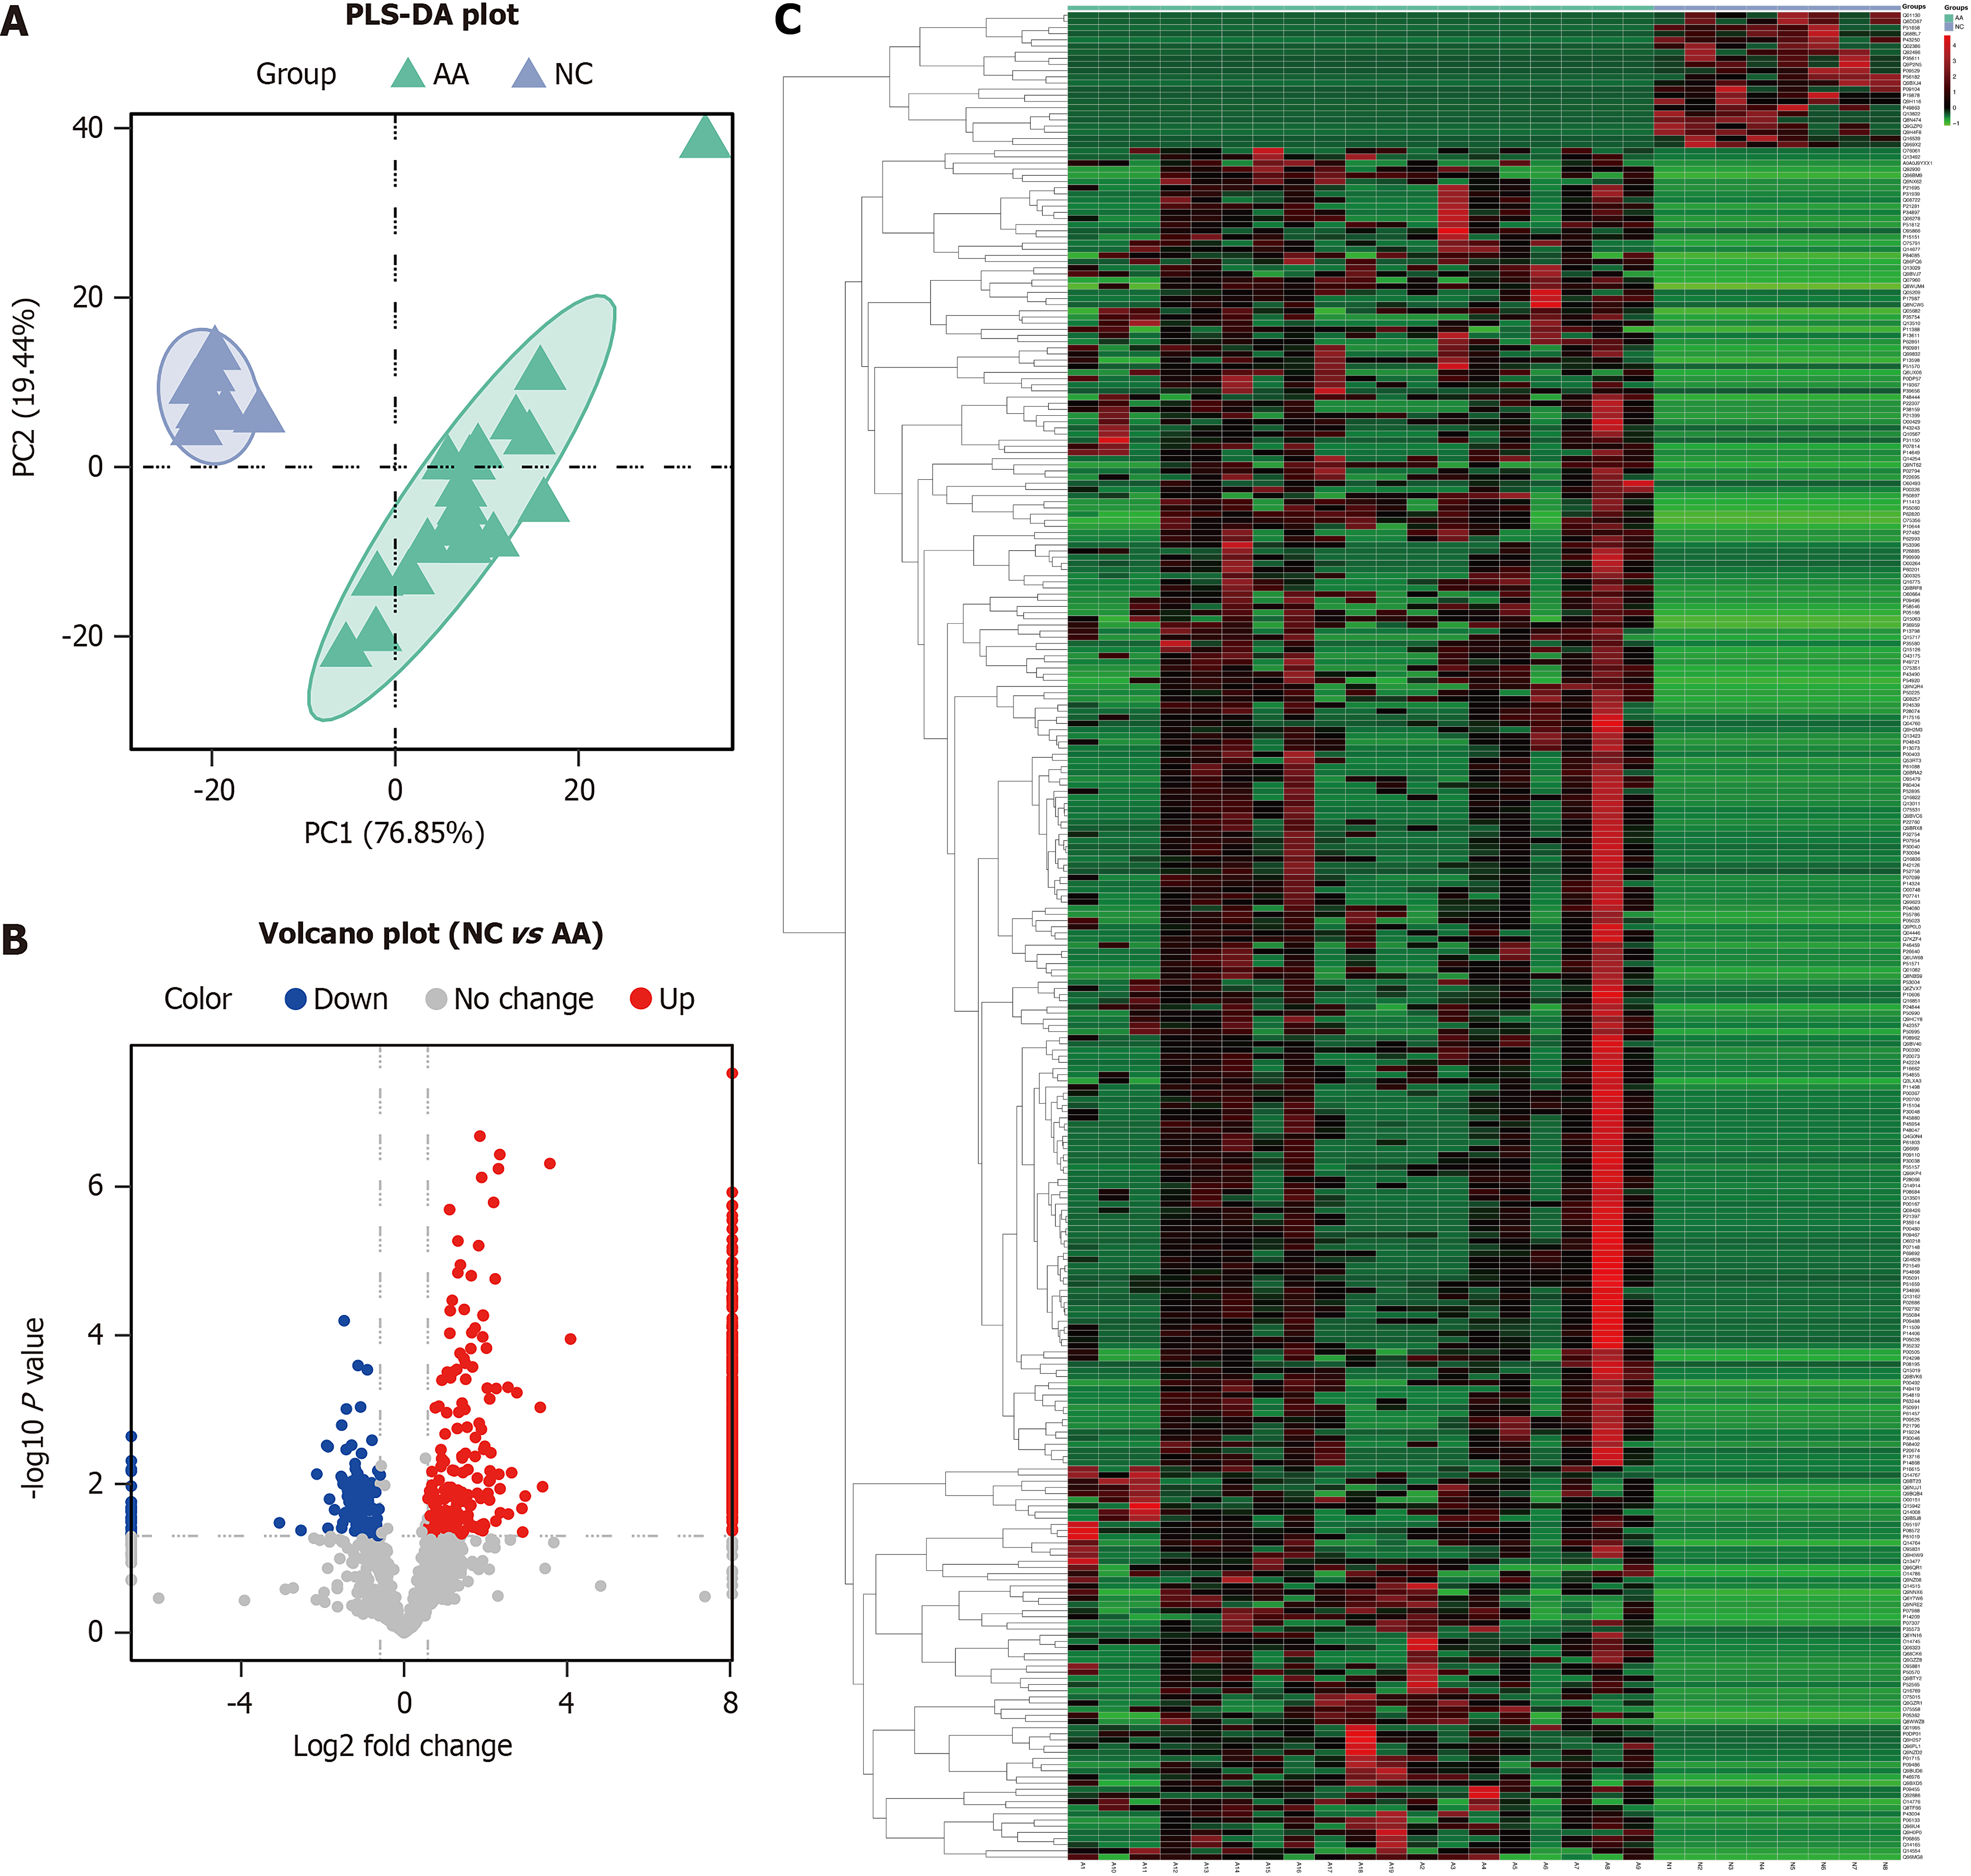
Figure 1 Partial least squares discrimination analysis plot, volcano plot, and heatmap between the normal control group and advanced adenoma group.
A: Partial least squares discrimination analysis shows the protein expression in the normal control group (blue) and advanced adenoma group (green); B: Volcano plot shows the fold change of the identified proteins between the two groups; C: Hierarchical clustering analysis shows the upregulated (red) and downregulated (green) differentially expressed proteins between the two groups. NC: Normal control; AA: Advanced adenoma; PLS-DA: Partial least squares discrimination analysis.
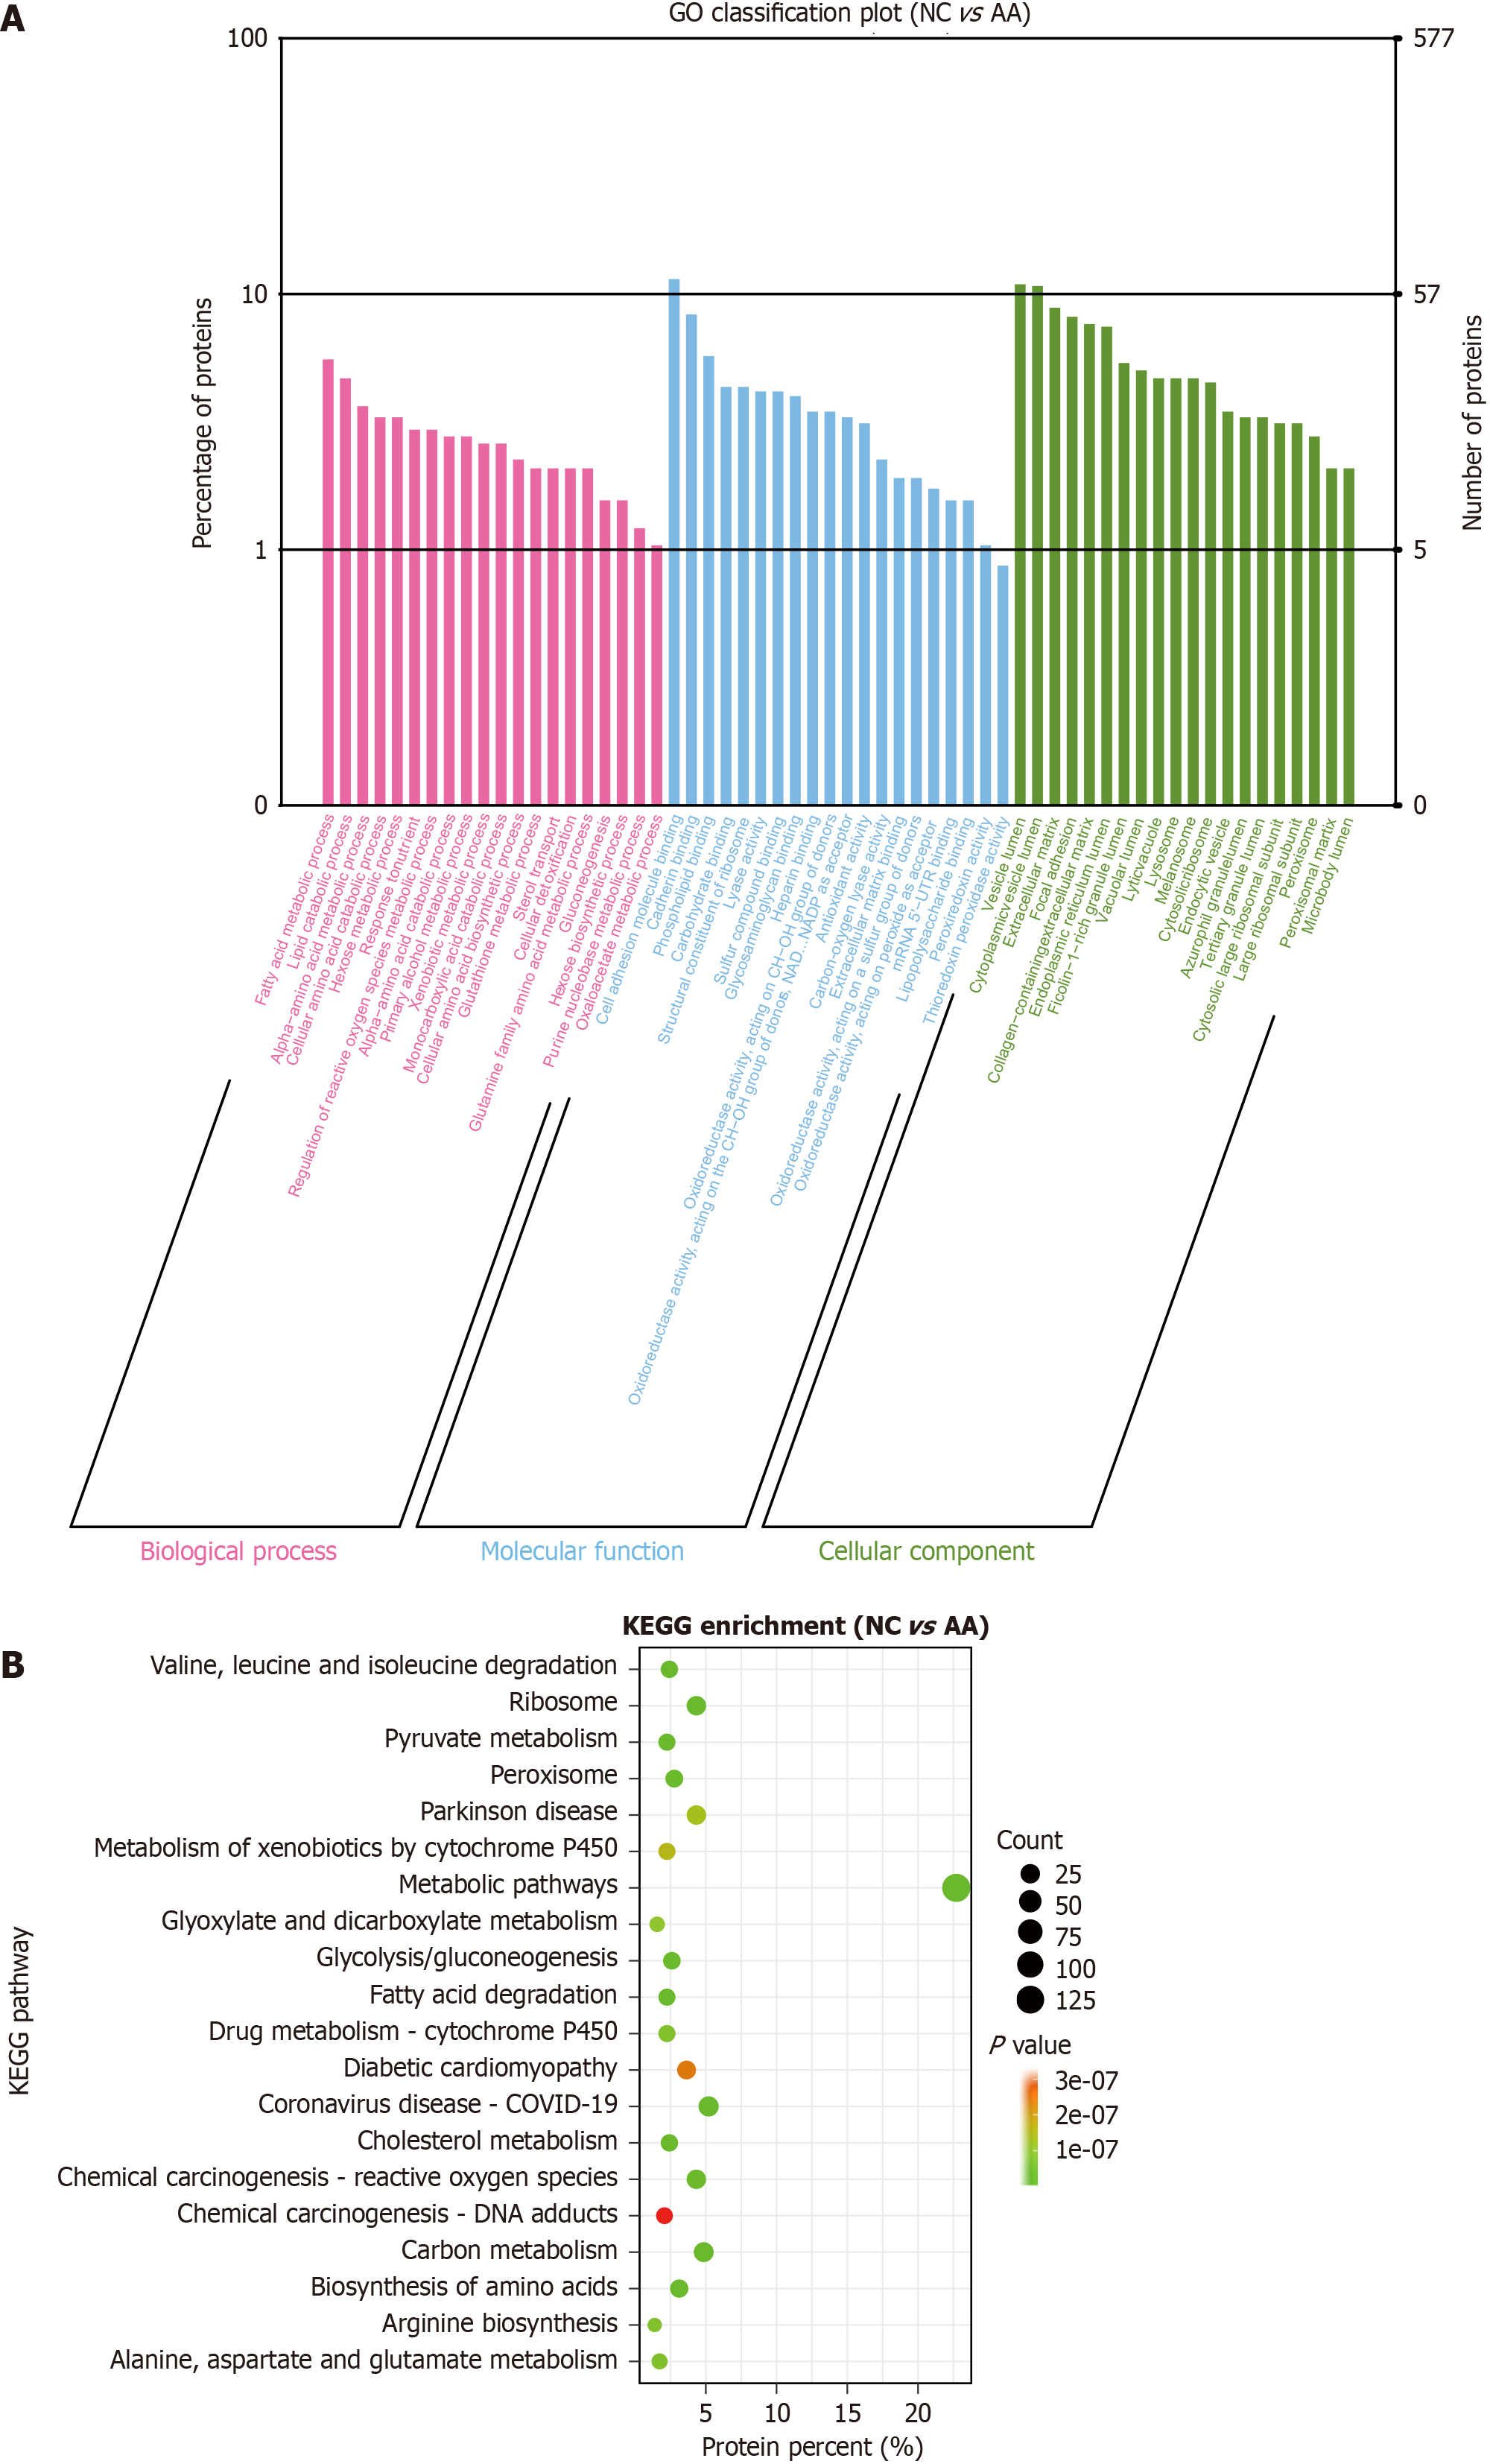
Figure 2 Gene Ontology enrichment and Kyoto Encyclopedia of Genes and Genomes enrichment analysis of differentially expressed protein between the normal control group and advanced adenoma group.
A: Gene Ontology enrichment analysis: differentially expressed proteins (DEPs) are mainly enriched in fatty acid metabolism process, cell adhesion molecule binding, and vesicle lumen; B: Kyoto Encyclopedia of Genes and Genomes enrichment analysis: DEPs are mainly enriched in metabolic pathways and ribosomes. NC: Normal control; AA: Advanced adenoma; DEPs: Differentially expressed proteins; GO: Gene Ontology; KEGG: Kyoto Encyclopedia of Genes and Genomes.
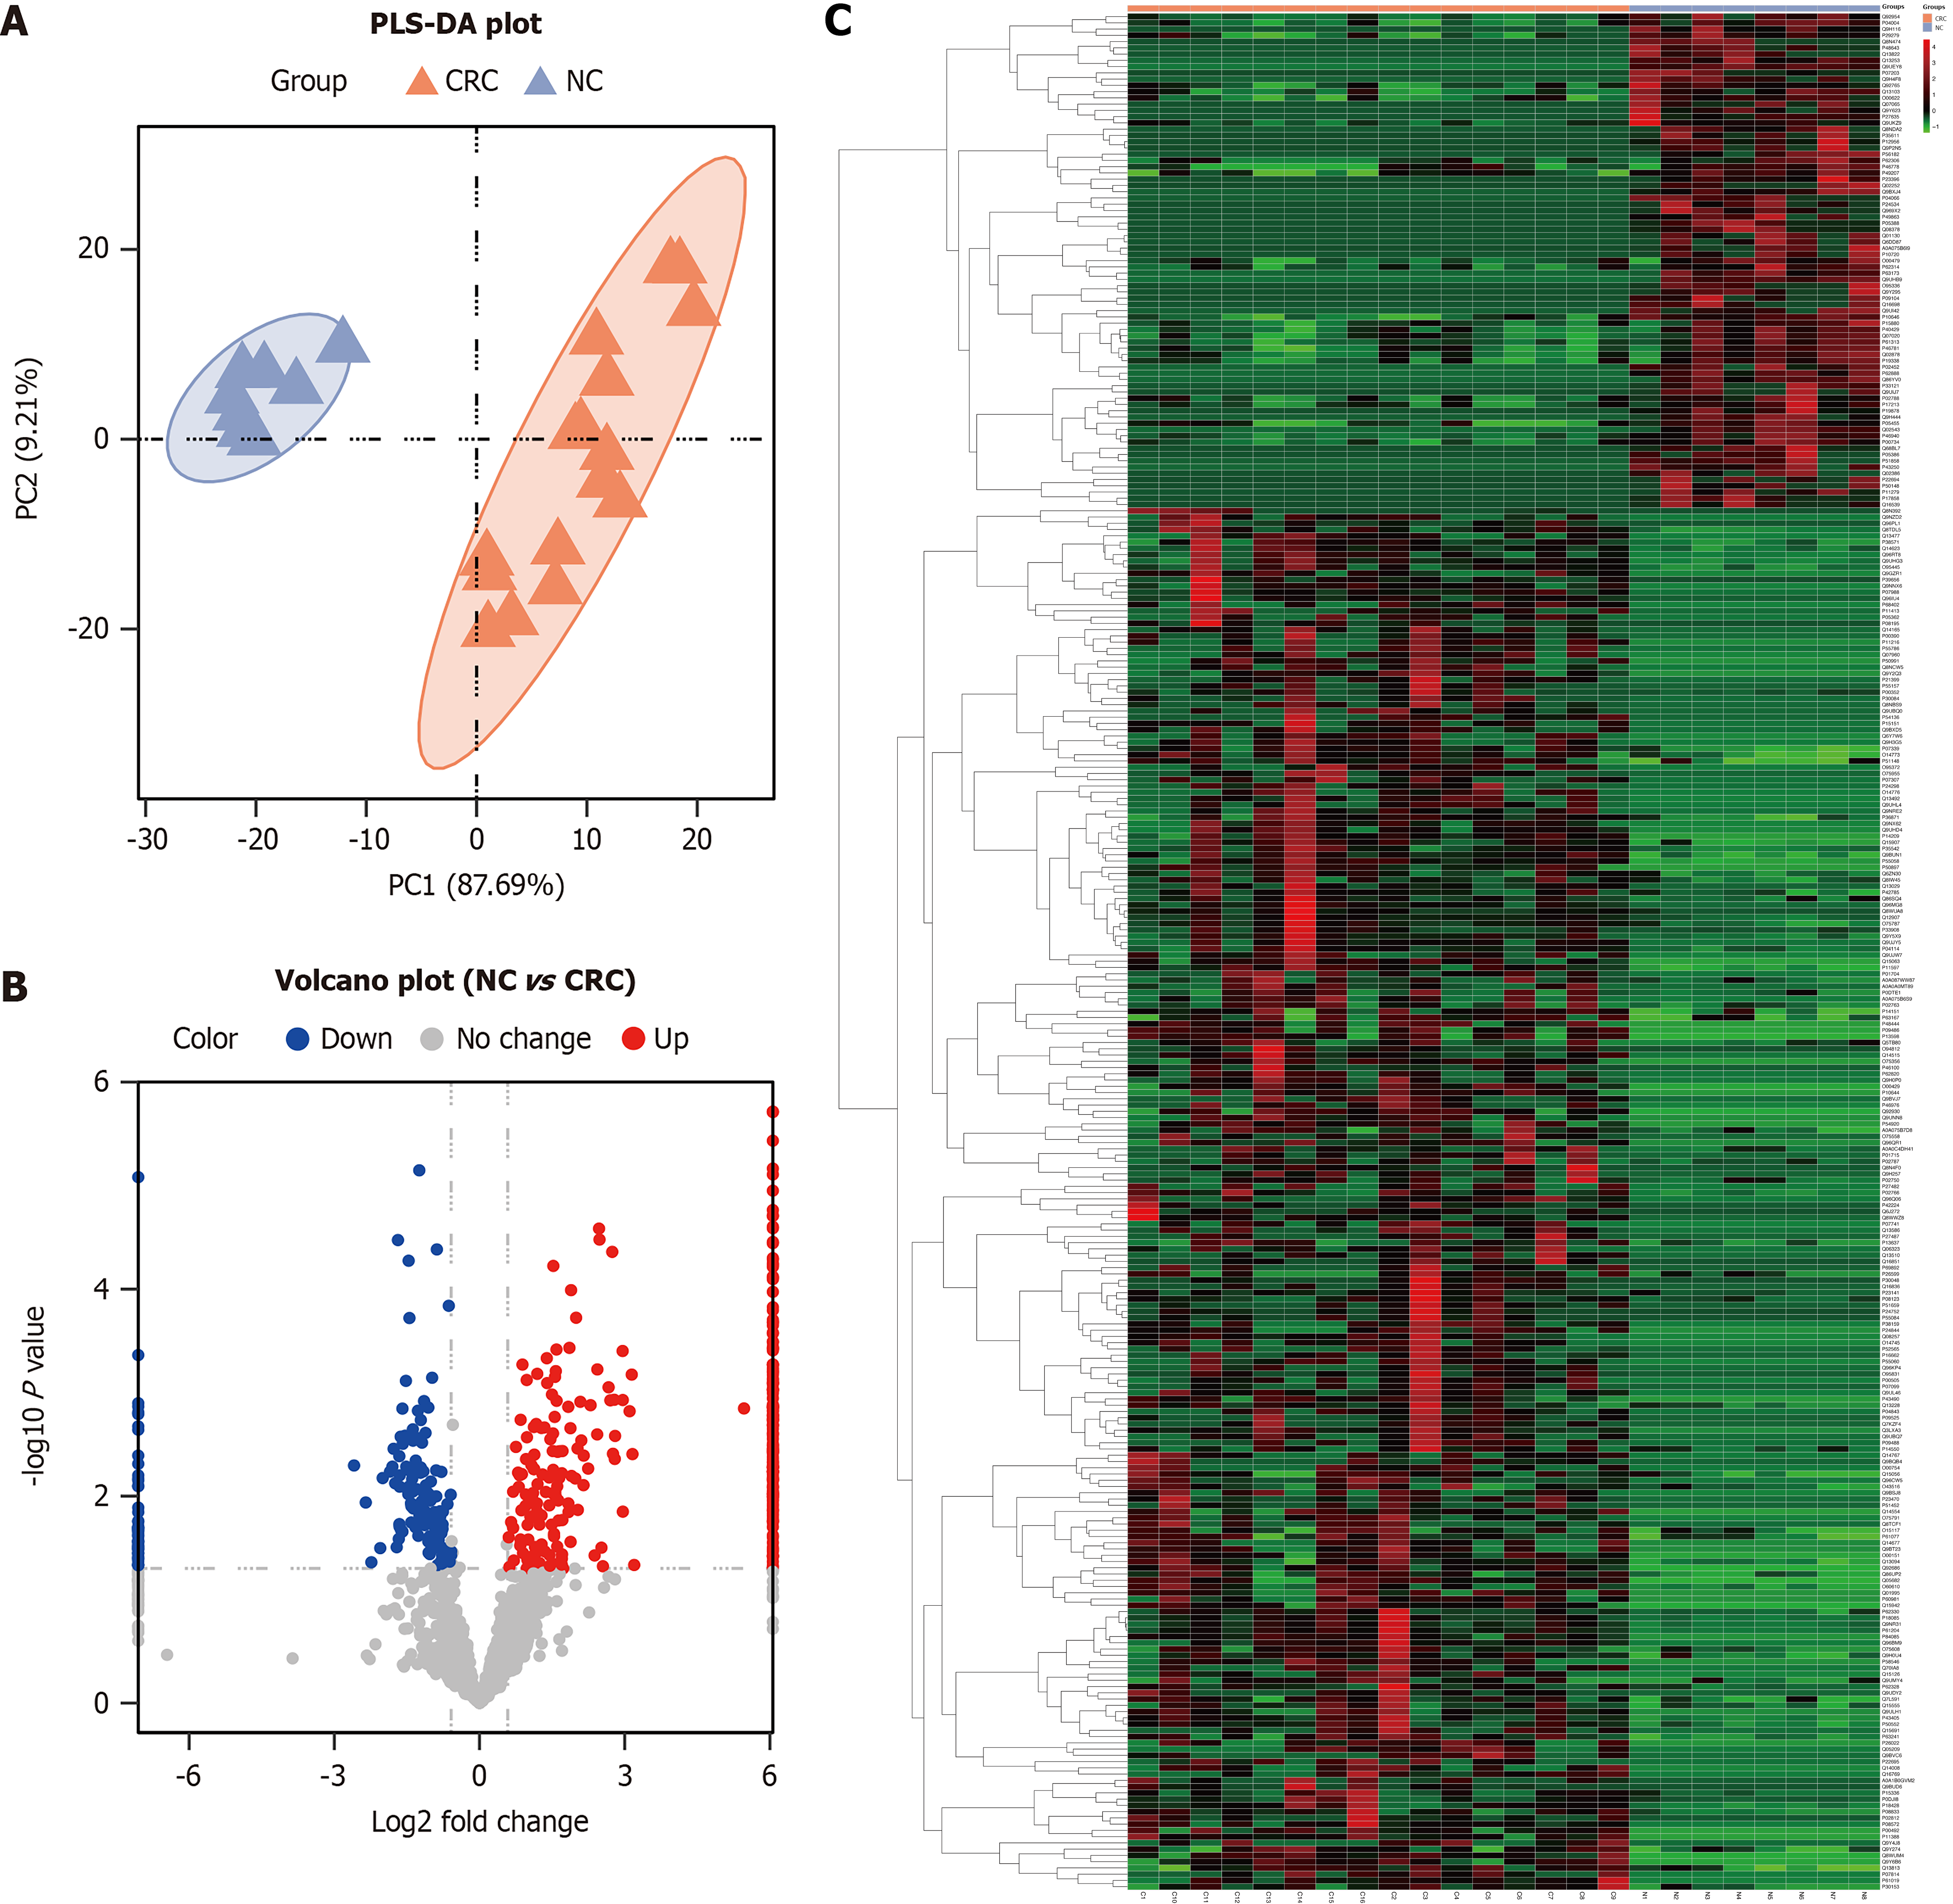
Figure 3 Partial least squares discrimination analysis plot, volcano plot, and heatmap between the normal control group and colorectal cancer group.
A: Partial least squares discrimination analysis shows the protein expression in the normal control group (blue) and colorectal cancer group (orange); B: Volcano plot shows the fold change of the identified proteins between the two groups; C: Hierarchical clustering analysis shows the upregulated (red) and downregulated (green) partial least squares discrimination analysis between the two groups. NC: Normal control; CRC: Colorectal cancer; PLS-DA: Partial least squares discrimination analysis.
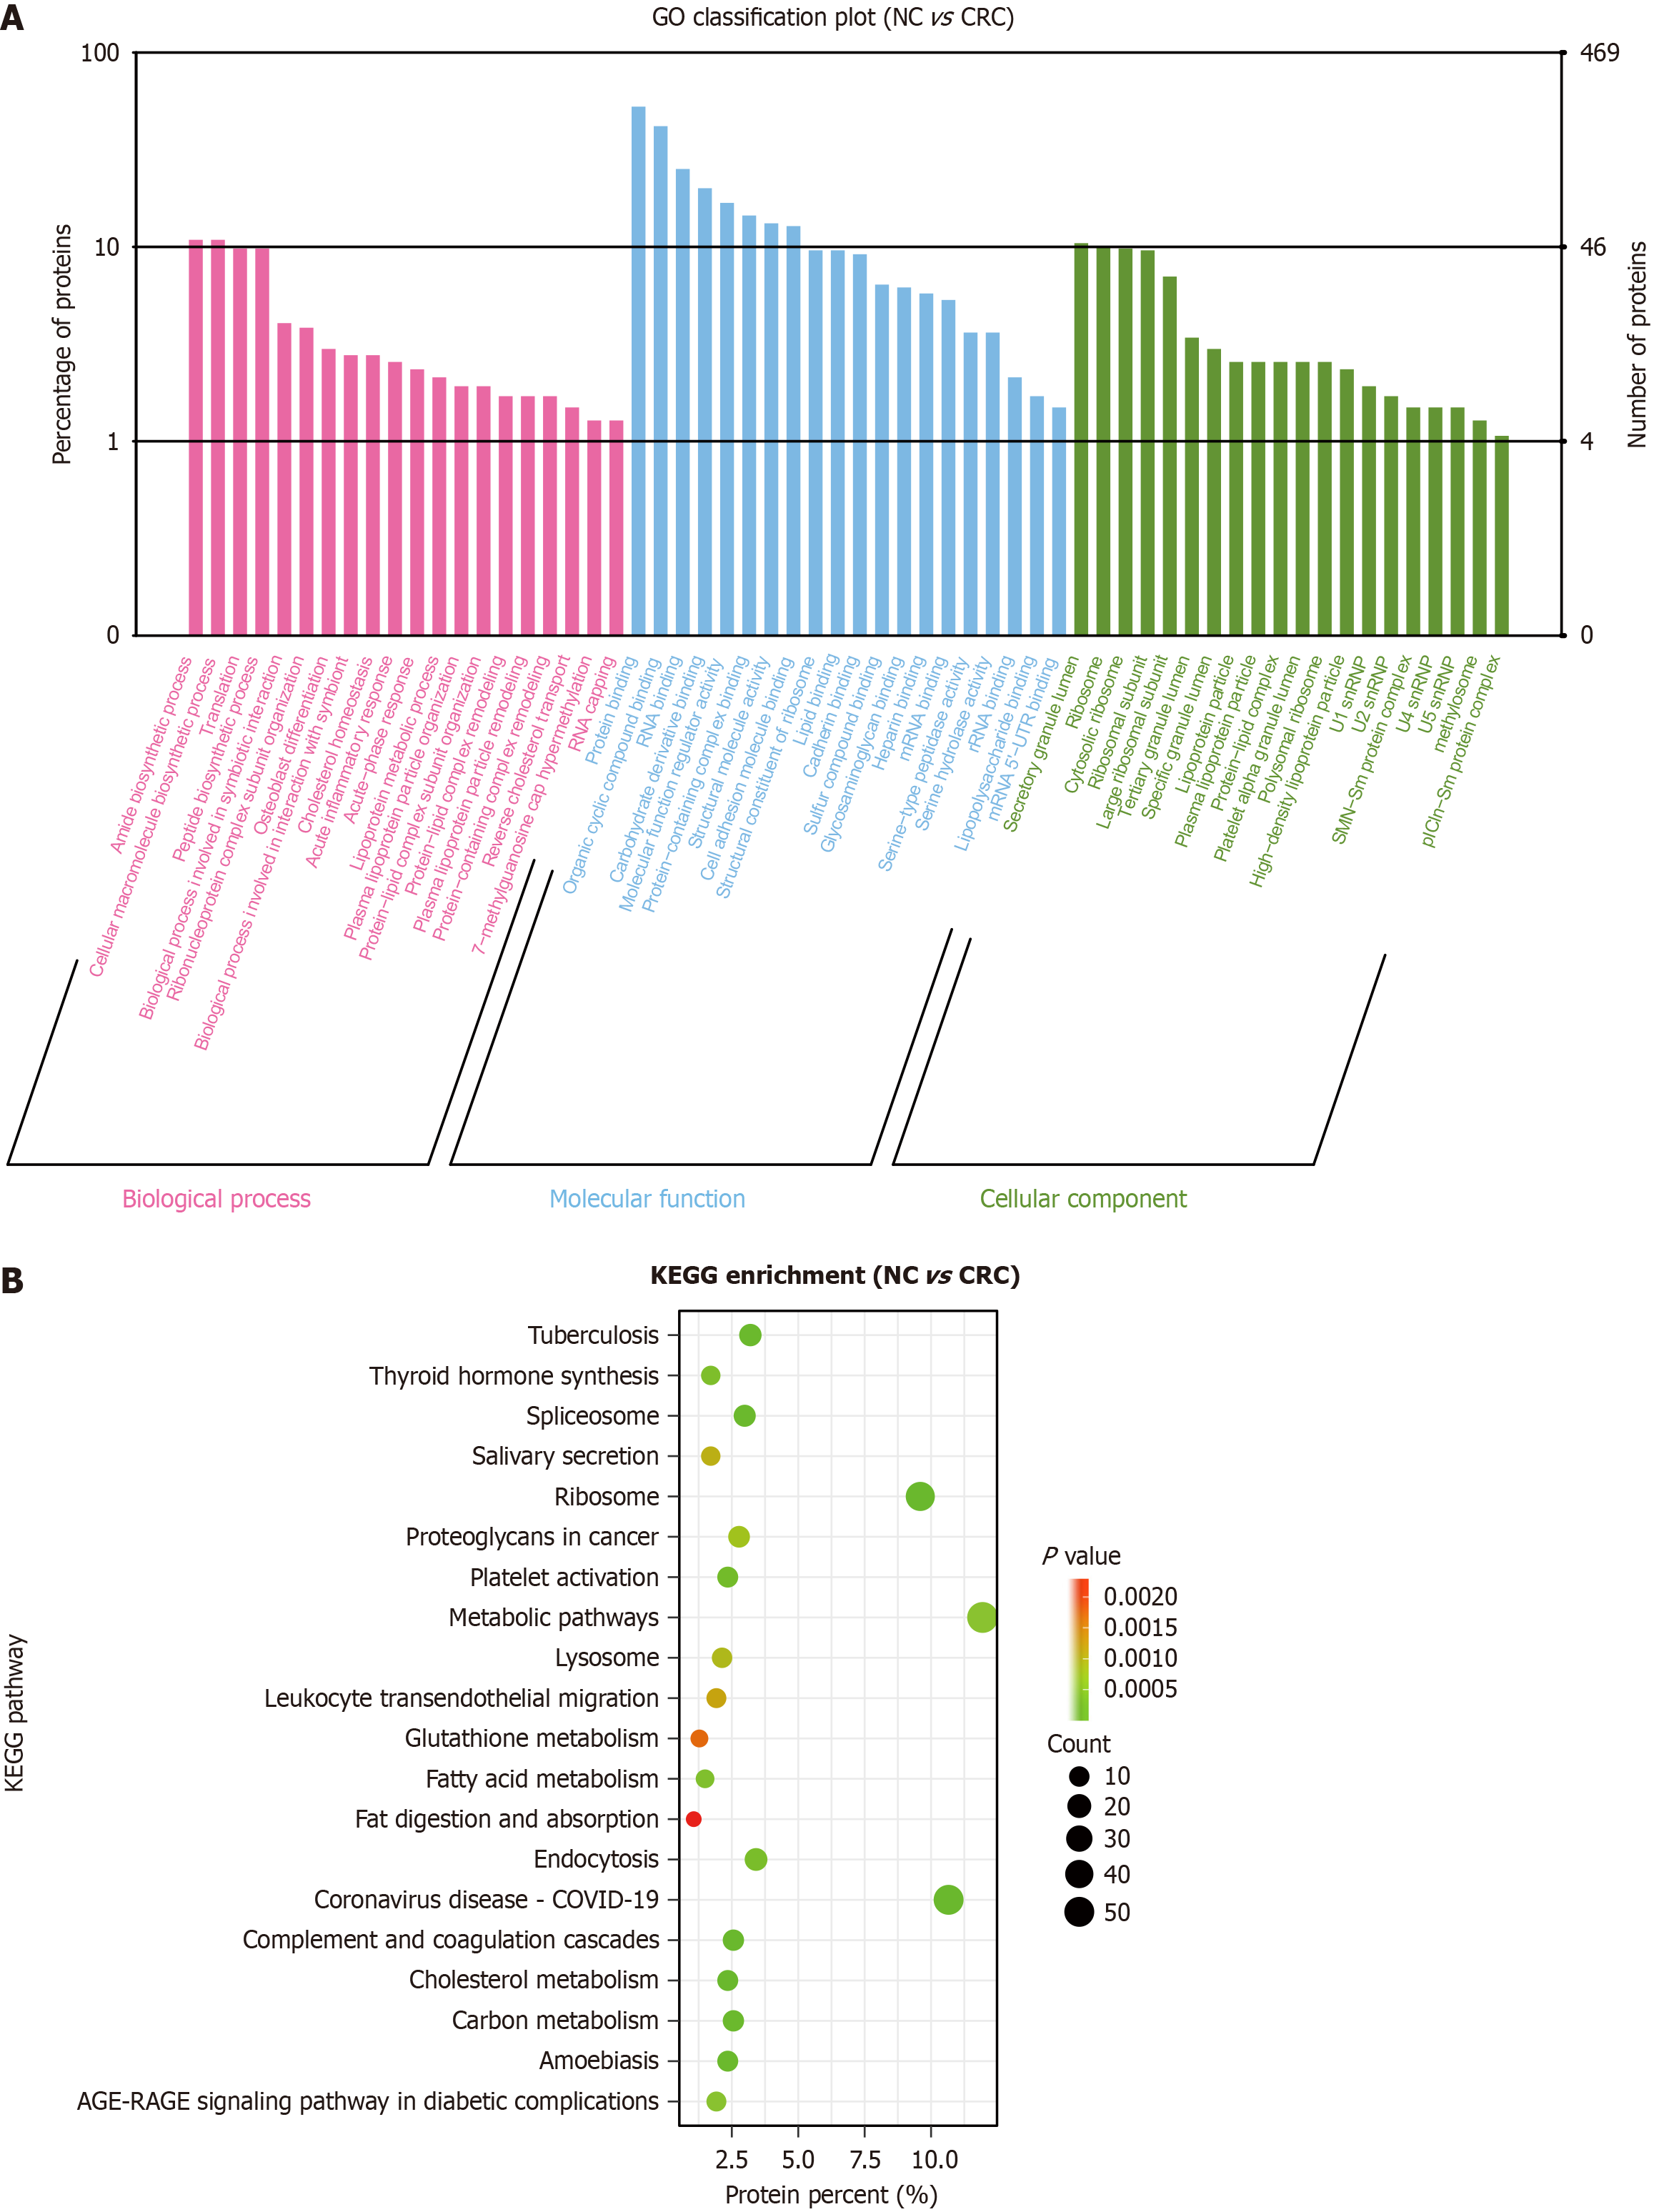
Figure 4 Gene Ontology enrichment and Kyoto Encyclopedia of Genes and Genomes enrichment analysis of differentially expressed proteins between the normal control group and colorectal cancer group.
A: Gene Ontology enrichment analysis: Differentially expressed proteins (DEPs) are mainly enriched in amide biosynthetic process, protein binding, and secretory granule lumen; B: Kyoto Encyclopedia of Genes and Genomes enrichment analysis: DEPs are mainly enriched in metabolic pathways, ribosomes, and endocytosis. NC: Normal control; CRC: Colorectal cancer; DEPs: Differentially expressed proteins; GO: Gene Ontology; KEGG: Kyoto Encyclopedia of Genes and Genomes.
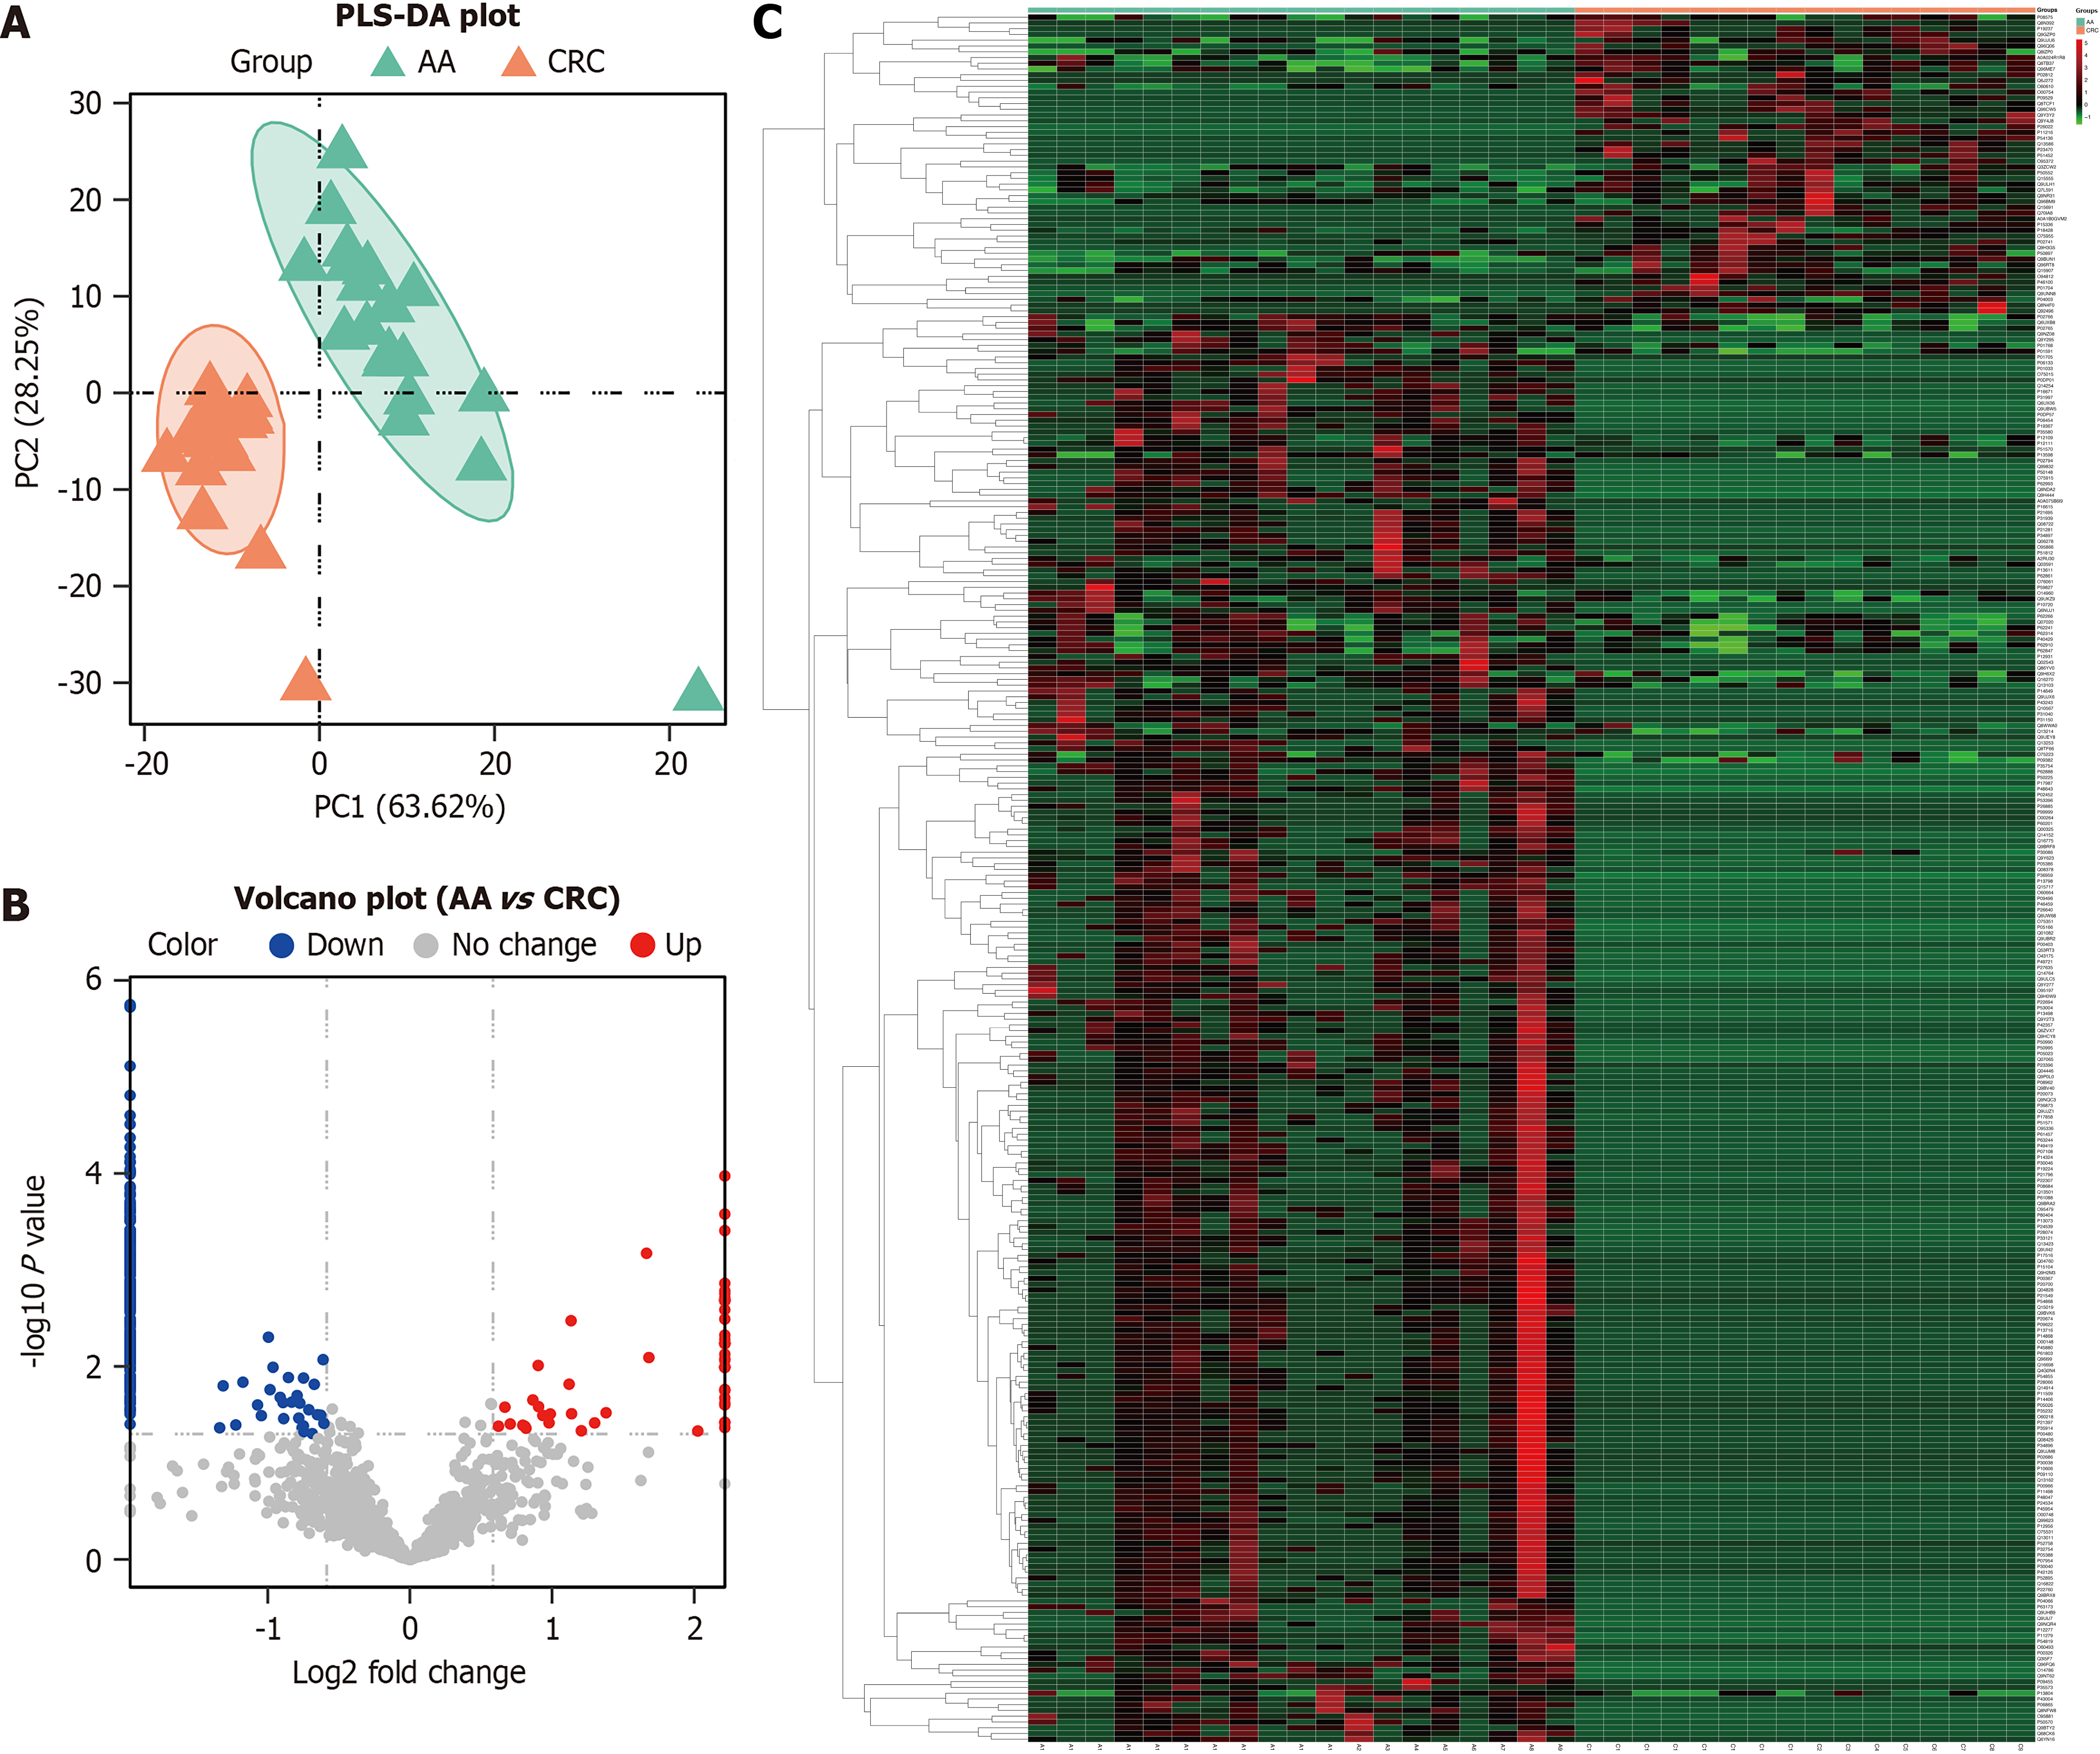
Figure 5 Partial least squares discrimination analysis plot, volcano plot, and heatmap between the advanced adenoma group and colorectal cancer group.
A: Partial least squares discrimination analysis shows the protein expression in the advanced adenoma group (green) and colorectal cancer group (orange); B: Volcano plot shows the fold change of the identified proteins between the two groups; C: Hierarchical clustering analysis shows the upregulated (red) and downregulated (green) differentially expressed proteins between the two groups. AA: Advanced adenoma; CRC: Colorectal cancer; PLS-DA: Partial least squares discrimination analysis.
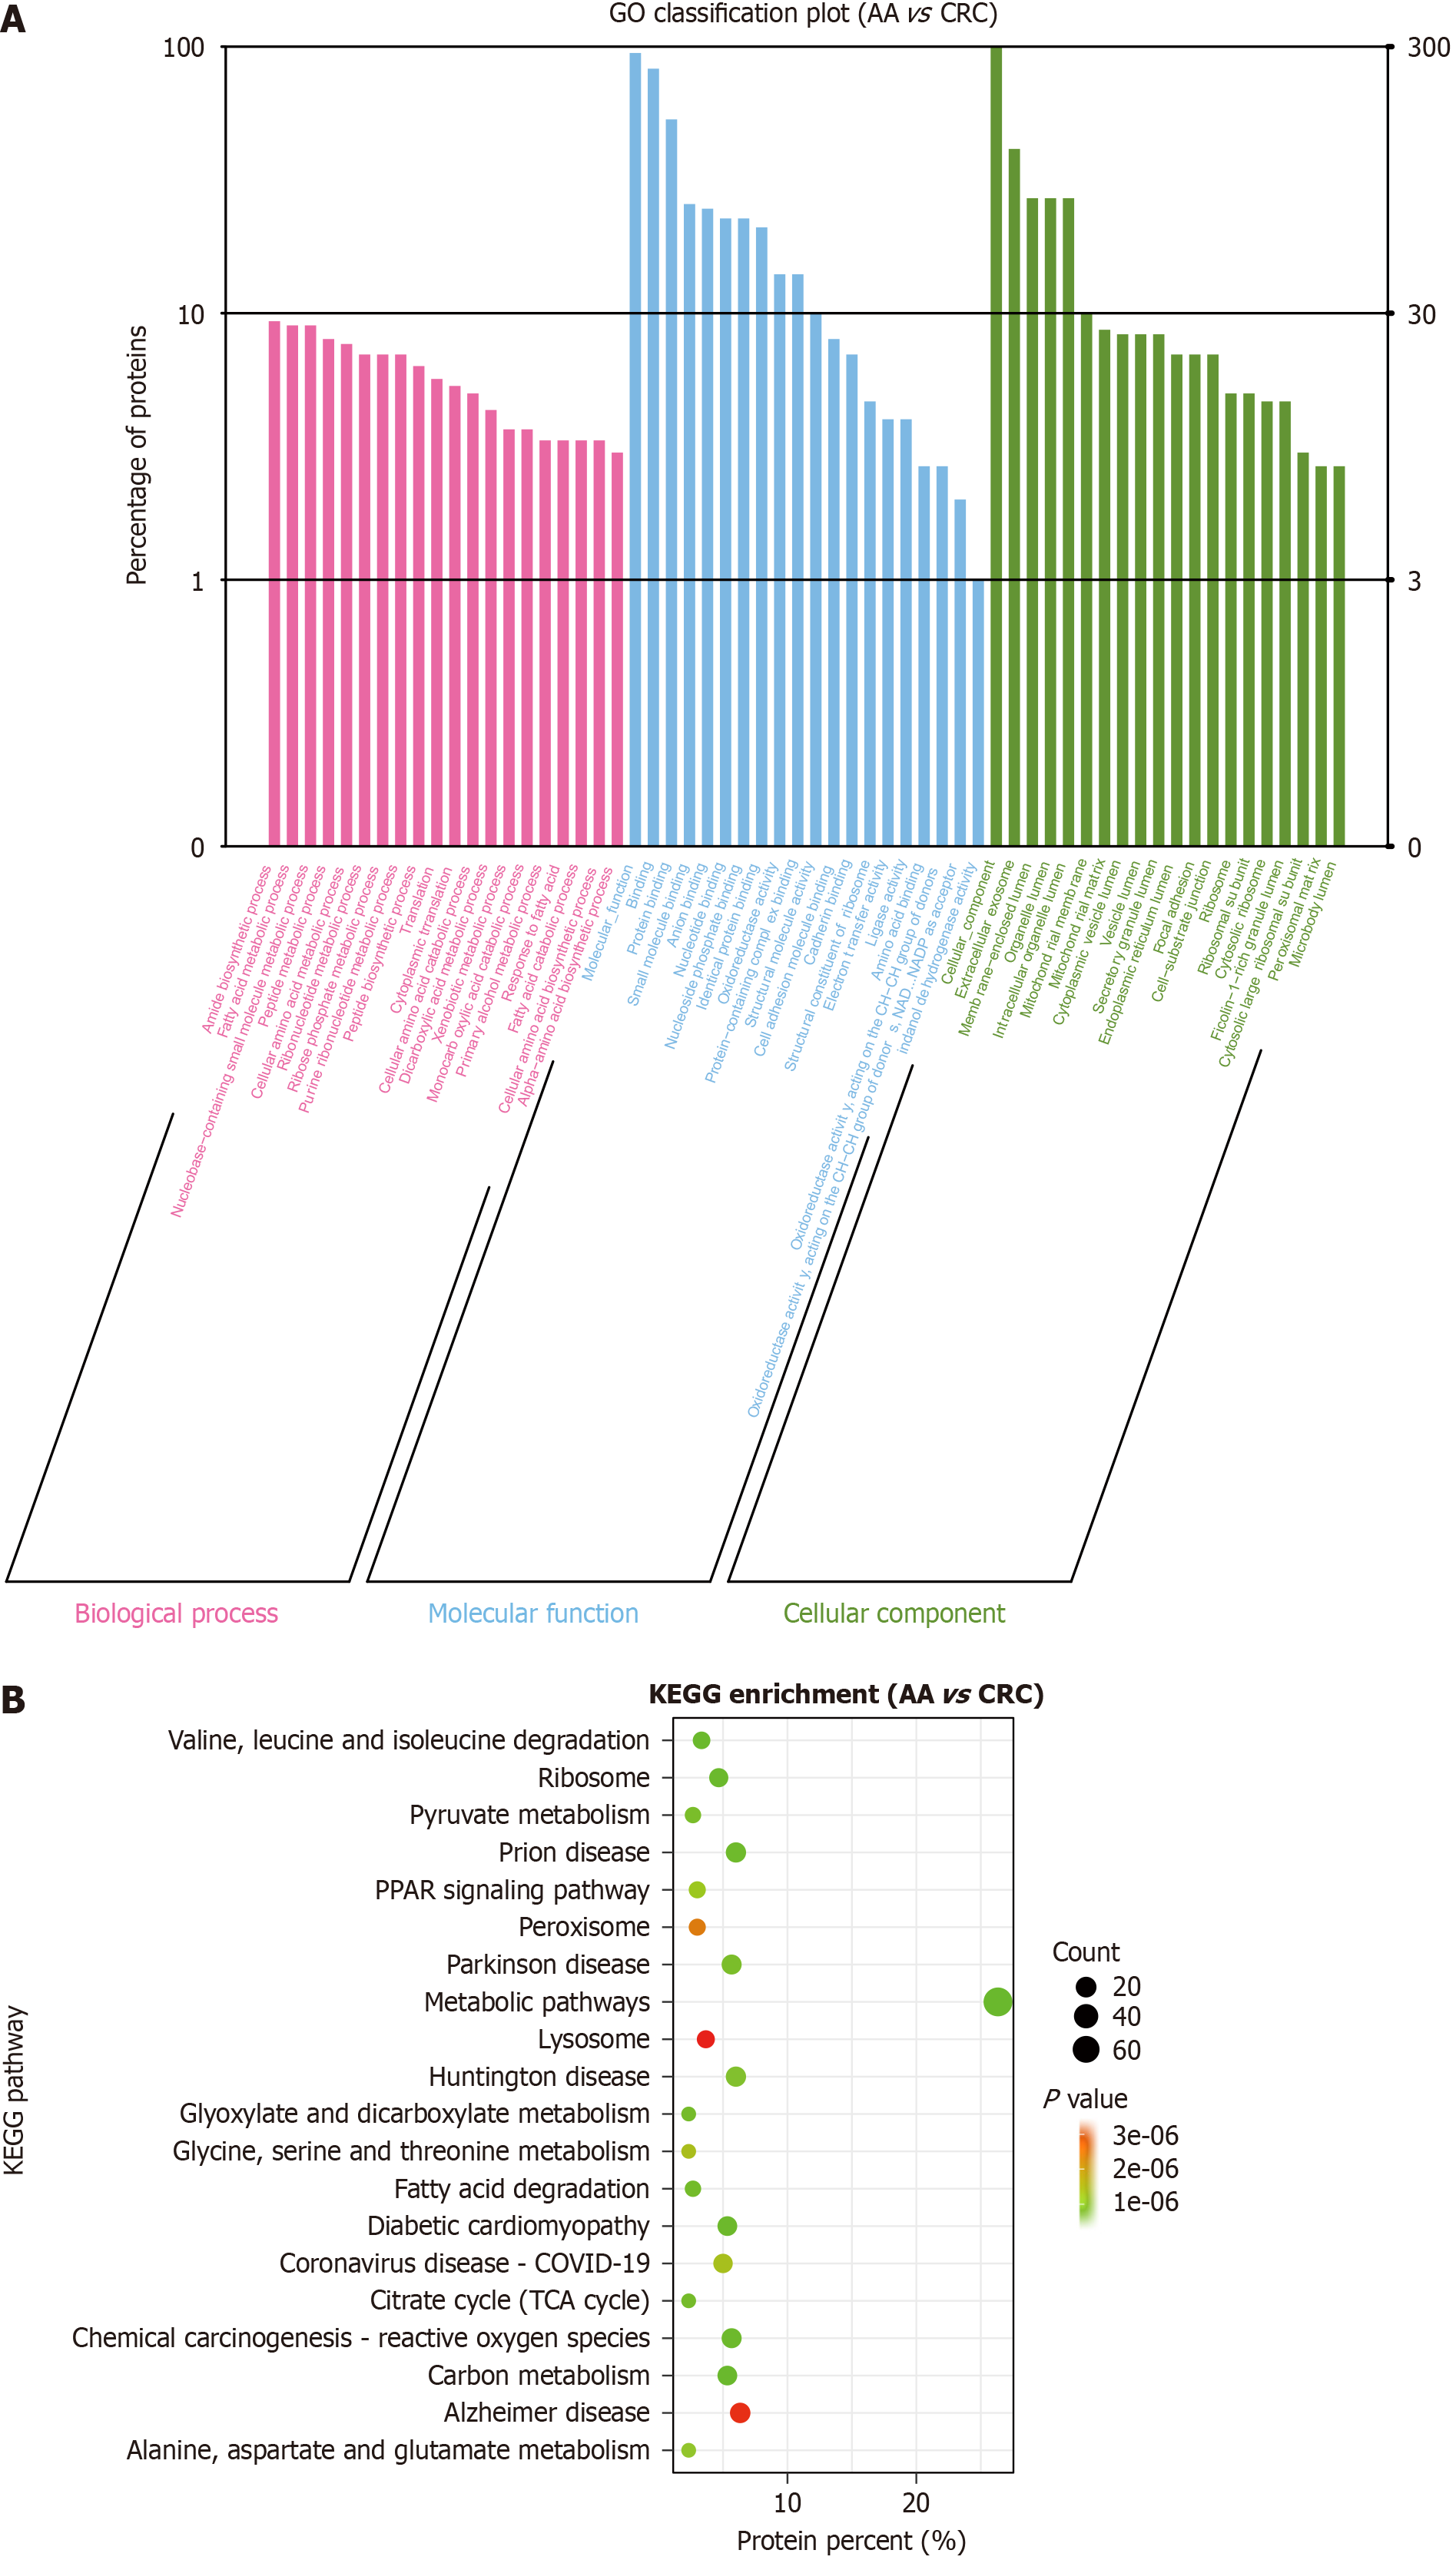
Figure 6 Gene Ontology enrichment and Kyoto Encyclopedia of Genes and Genomes enrichment analysis of differentially expressed proteins between the advanced adenoma group and colorectal cancer group.
A: Gene Ontology enrichment analysis: Differentially expressed proteins (DEPs) are mainly enriched in amide biosynthetic process, protein binding, and extracellular exosome; B: Kyoto Encyclopedia of Genes and Genomes enrichment analysis: DEPs are mainly enriched in metabolic pathways, ribosomes, and PPAR signaling pathway. AA: Advanced adenoma; CRC: Colorectal cancer; DEPs: Differentially expressed proteins; GO: Gene Ontology; KEGG: Kyoto Encyclopedia of Genes and Genomes.
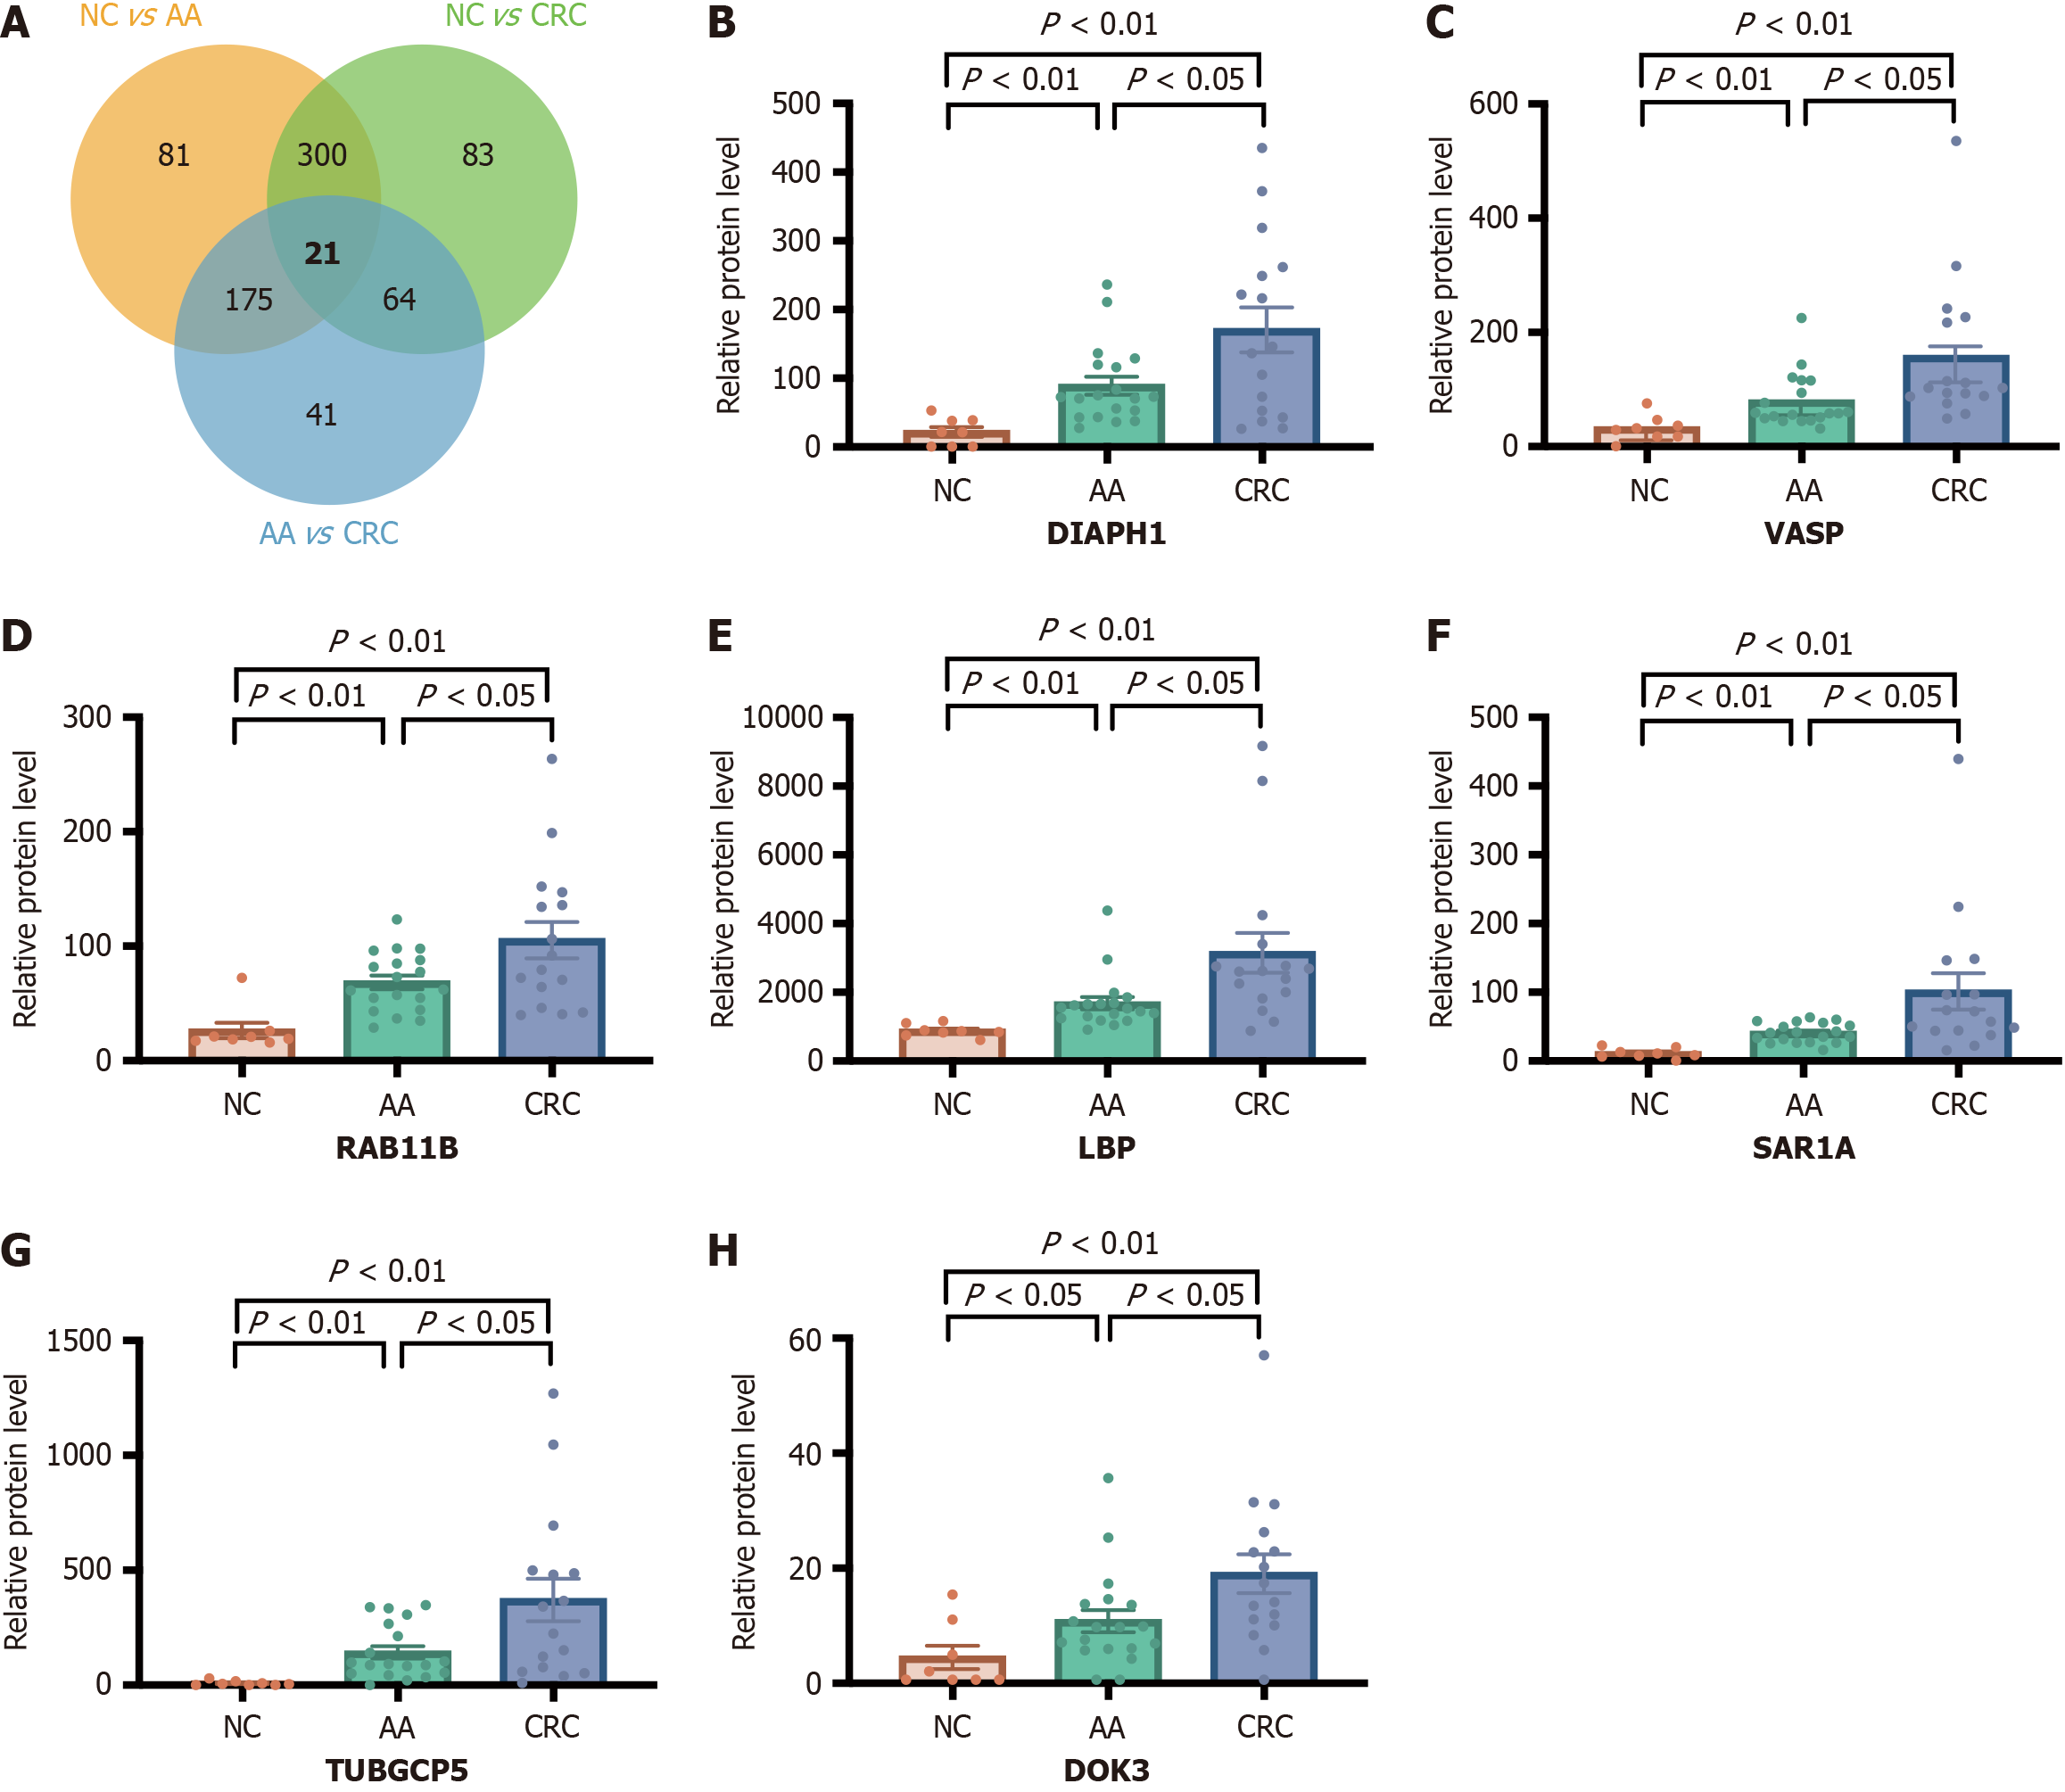
Figure 7 Intersecting differentially expressed proteins of the normal control, advanced adenoma, and colorectal cancer groups and serum relative protein level of seven biomarkers.
A: Venn diagram indicates the intersecting differentially expressed proteins of the normal control (NC), advanced adenoma (AA), and colorectal cancer (CRC) groups; B-H: Serum relative protein level of DIAPH1, VASP, RAB11B, LBP, SAR1A, TUBGCP5, and DOK3 in NC, AA, CRC groups. DEPs: Differentially expressed proteins; NC: Normal control; AA: Advanced adenoma; CRC: Colorectal cancer.
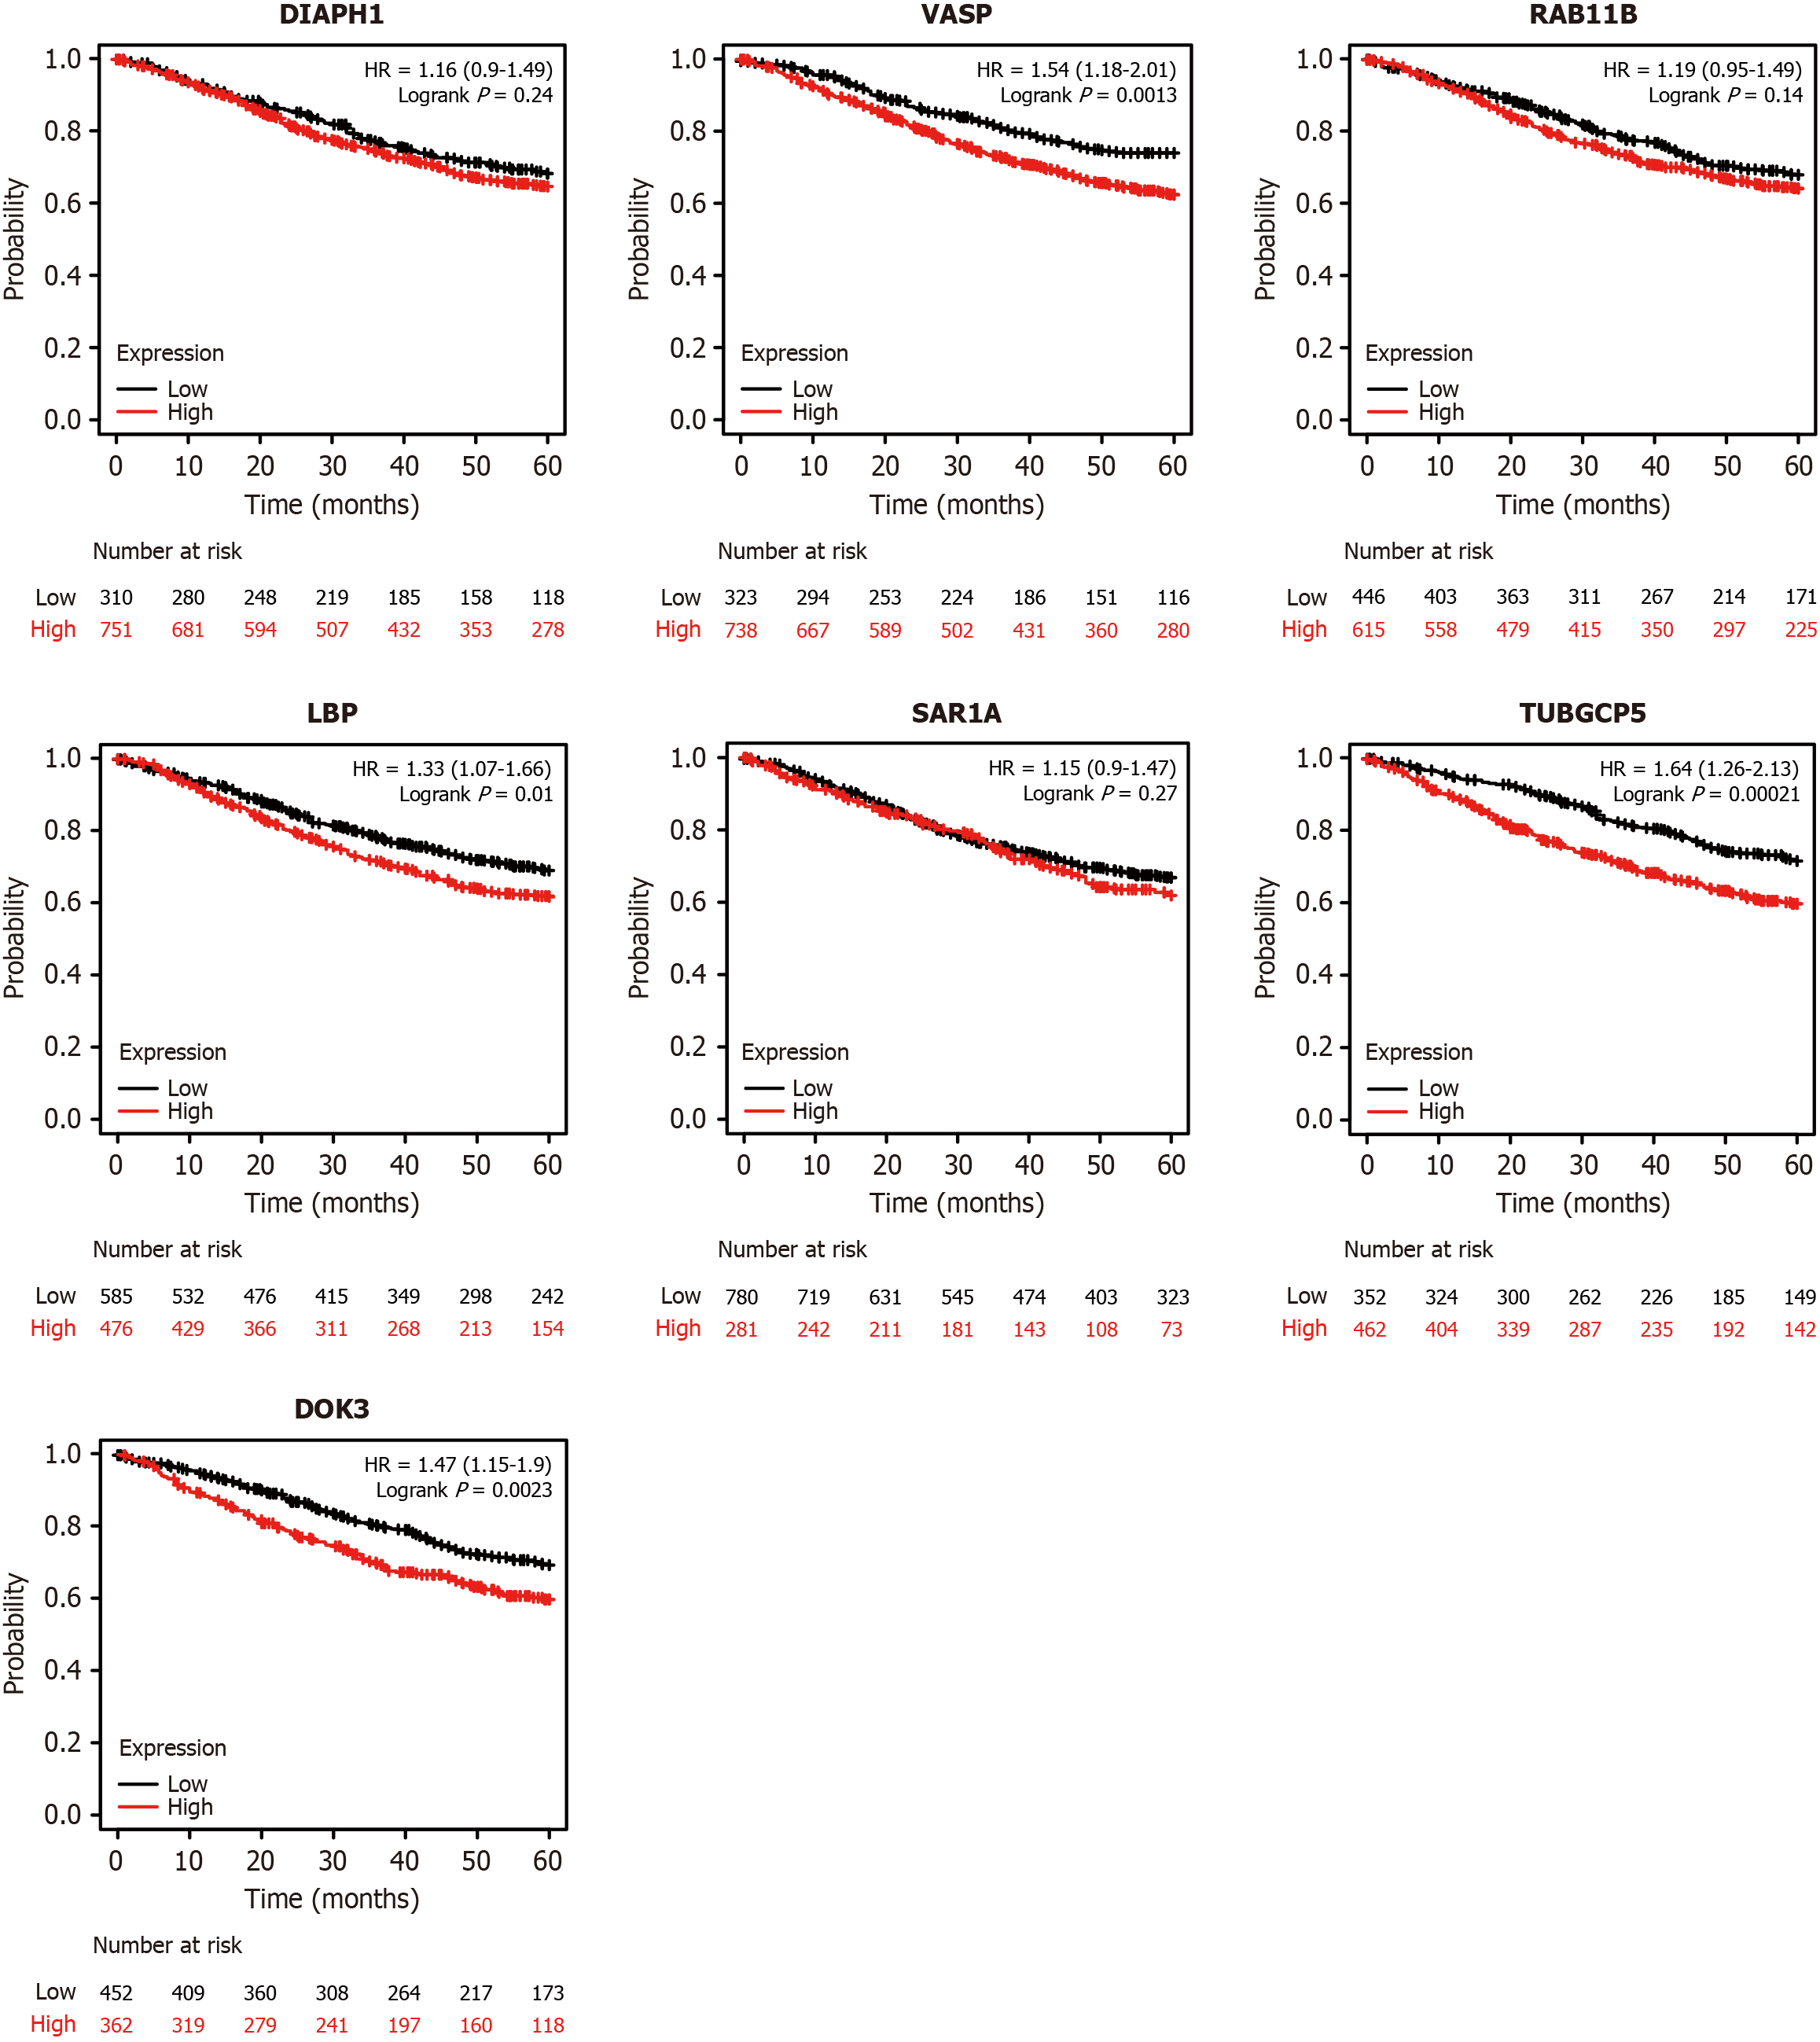
Figure 8 The relationship between seven protein biomarkers and 5-year overall survival in colorectal cancer patients.
Patients with high expression of VASP, LBP, TUBGCP5, and DOK3 had significantly lower overall survival rates. OS: Overall survival; CRC: Colorectal cancer.
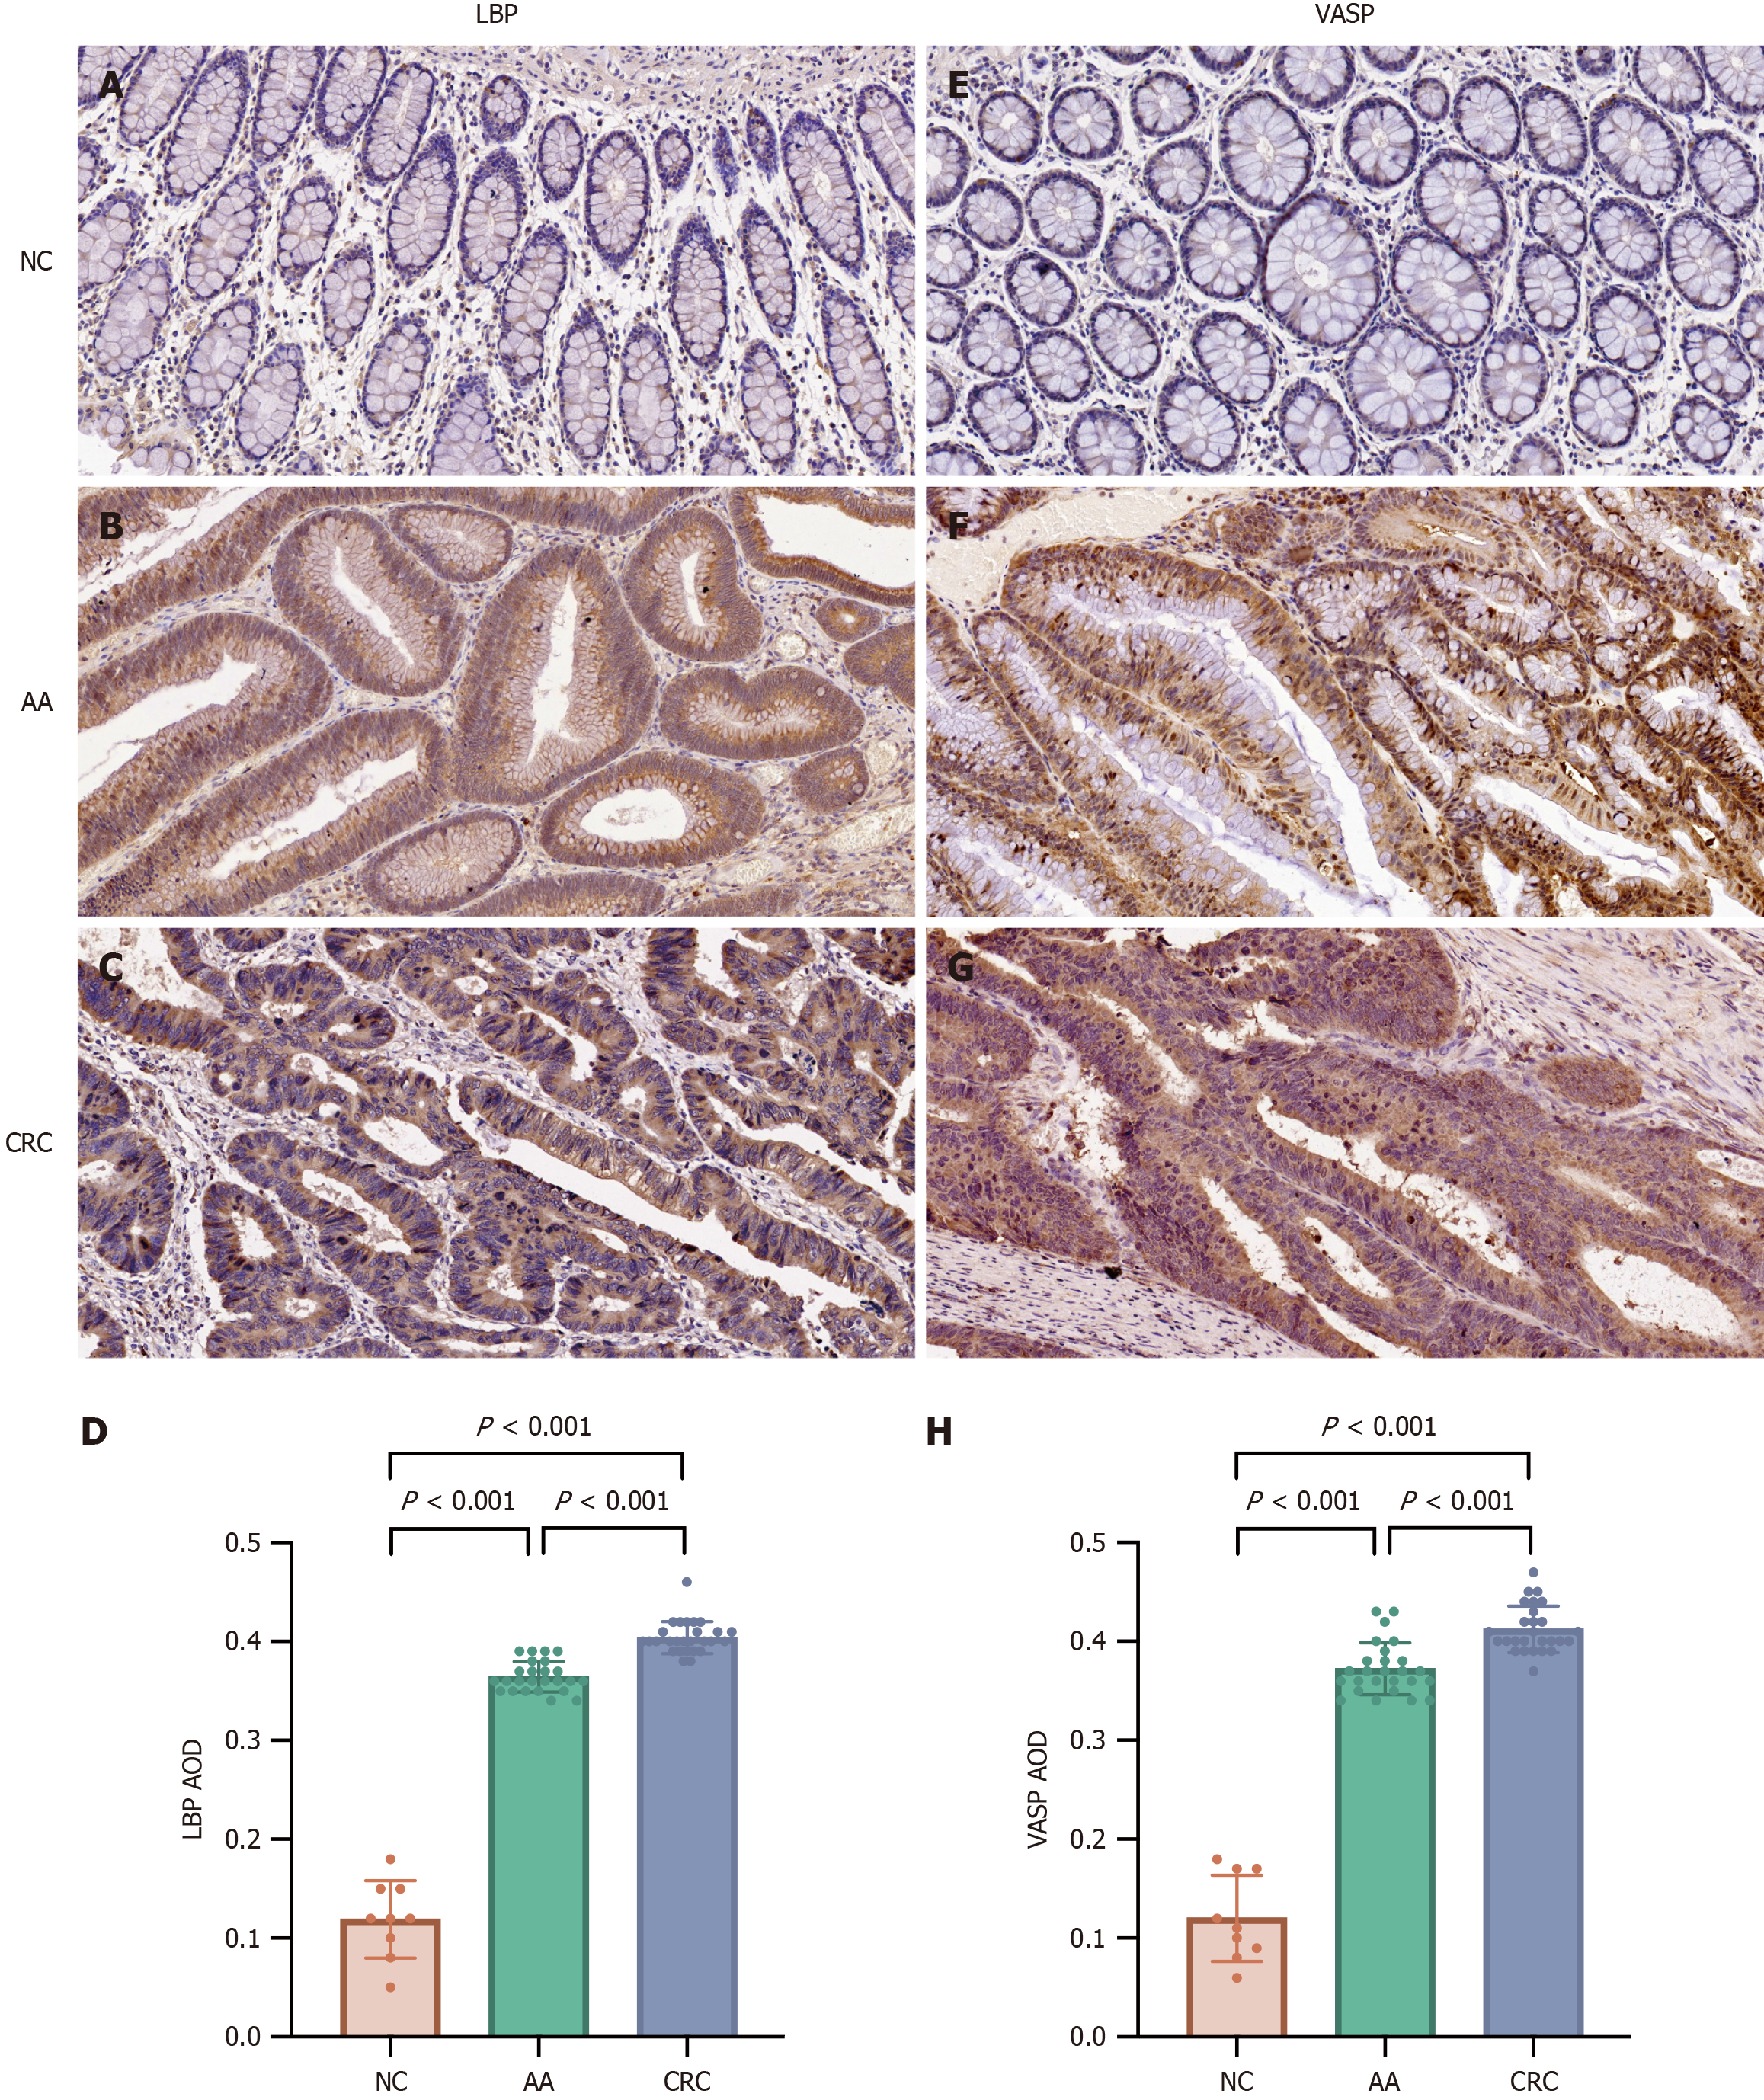
Figure 9 Immunohistochemical staining of LBP protein and VASP protein (200 ×).
A-C: LBP is not expressed in normal colon tissues, while highly expressed in advanced adenoma (AA) tissues and colorectal cancer (CRC) tissues; D: Expression levels of LBP protein among the three groups; E-G: VASP is not expressed in normal colon tissues, while highly expressed in AA tissues and CRC tissues; H: Expression levels of VASP protein among the three groups. AA: Advanced adenoma; CRC: Colorectal cancer; AOD: Average optical density; NC: Normal control.
- Citation: Tan C, Qin G, Wang QQ, Li KM, Zhou YC, Yao SK. Comprehensive serum proteomics profiles and potential protein biomarkers for the early detection of advanced adenoma and colorectal cancer. World J Gastrointest Oncol 2024; 16(7): 2971-2987
- URL: https://www.wjgnet.com/1948-5204/full/v16/i7/2971.htm
- DOI: https://dx.doi.org/10.4251/wjgo.v16.i7.2971


