Copyright
©The Author(s) 2024.
World J Gastrointest Oncol. Jun 15, 2024; 16(6): 2793-2803
Published online Jun 15, 2024. doi: 10.4251/wjgo.v16.i6.2793
Published online Jun 15, 2024. doi: 10.4251/wjgo.v16.i6.2793
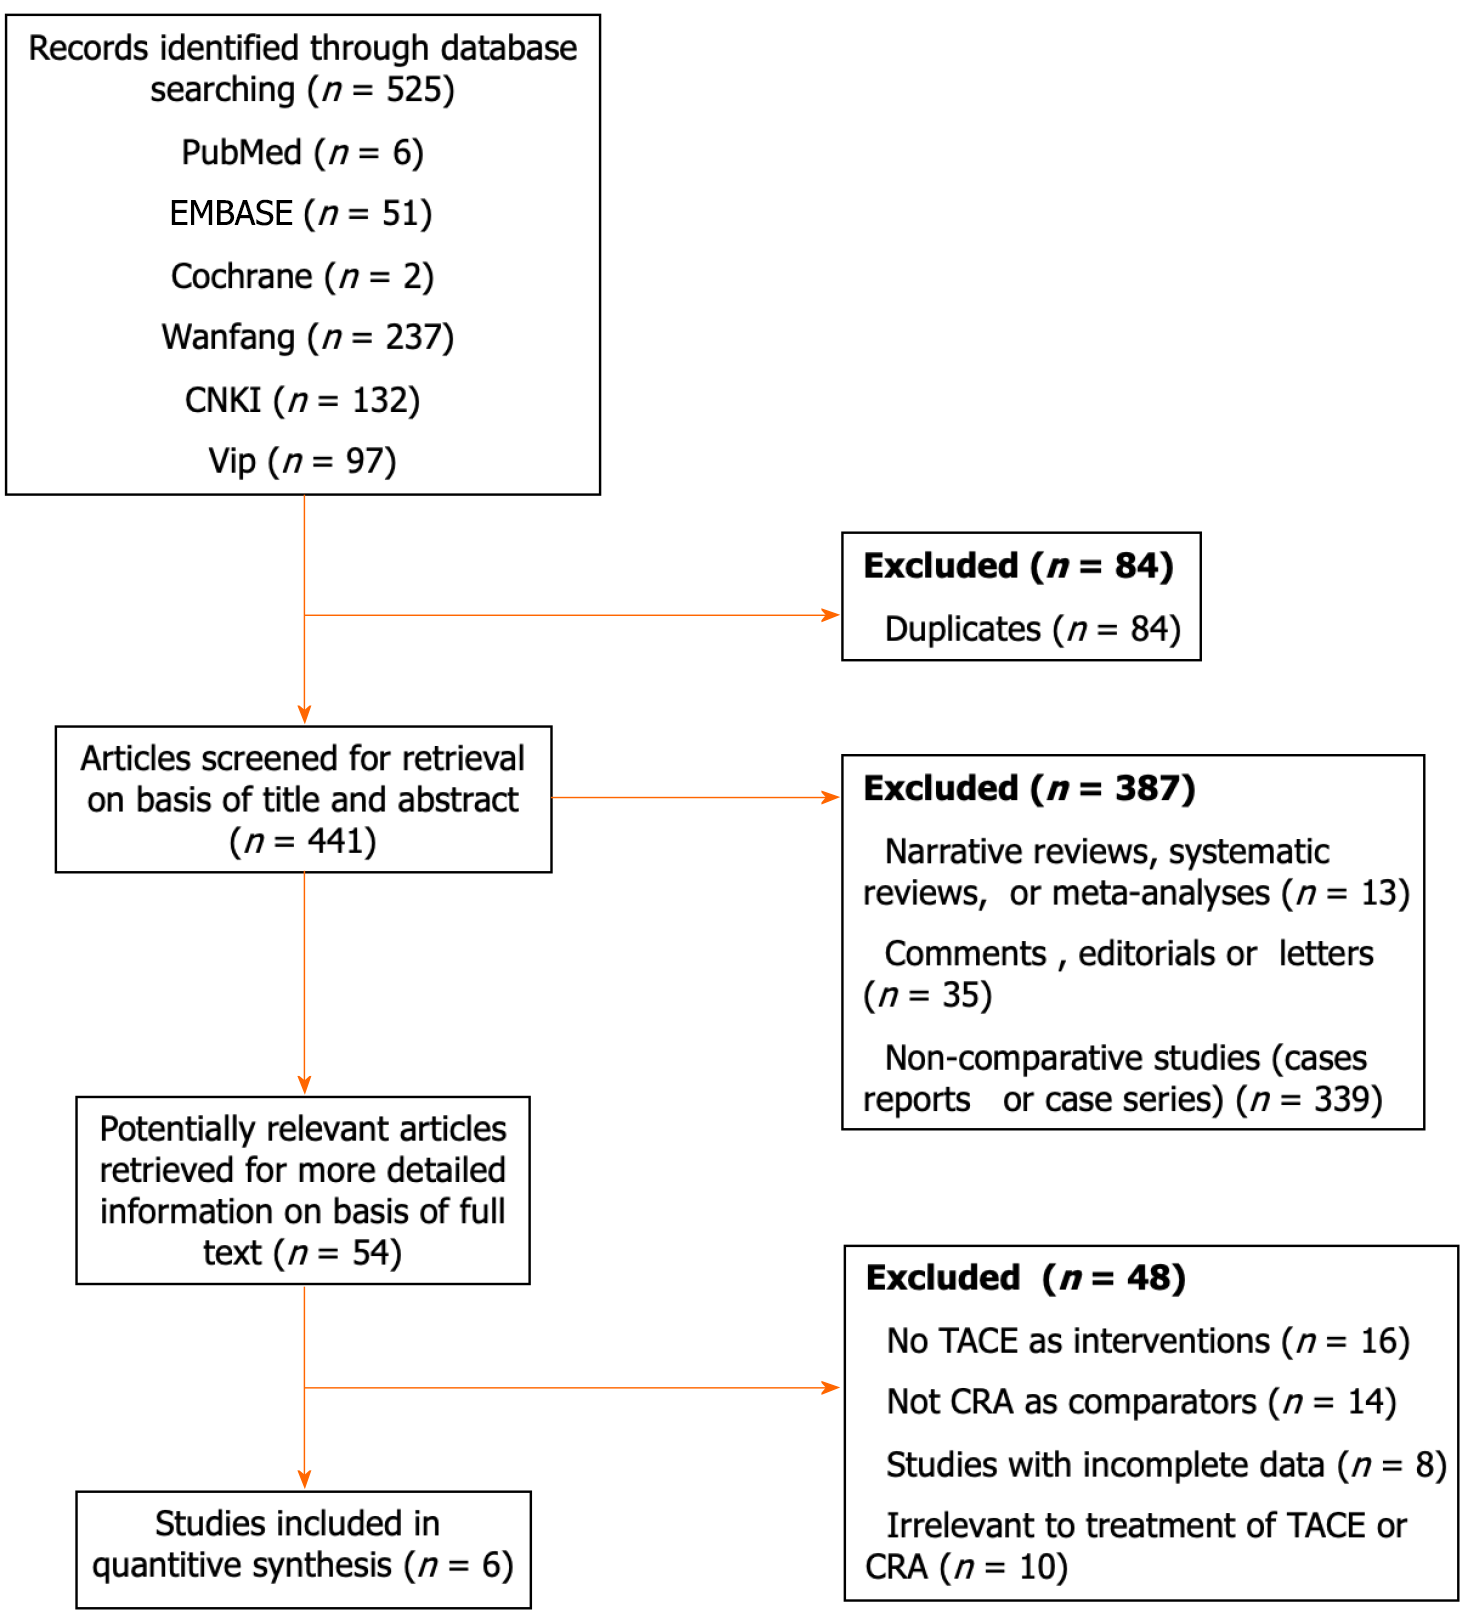
Figure 1 Flowchart of study inclusion.
TACE: Transarterial chemoembolization; CRA: Cryoablation.
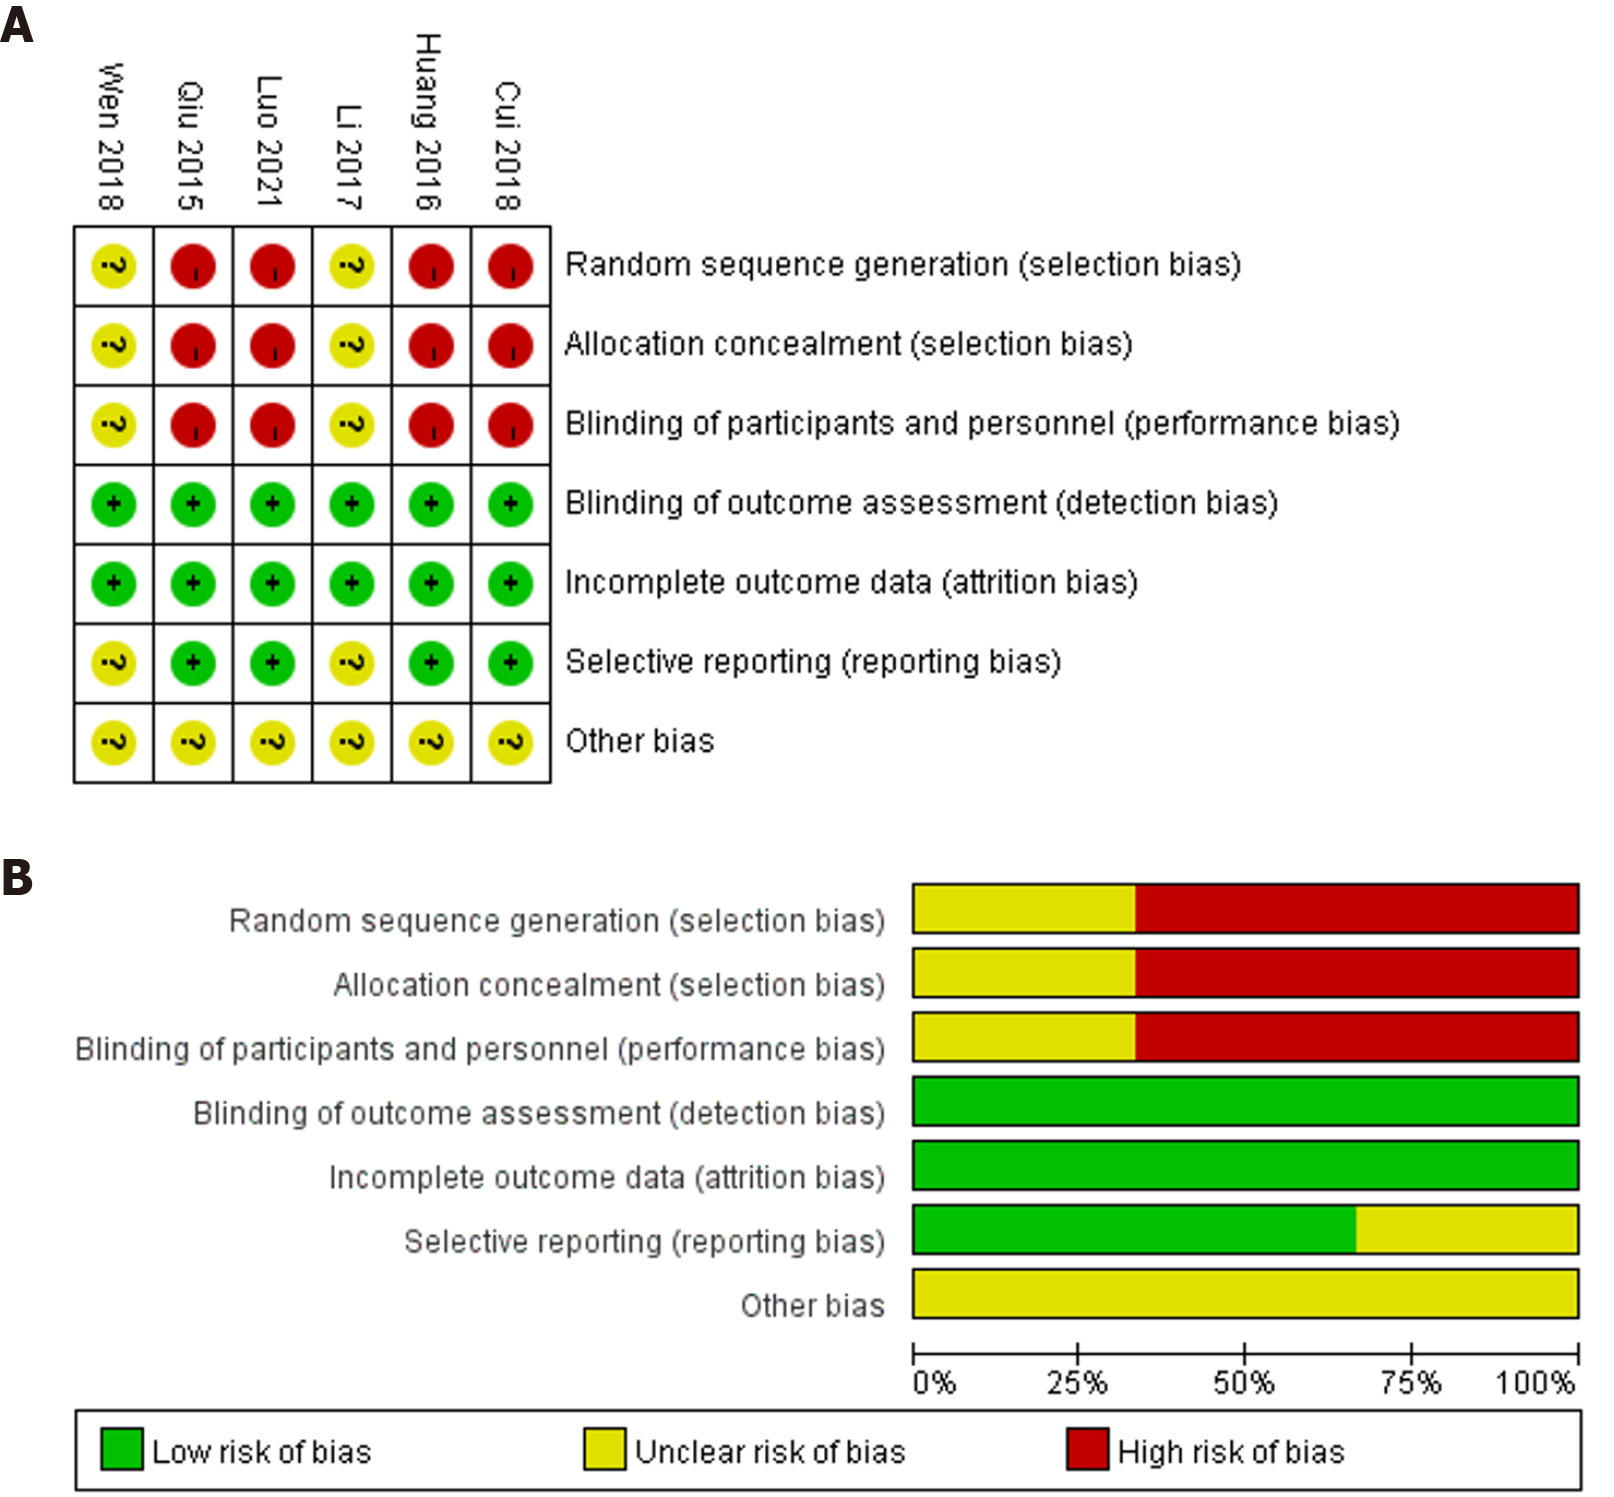
Figure 2 Risk of bias summary and bias graph of included studies.
A: Risk of bias summary of included studies; B: Risk of bias graph of included studies.
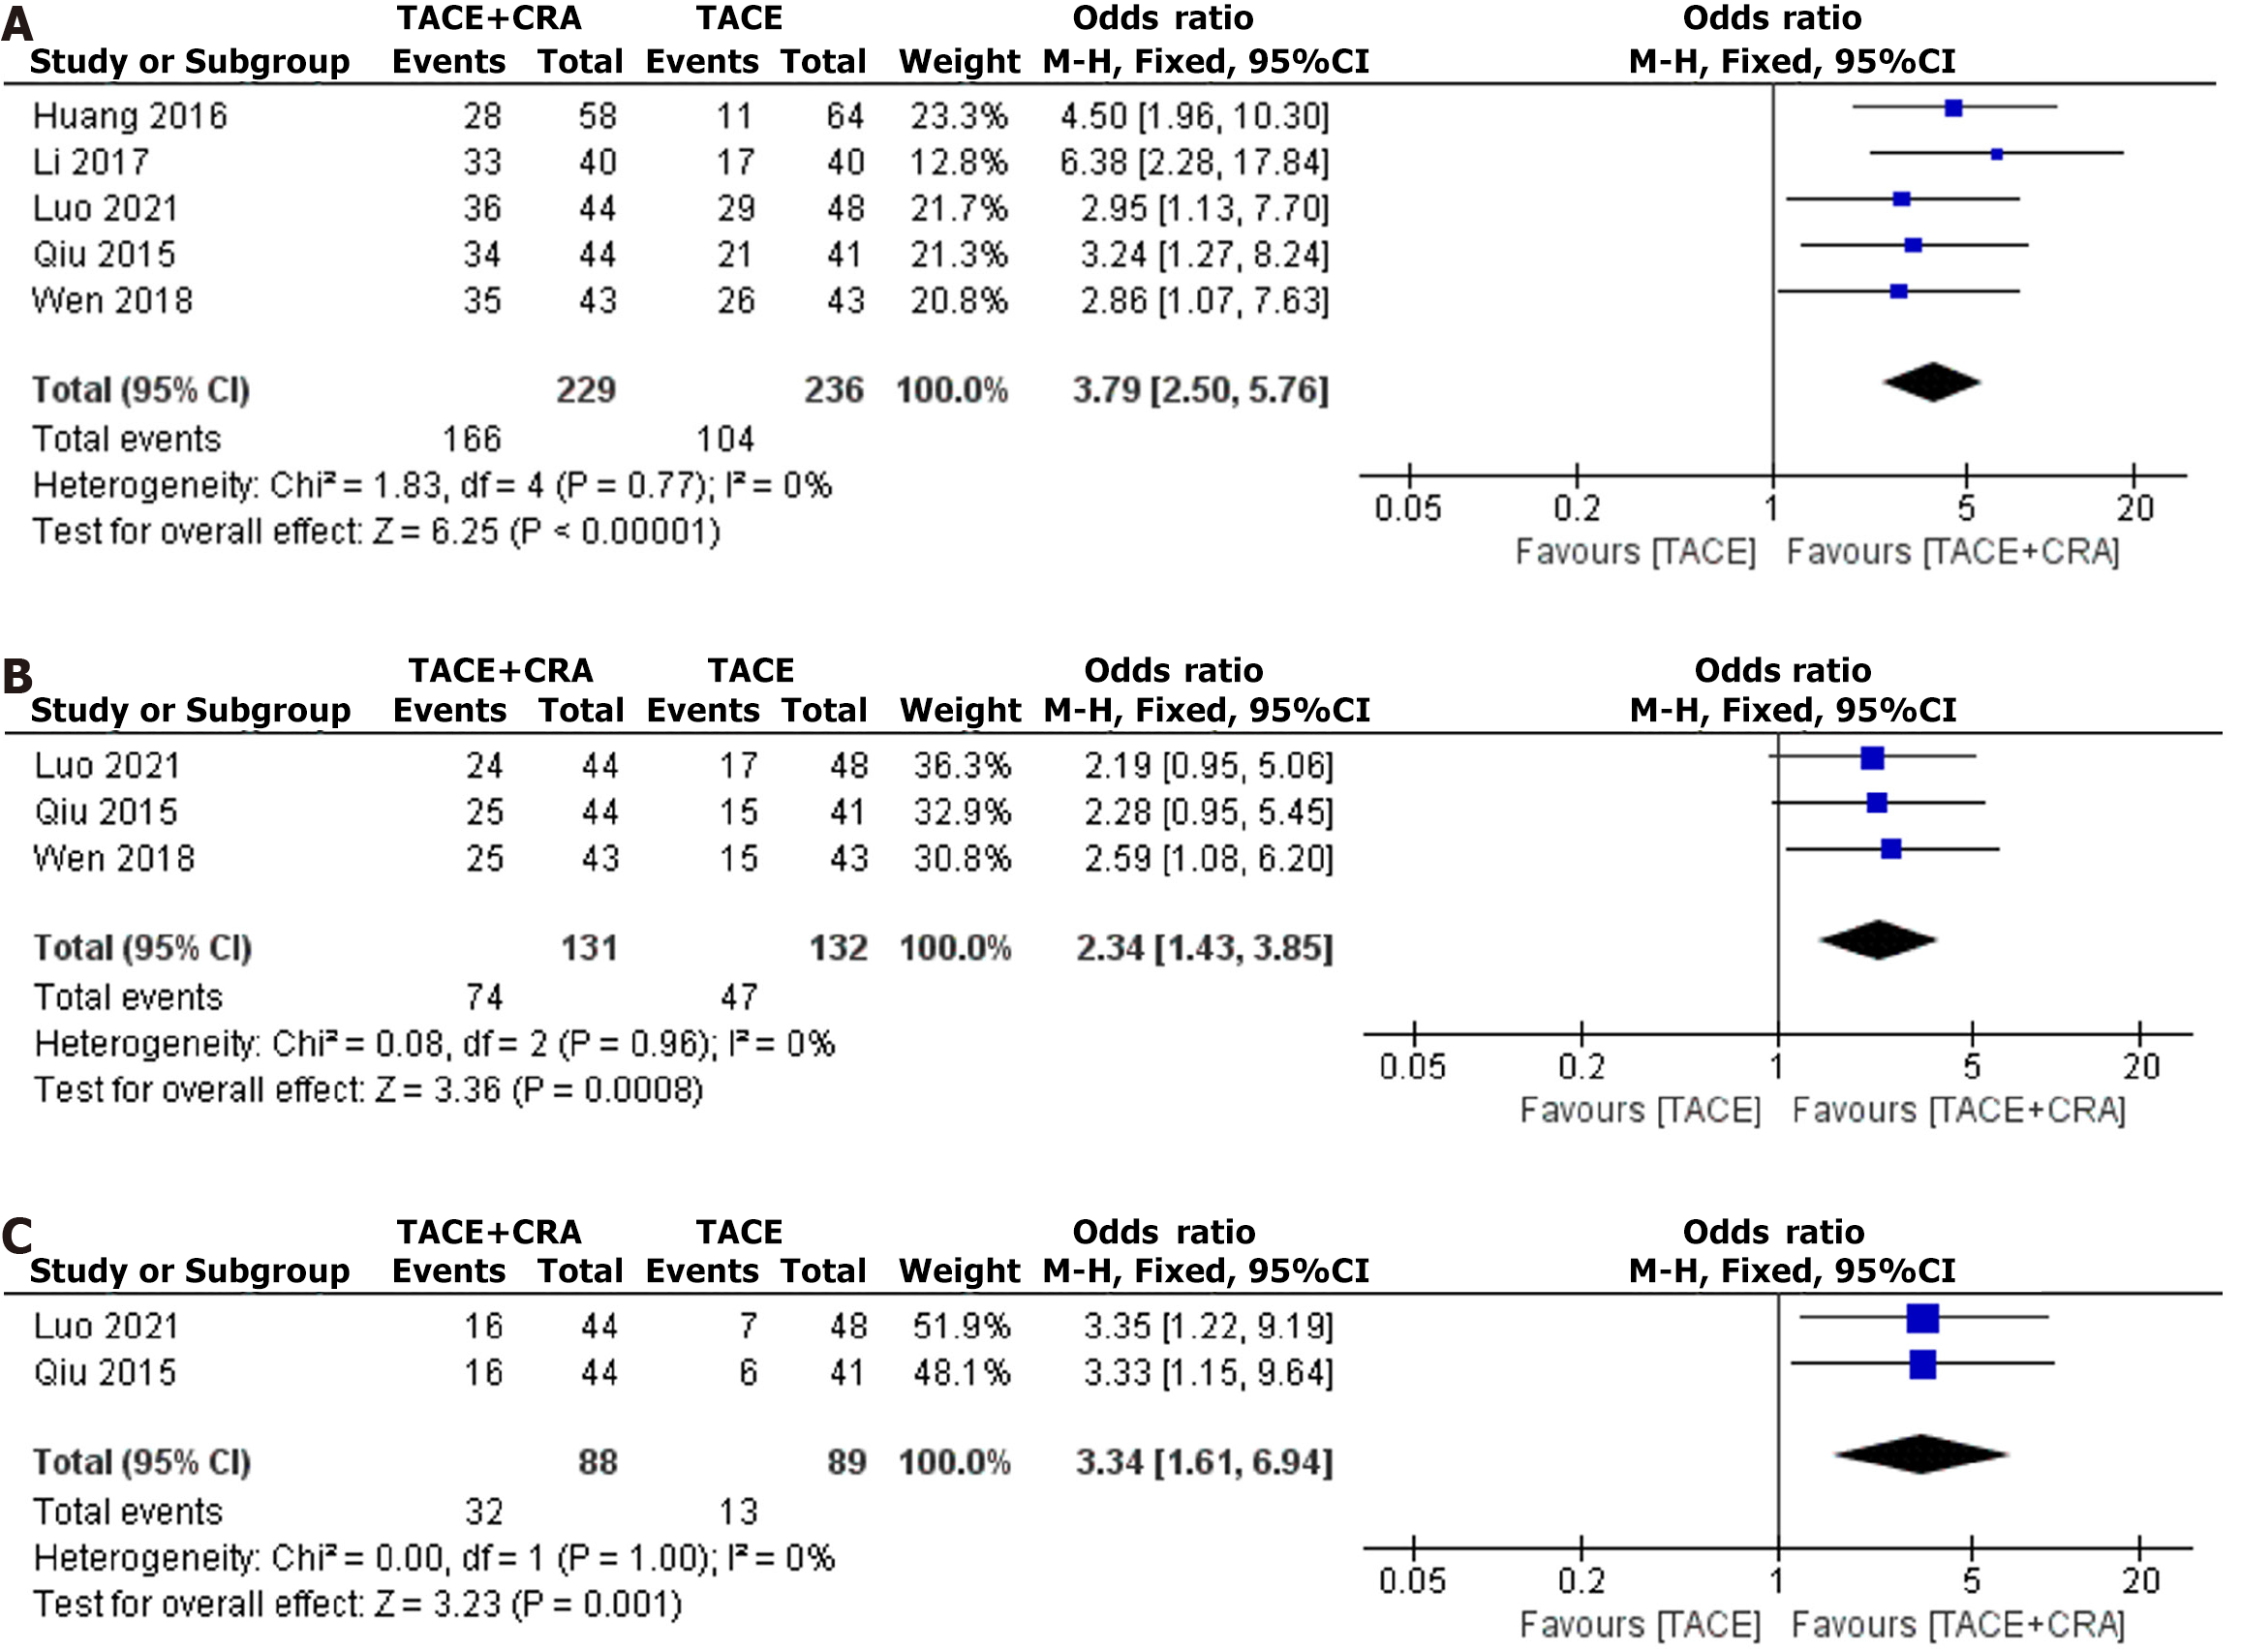
Figure 3 1-, 2-, and 3-year survival.
A: 1-year survival; B: 2-year survival; C: 3-year survival. TACE: Transarterial chemoembolization; CRA: Cryoablation; CI: Confidence interval.
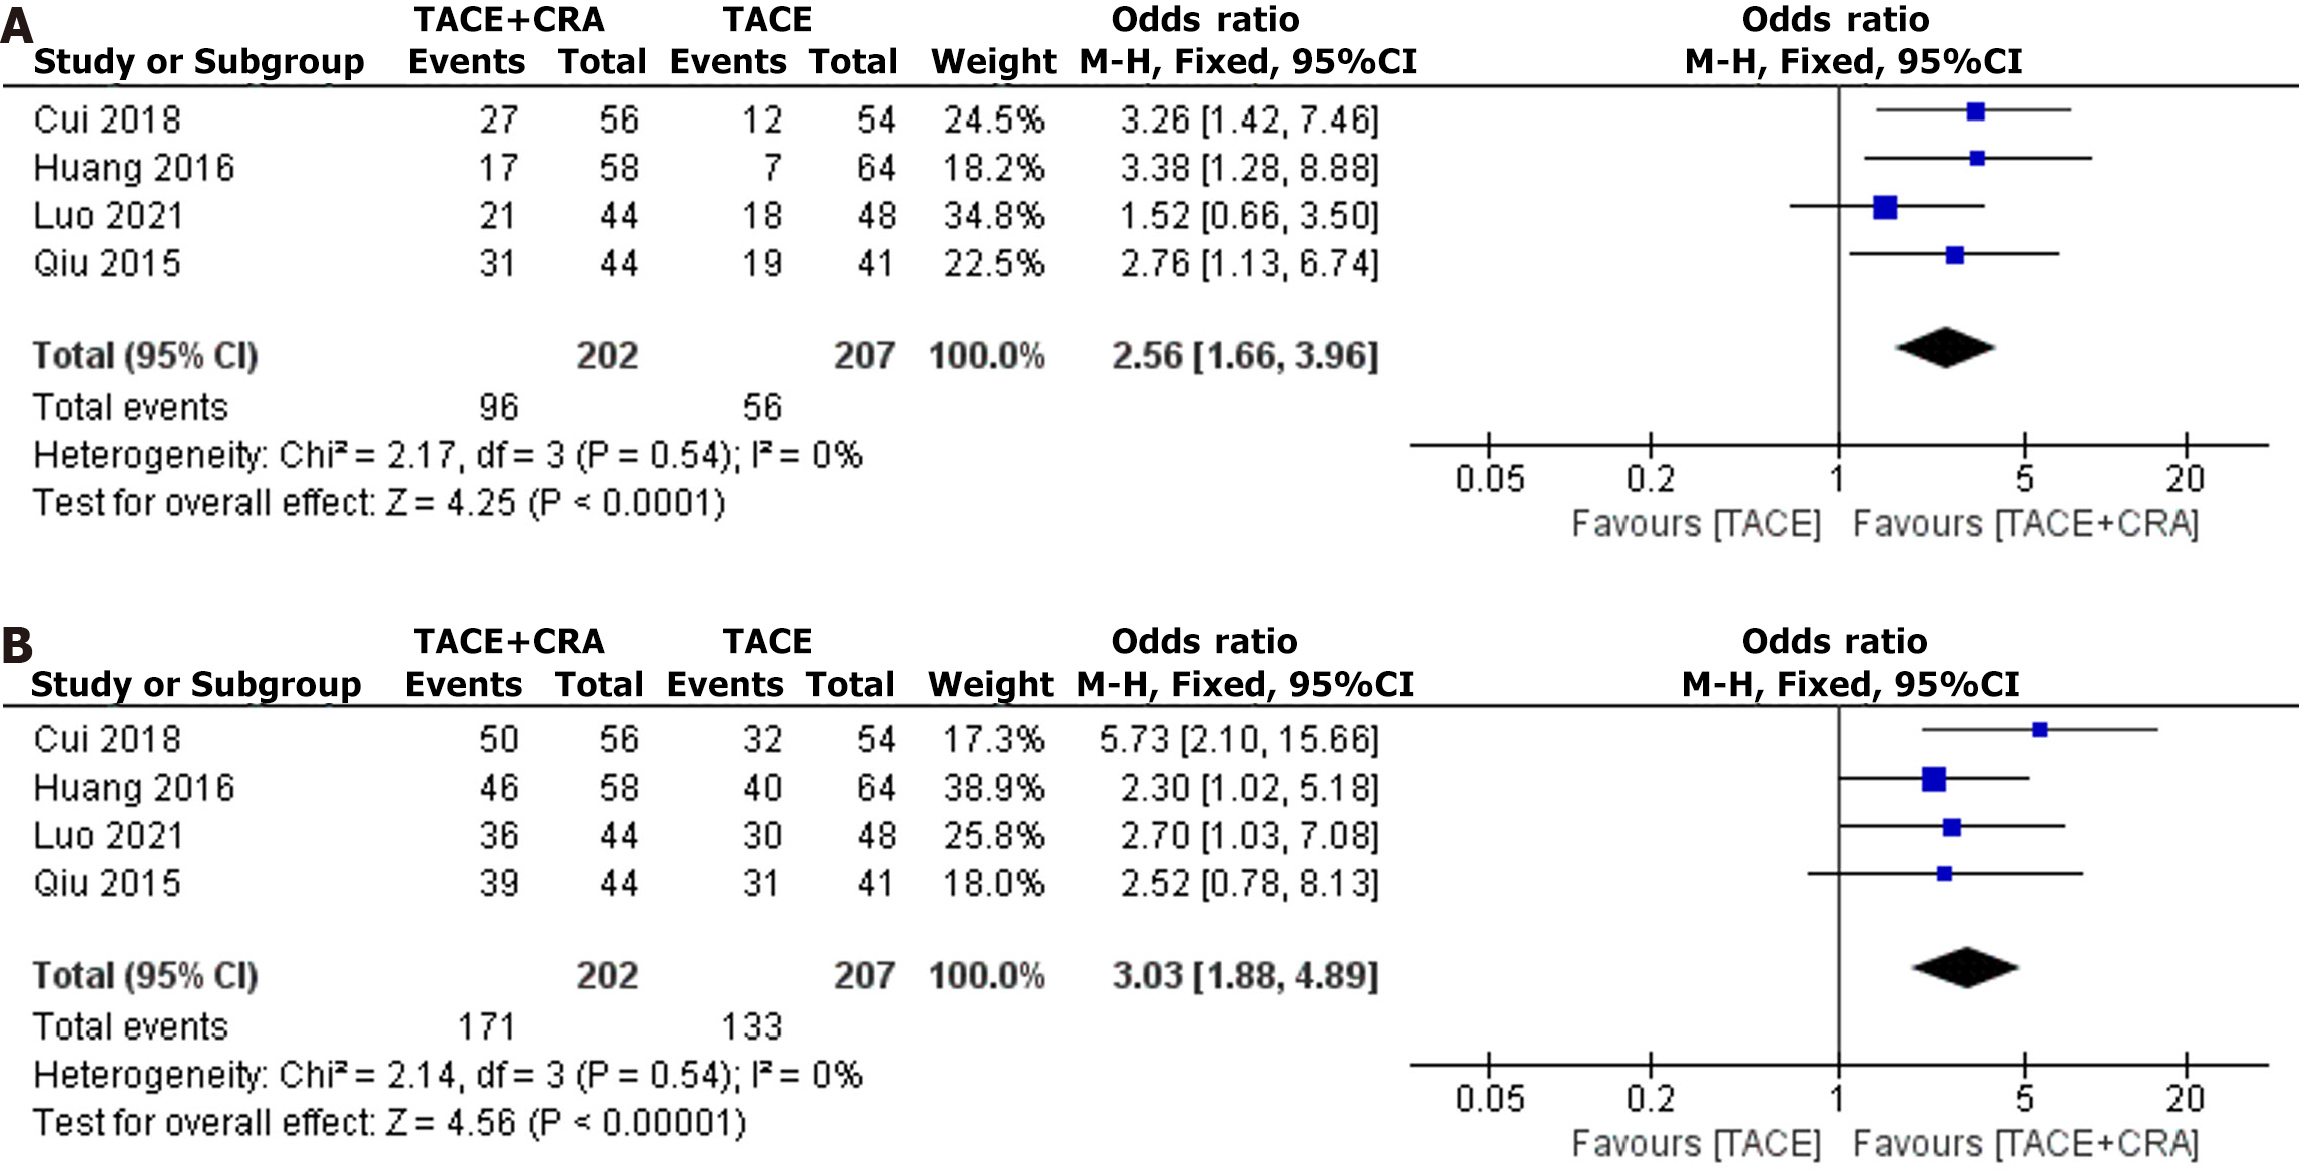
Figure 4 Objective response rate and disease control rate.
A: Objective response rate; B: Disease control rate. TACE: Transarterial chemoembolization; CRA: Cryoablation; CI: Confidence interval.
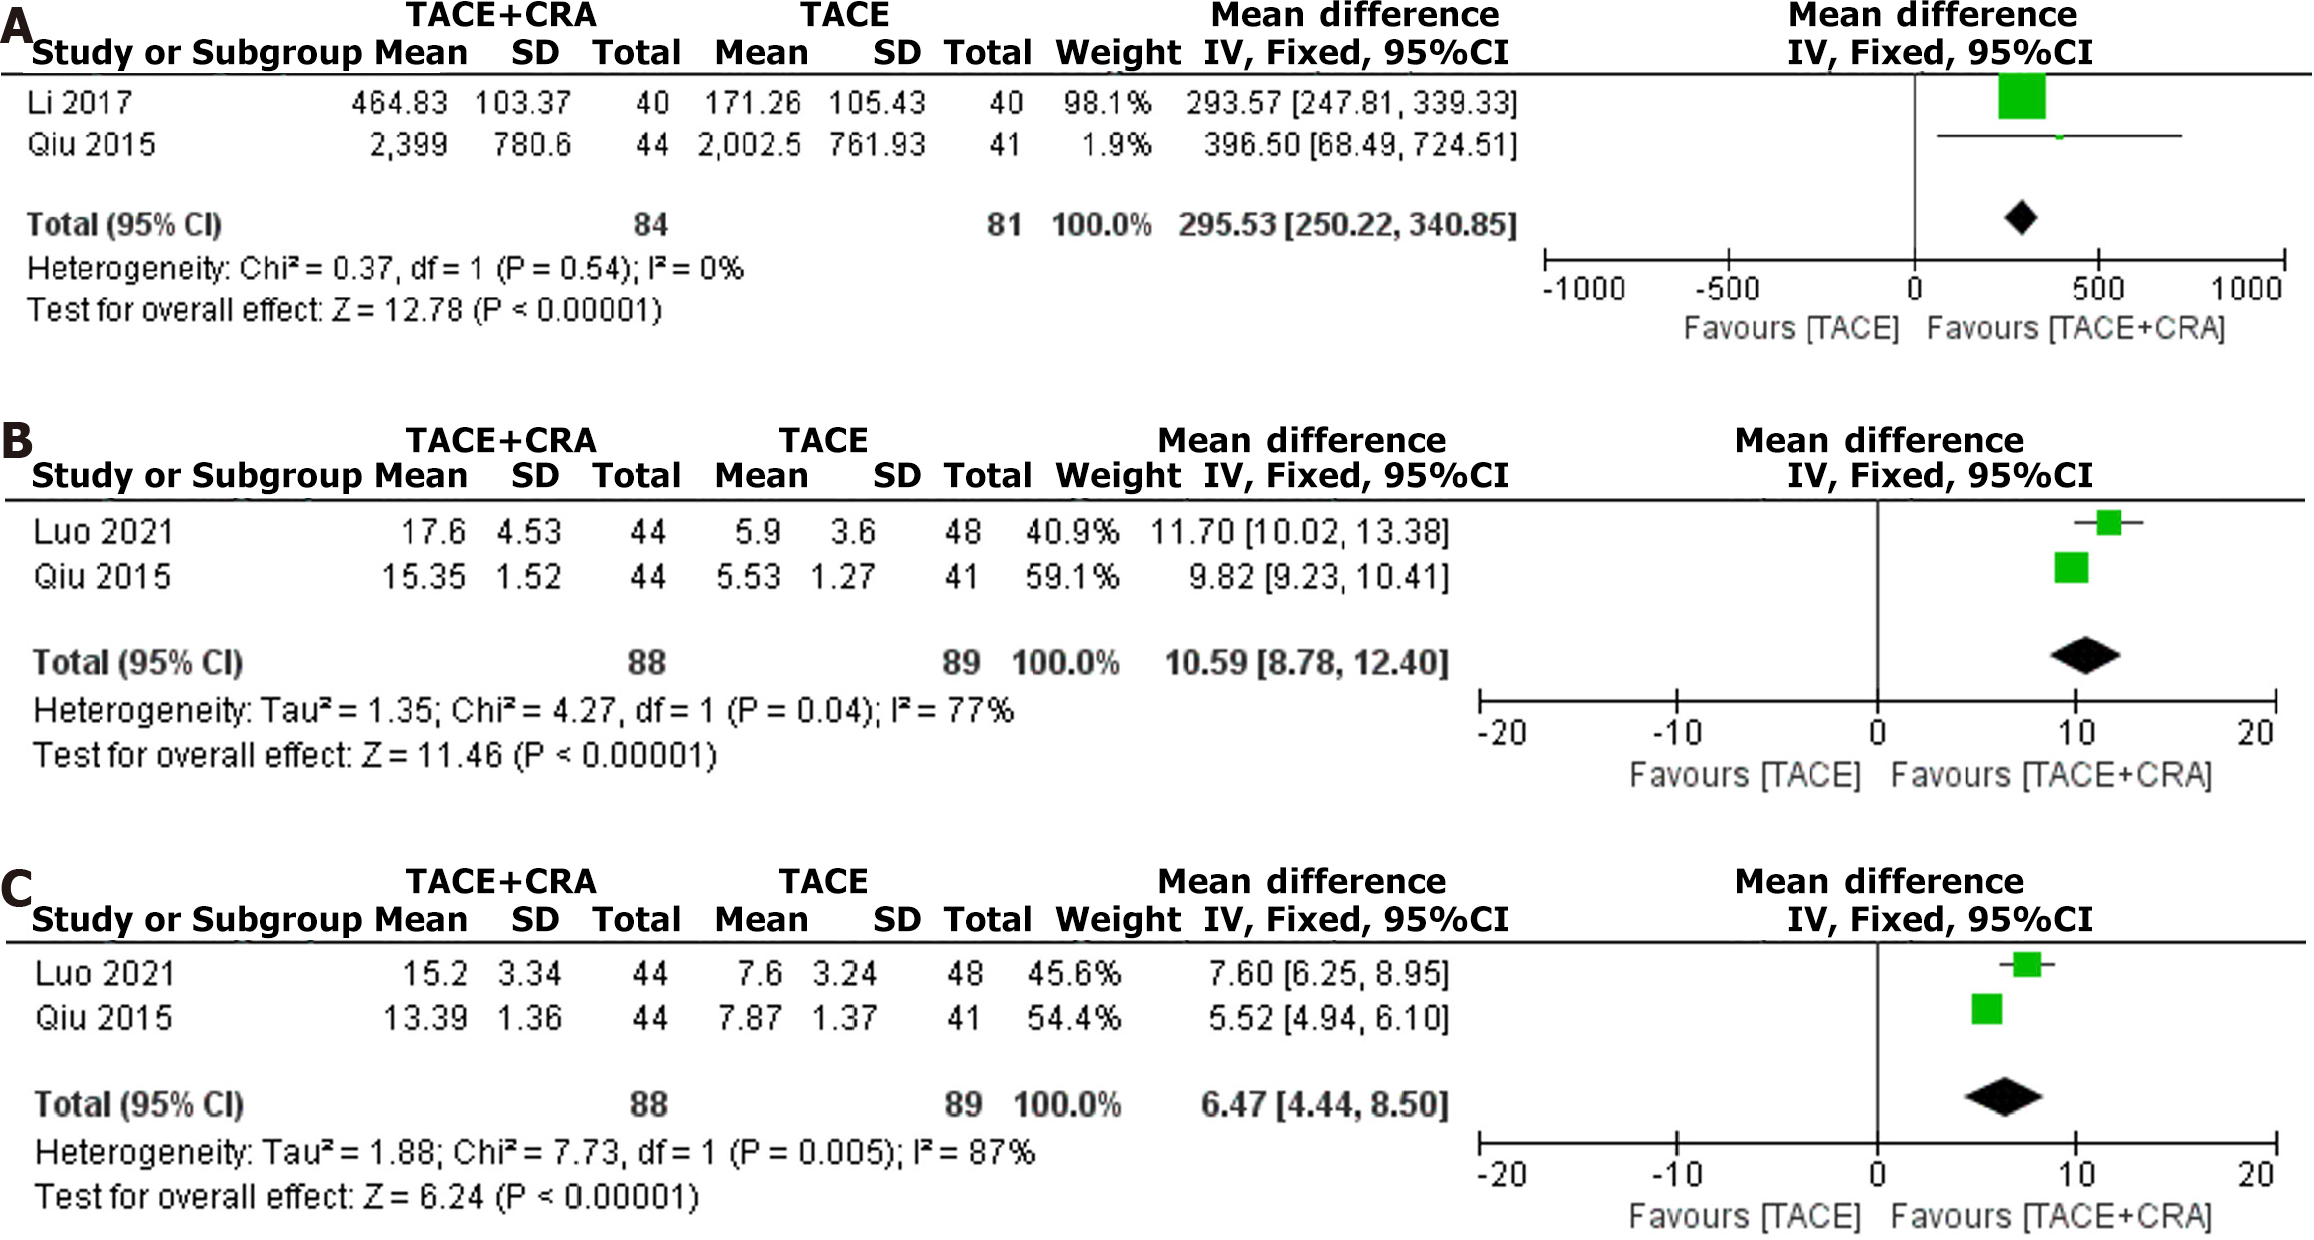
Figure 5 Postoperative alpha-fetoprotein, CD4+, and CD8+ level.
A: Postoperative alpha-fetoprotein level; B: Postoperative CD4+ level; C: Postoperative CD8+ level. TACE: Transarterial chemoembolization; CRA: Cryoablation; CI: Confidence interval.
Figure 6 Complication rate.
TACE: Transarterial chemoembolization; CRA: Cryoablation; CI: Confidence interval.
- Citation: Cheng JF, Sun QL, Tang L, Xu XJ, Huang XZ. Meta-analysis of transarterial chemoembolization combined with cryoablation vs transarterial chemoembolization alone for ≥ 5 cm hepatocellular carcinoma. World J Gastrointest Oncol 2024; 16(6): 2793-2803
- URL: https://www.wjgnet.com/1948-5204/full/v16/i6/2793.htm
- DOI: https://dx.doi.org/10.4251/wjgo.v16.i6.2793


