Copyright
©The Author(s) 2024.
World J Gastrointest Oncol. Jun 15, 2024; 16(6): 2742-2756
Published online Jun 15, 2024. doi: 10.4251/wjgo.v16.i6.2742
Published online Jun 15, 2024. doi: 10.4251/wjgo.v16.i6.2742
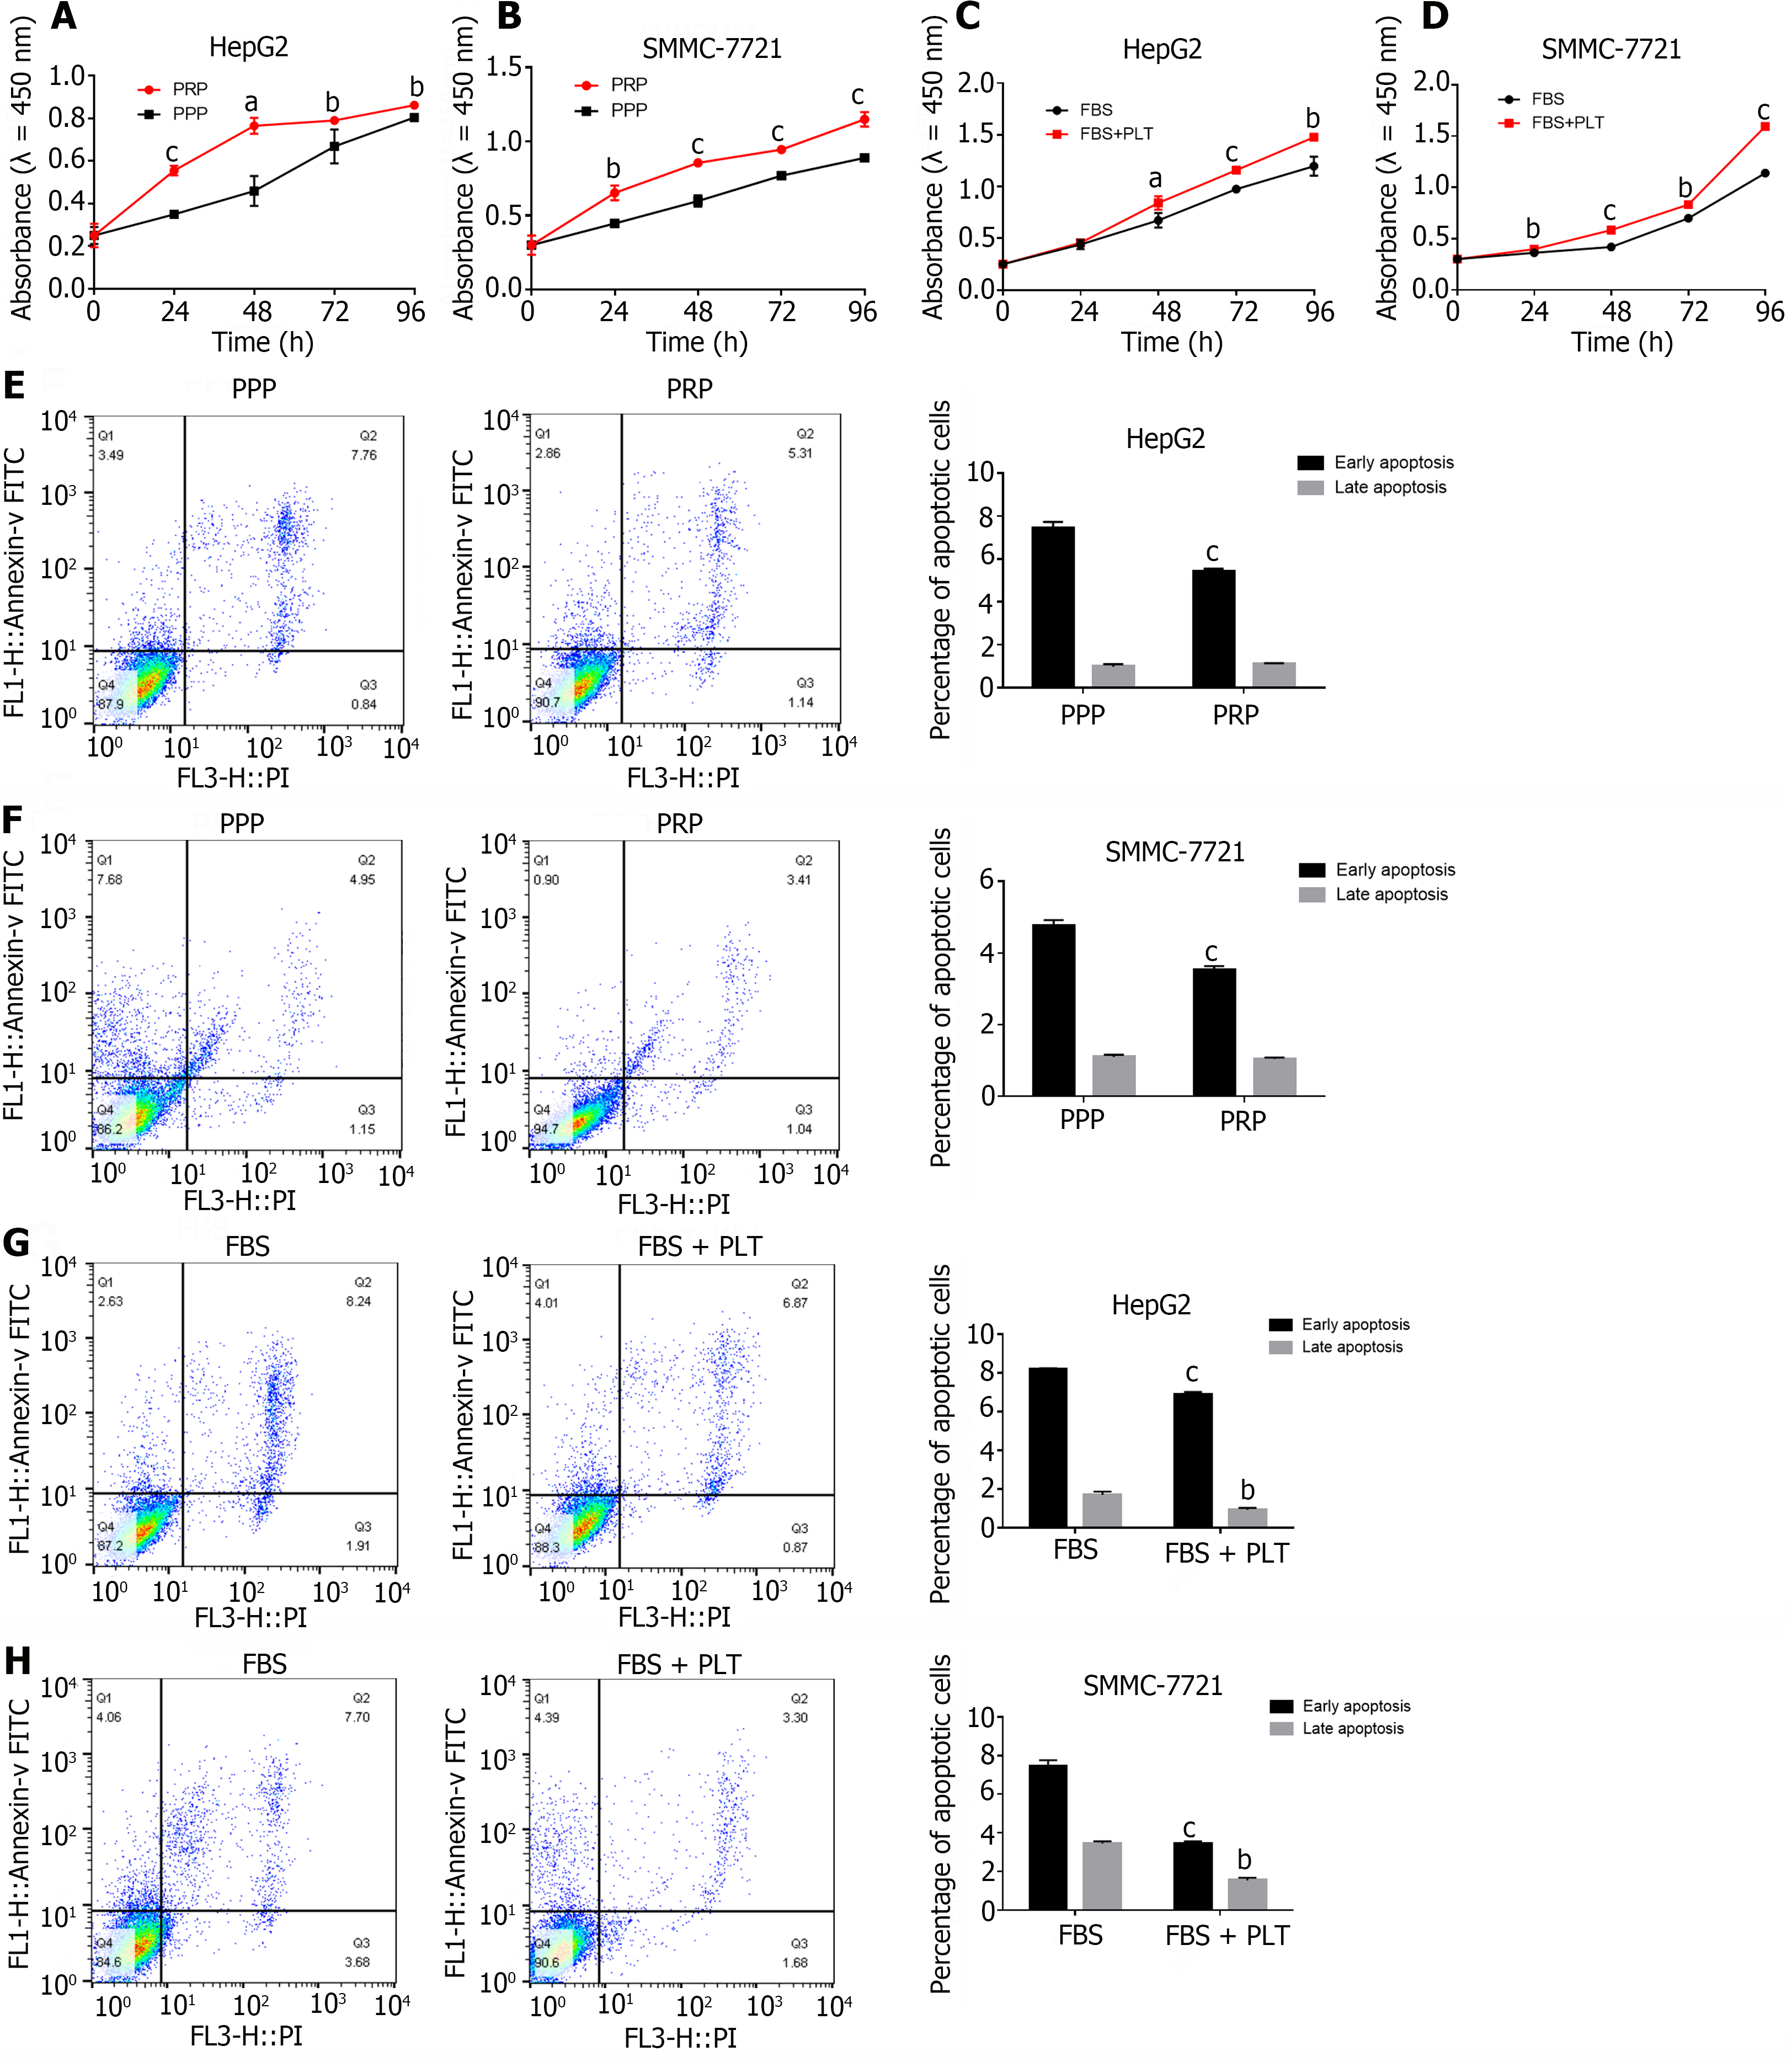
Figure 1 Platelets promote the growth of hepatocellular carcinoma cells.
A and B: CCK-8 assay was used to analyze the effects of platelet plasma (PPP) and platelet-rich plasma (PRP) on the proliferation of hepatocellular carcinoma (HCC) cells; C and D: CCK8 analysis of the effect of platelets (PLTs) on HCC cell proliferation; E and F: Flow cytometry was used to detect the effects of PPP and PRP on apoptosis in HCC cells, and the results of the statistical analysis of early apoptosis and late apoptosis are shown on the right; G and H: Flow cytometry was used to detect the effect of PLTs on HCC apoptosis, and the results of the statistical analysis of early apoptosis and late apoptosis are shown on the right. The figure shows the mean ± SD of the experimental results, with asterisks denoting significant differences between the two groups (aP < 0.05, bP < 0.01, cP < 0.001). Annexin V-FITC: Fluorescein isothiocyanate-labeled Annexin V; PI: Propidium iodide; PPP: Platelet plasma; PRP: Platelet-rich plasma; FBS: Fetal bovine serum; PLT: Platelets.
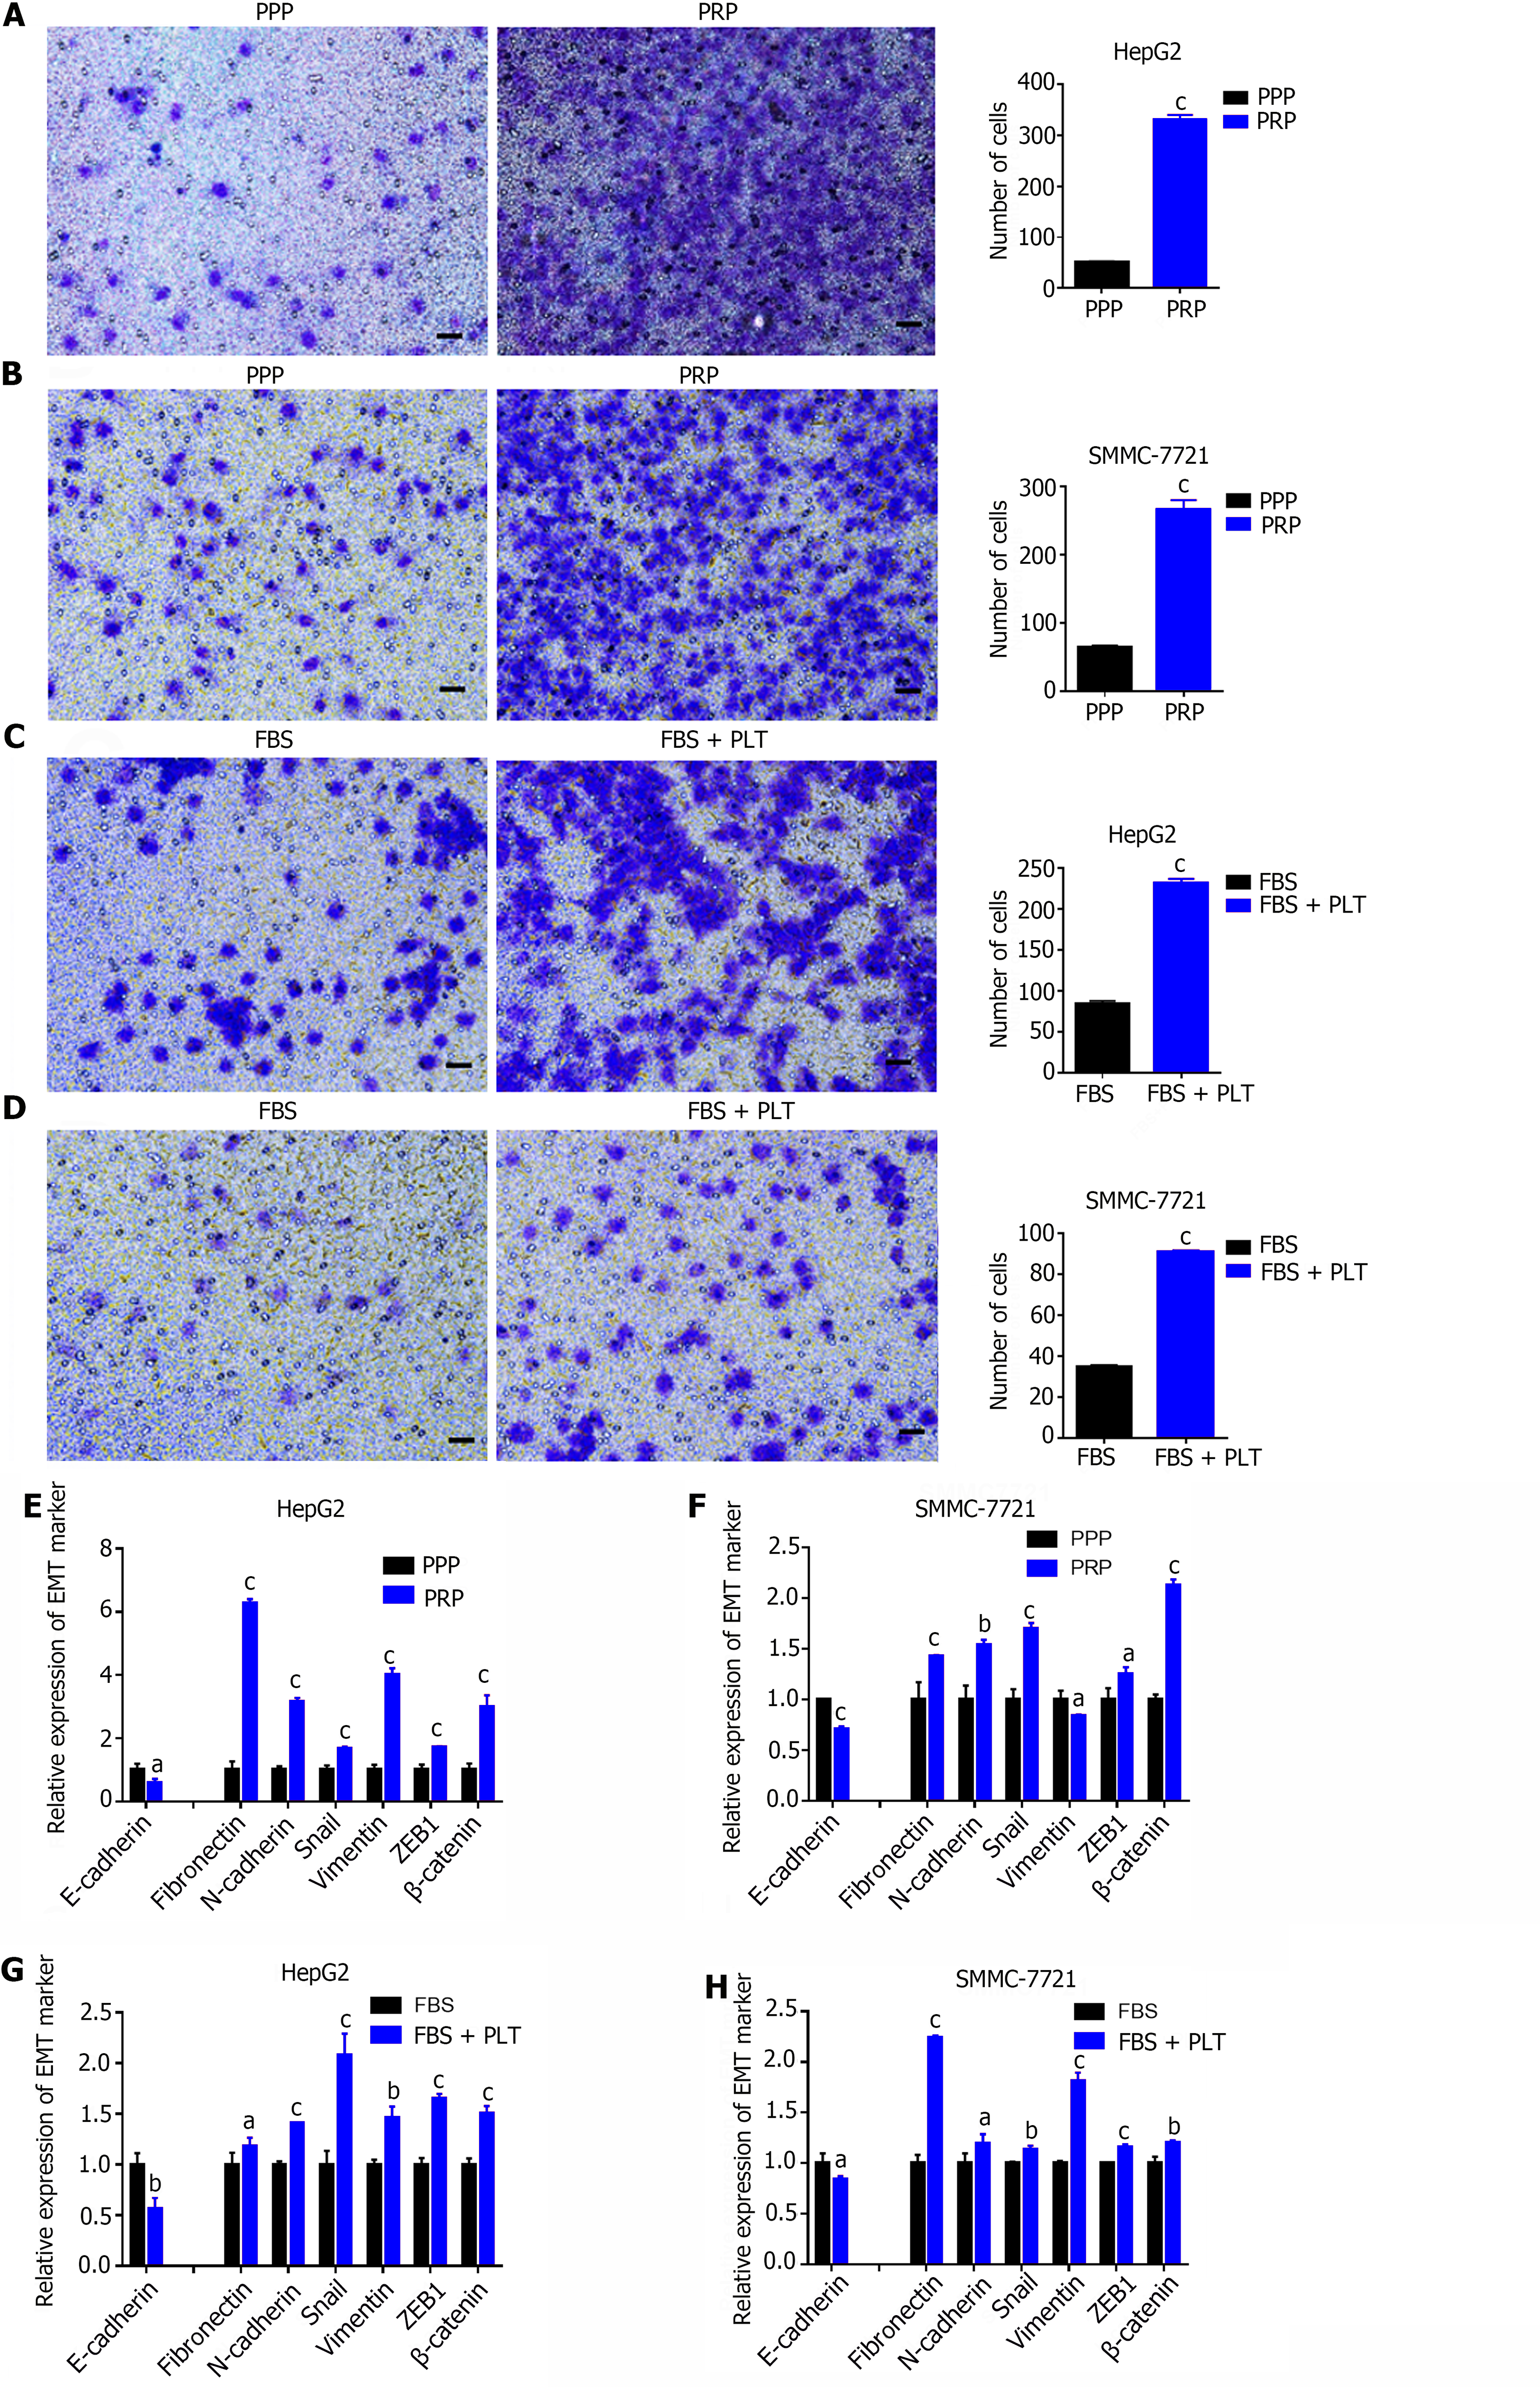
Figure 2 Platelets promote hepatocellular carcinoma cell invasion and epithelial-mesenchymal transition.
A and B: Transwell assays were used to detect the effects of platelet plasma (PPP) and platelet-rich plasma (PRP) on hepatocellular carcinoma (HCC) cell invasion, and the statistical results are shown on the right. 200 × magnification, Scale bar: 200 μm; C and D: Transwell assays were used to detect the effects of platelets (PLTs) on HCC cell invasion, and the statistical results are shown on the right. 200 × magnification, Scale bar: 200 μm; E and F: Real time polymerase chain reaction (RT-PCR) was used to detect the effects of PPP and PRP on the epithelial-mesenchymal transition (EMT) ability of HCC cells; G and H: RT-PCR was used to detect the effect of PLTs on the EMT ability of HCC cells. The figure shows the mean ± SD of the experimental results, with asterisks denoting significant differences between the two groups (aP < 0.05, bP < 0.01, cP < 0.001). PPP: Platelet plasma; PRP: Platelet-rich plasma; FBS: Fetal bovine serum; PLT: Platelets.
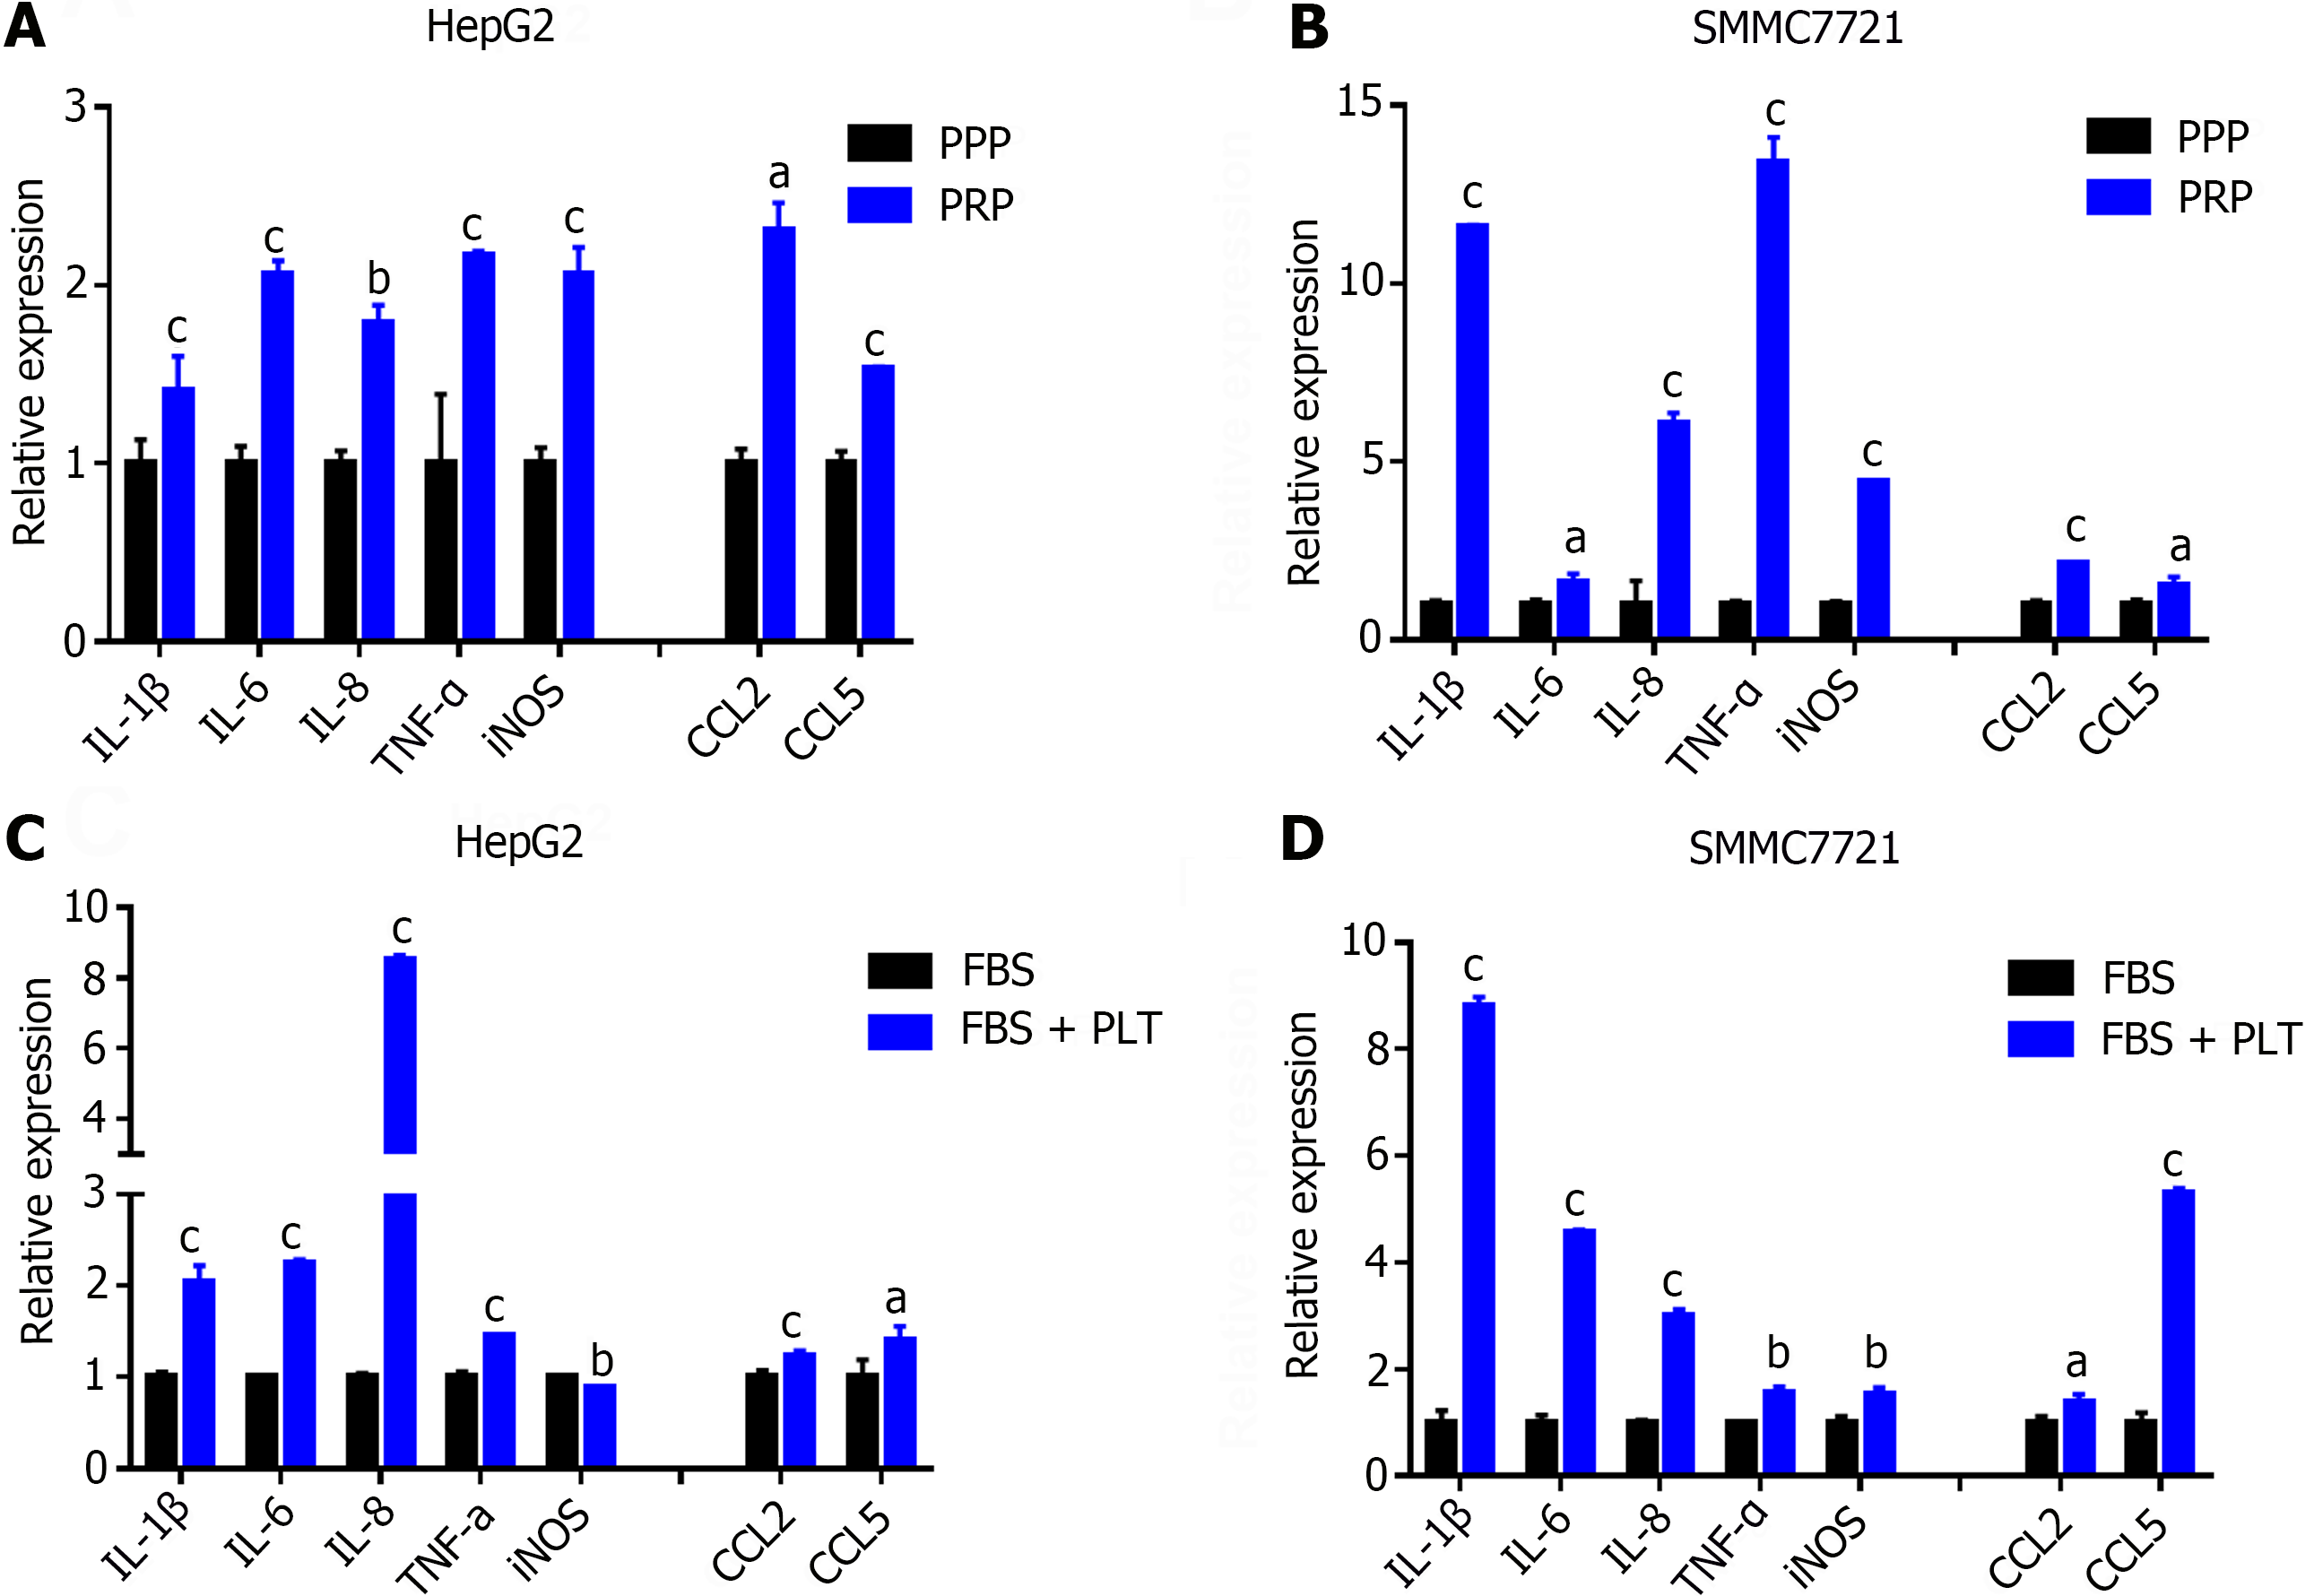
Figure 3 Platelets promote the formation of an inflammatory microenvironment in hepatocellular carcinoma.
A and B: Real time polymerase chain reaction (RT-PCR) was used to detect the effects of platelet plasma and platelet-rich plasma on the expression of inflammatory cytokines (IL-1β, IL-6, IL-8, TNF-α, and iNOS) and chemokines (CCL2, CCL5) in hepatocellular carcinoma (HCC) cells; C and D: RT-PCR was used to detect the effect of platelets (PLTs) on the expression of inflammatory cytokines (IL-1β, IL-6, IL-8, TNF-α, and iNOS) and chemokines (CCL2 and CCL5) in HCC cells. The figure shows the mean ± SD of the experimental results, with asterisks denoting significant differences between the two groups (aP < 0.05, bP < 0.01, cP < 0.001). PPP: Platelet plasma; PRP: Platelet-rich plasma; FBS: Fetal bovine serum; PLT: Platelets.
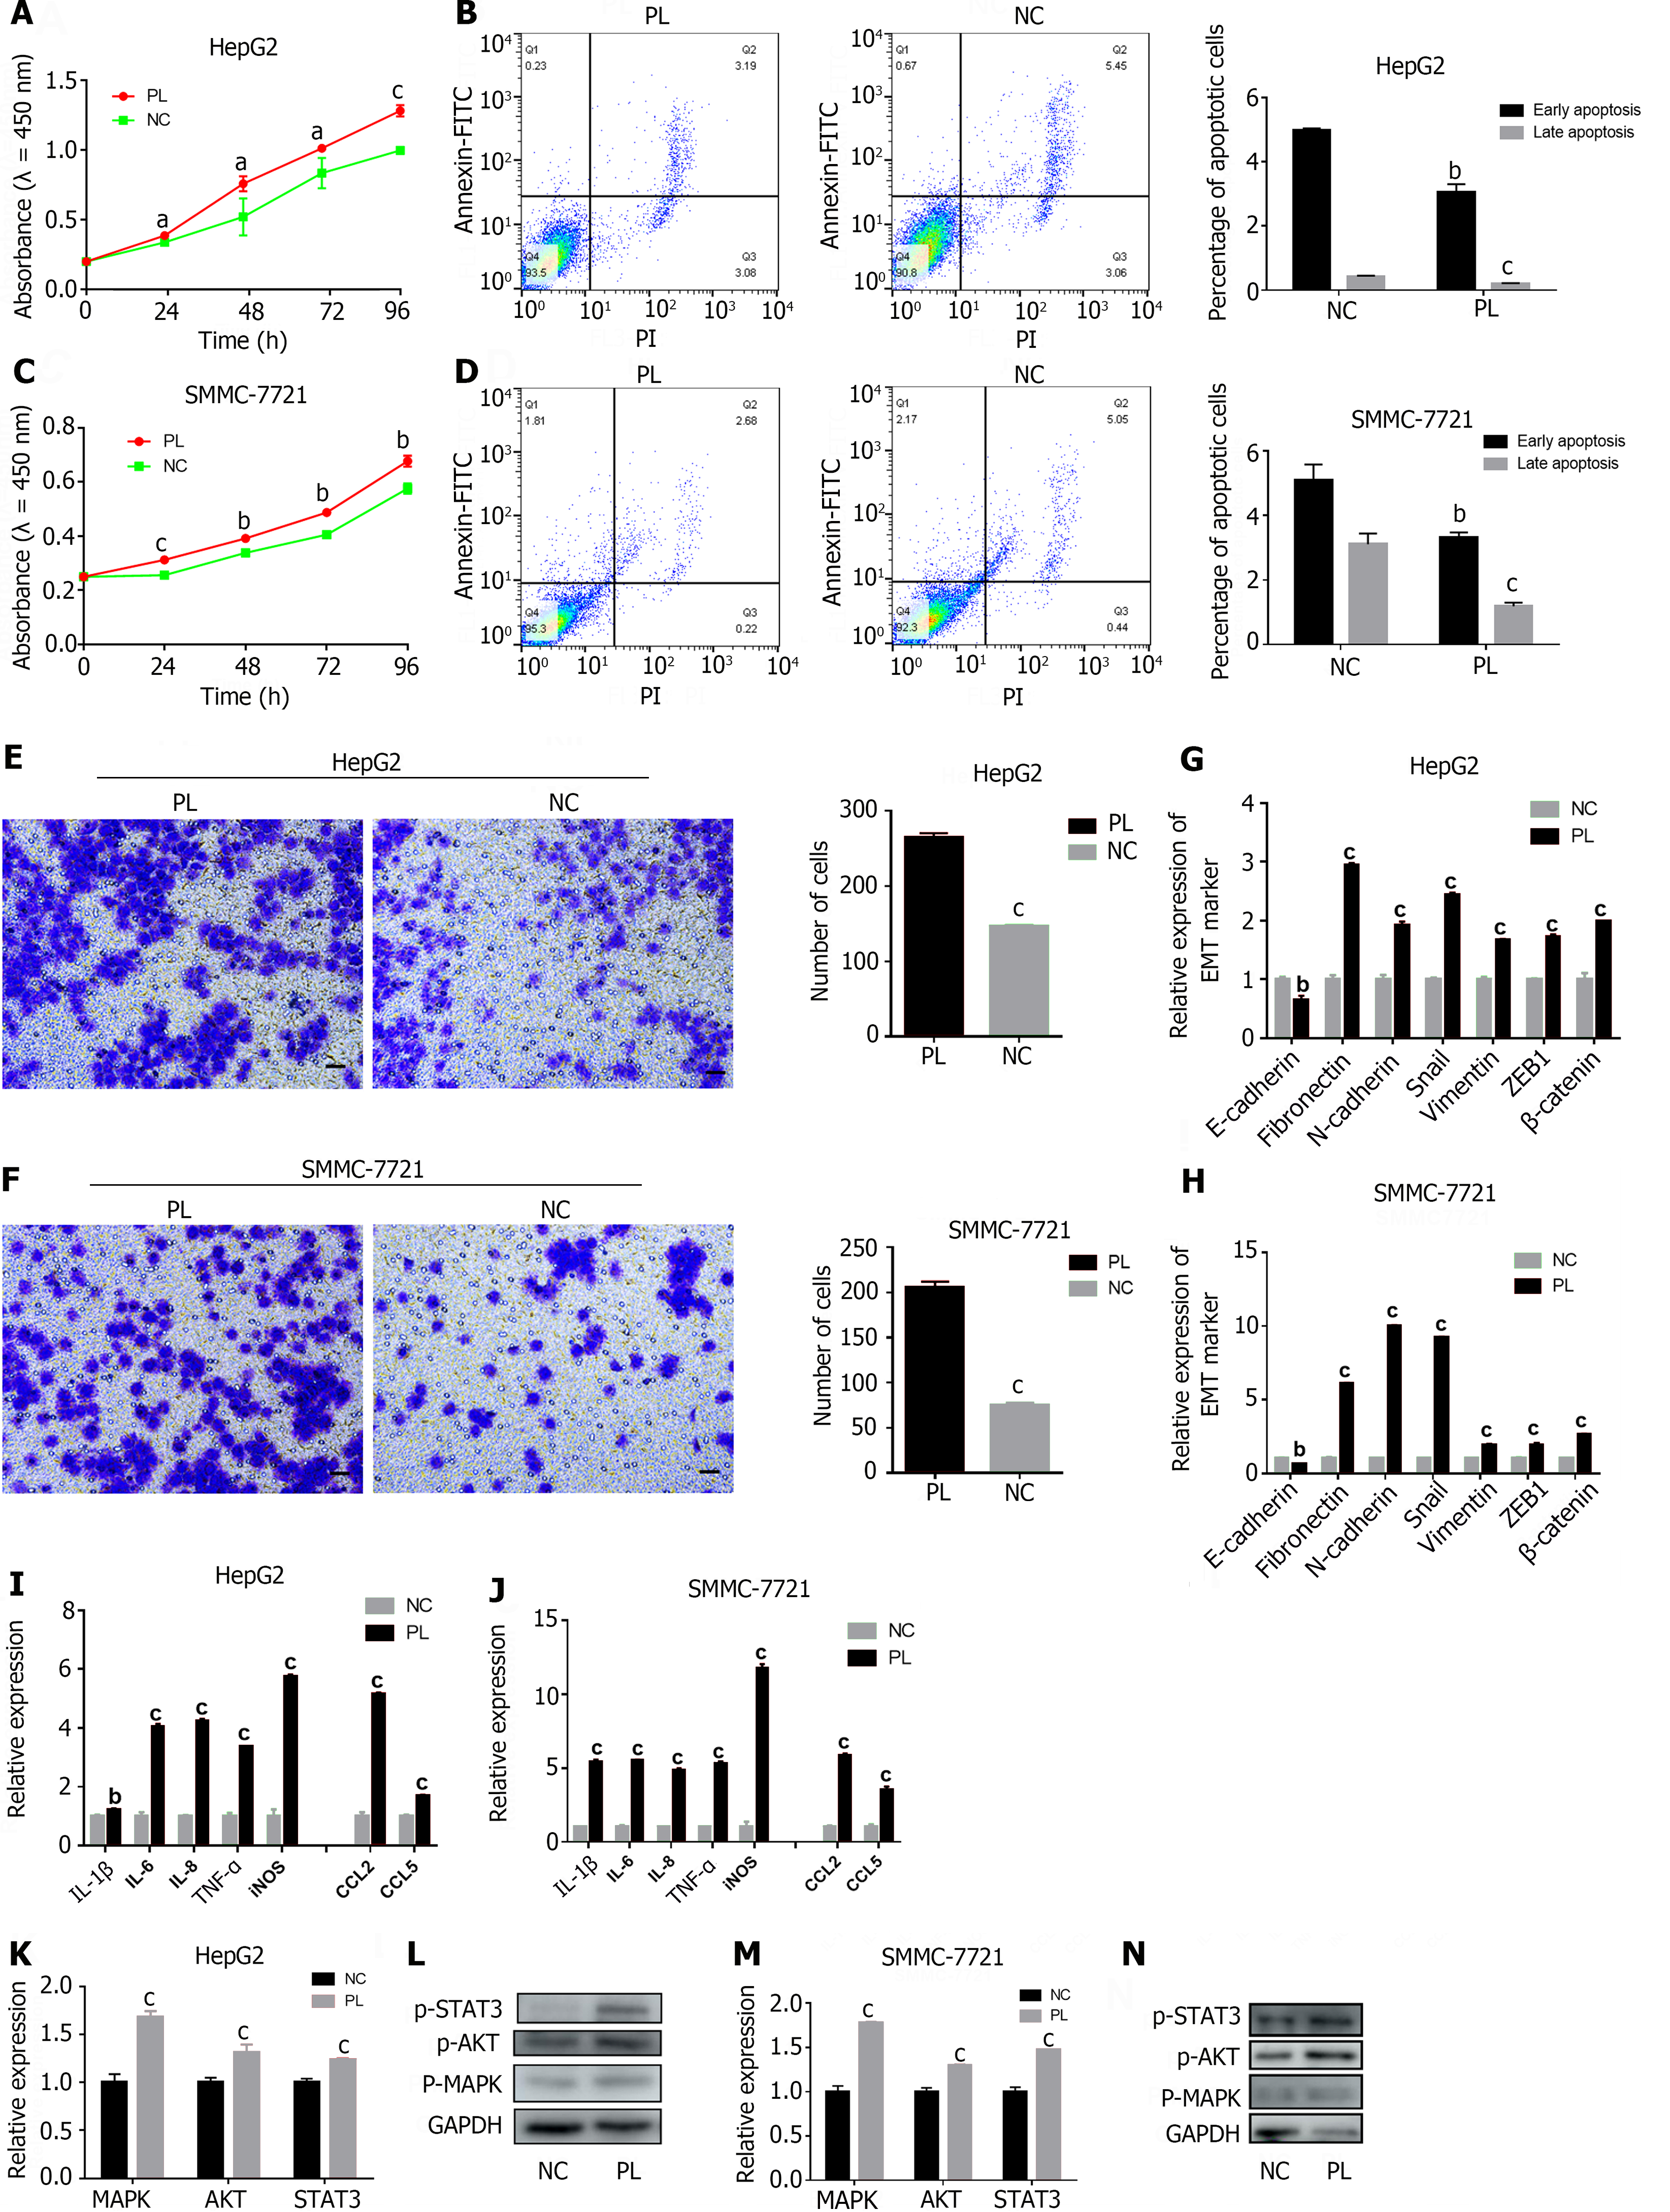
Figure 4 Activated platelets activate the MAPK/AKT/STAT3 signaling axis in hepatocellular carcinoma.
A and C: CCK-8 analysis was used to detect the effect of platelet lysis buffer (PL) on the proliferation of hepatocellular carcinoma (HCC) cells; B and D: The effect of PL on apoptosis detected by flow cytometry is shown on the left, and the corresponding statistical results are shown on the right; E and F: Transwell assays were used to detect the effect of PL on the invasion ability of HCC cells, and the statistical results are shown on the right. 200 × magnification, scale bar: 200 μm; G and H: Real time polymerase chain reaction (RT-PCR) was used to detect the effect of PL on the epithelial-mesenchymal transition ability of HCC cells; I and J: RT-PCR was used to detect the effect of PL on cytokine secretion by HCC cells; K and M: RT-PCR was used to detect the effect of PL on the expression of genes involved in the MAPK/AKT/STAT3 signaling axis; L and N: Western blot was used to detect the effect of PL on the protein expression of p-MAPK, p-AKT and p-STAT3. The figure shows the mean ± SD deviation of the experimental results, with asterisks denoting significant differences between the two groups (aP < 0.05, bP < 0.01, cP < 0.001). NC: Negative control; PL: Platelet lysis buffer; Annexin V-FITC: Fluorescein isothiocyanate-labeled Annexin V; PI: Propidium iodide.
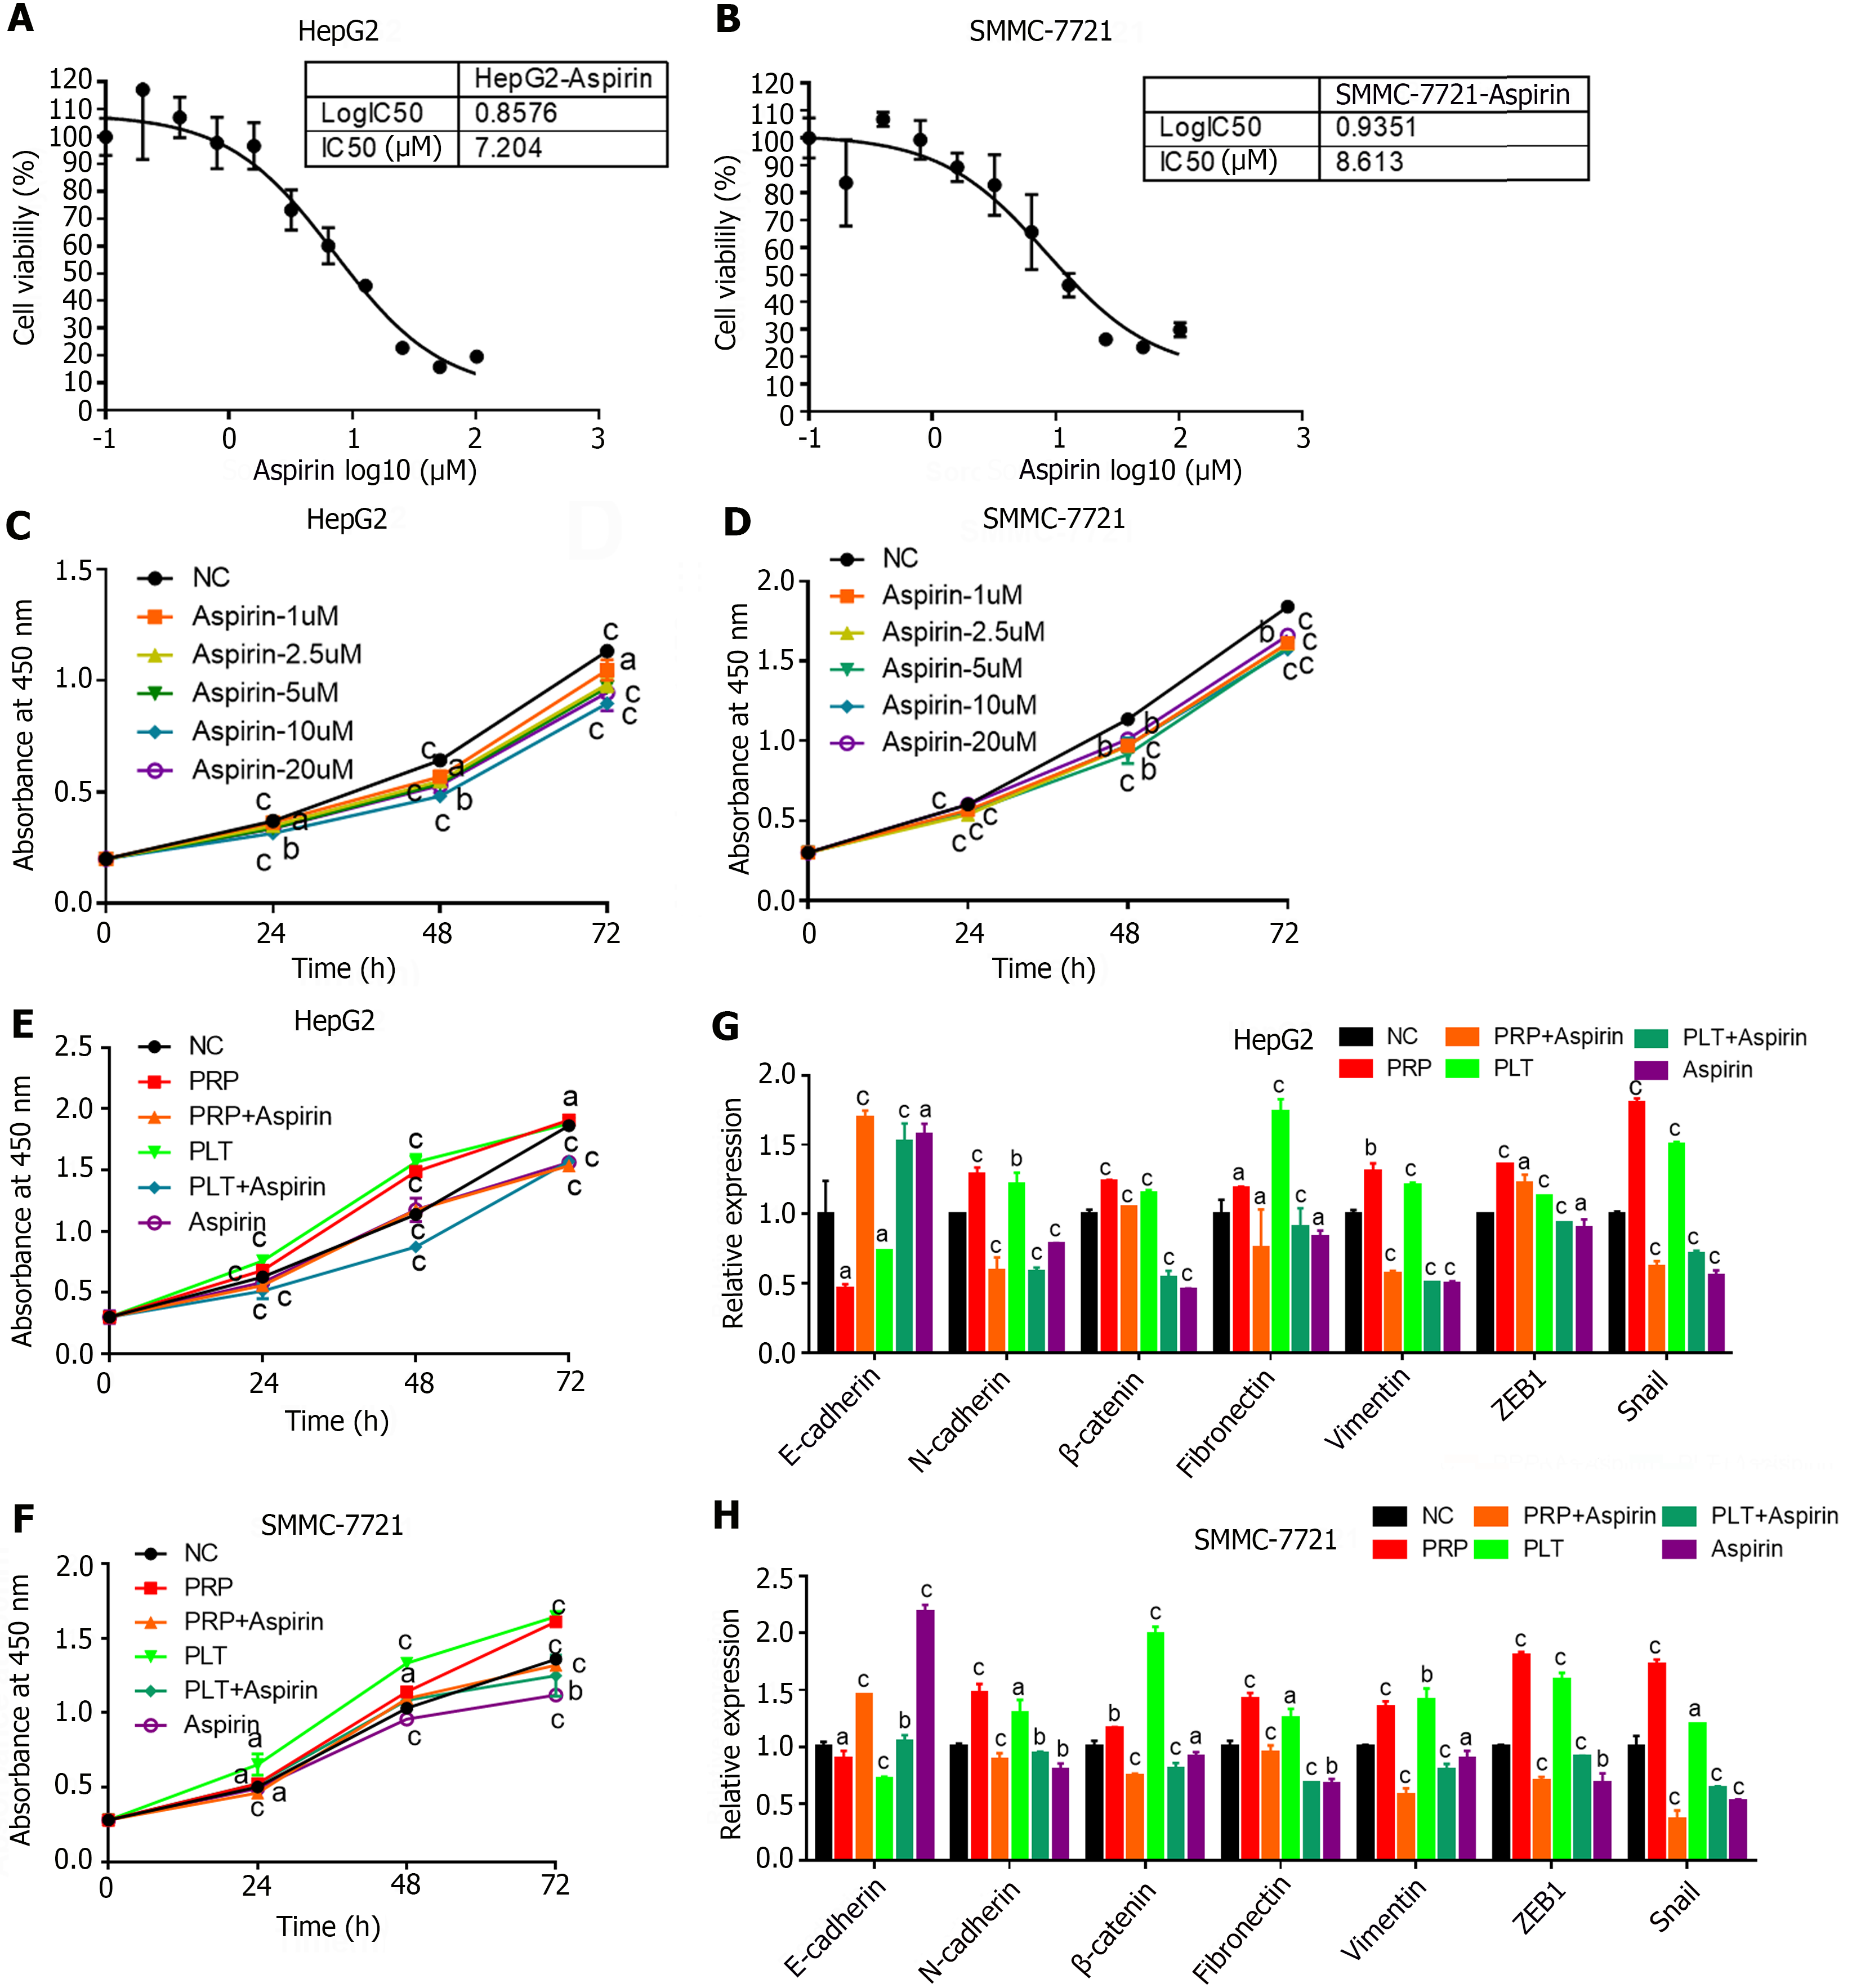
Figure 5 Aspirin can inhibit hepatocellular carcinoma tumor growth and epithelial-mesenchymal transition by inhibiting platelet activity.
A and B: Cytotoxicity analysis of the IC50 of aspirin in HepG2 and SMMC-7721 cells; C and D: CCK8 analysis of the effects of different concentrations of aspirin on the proliferation of hepatocellular carcinoma (HCC) cells; E and F: CCK8 analysis to detect the effect of platelets and aspirin on the proliferation of HCC cells; G and H: Real time polymerase chain reaction was used to detect the effects of platelets and aspirin on epithelial-mesenchymal transition in HCC cells. The figure shows the mean ± SD of the experimental results, with asterisks denoting significant differences between the two groups (aP < 0.05, bP < 0.01, cP < 0.001). NC: Negative control; PPP: Platelet plasma; PRP: Platelet-rich plasma; FBS: Fetal bovine serum; PLT: Platelets.
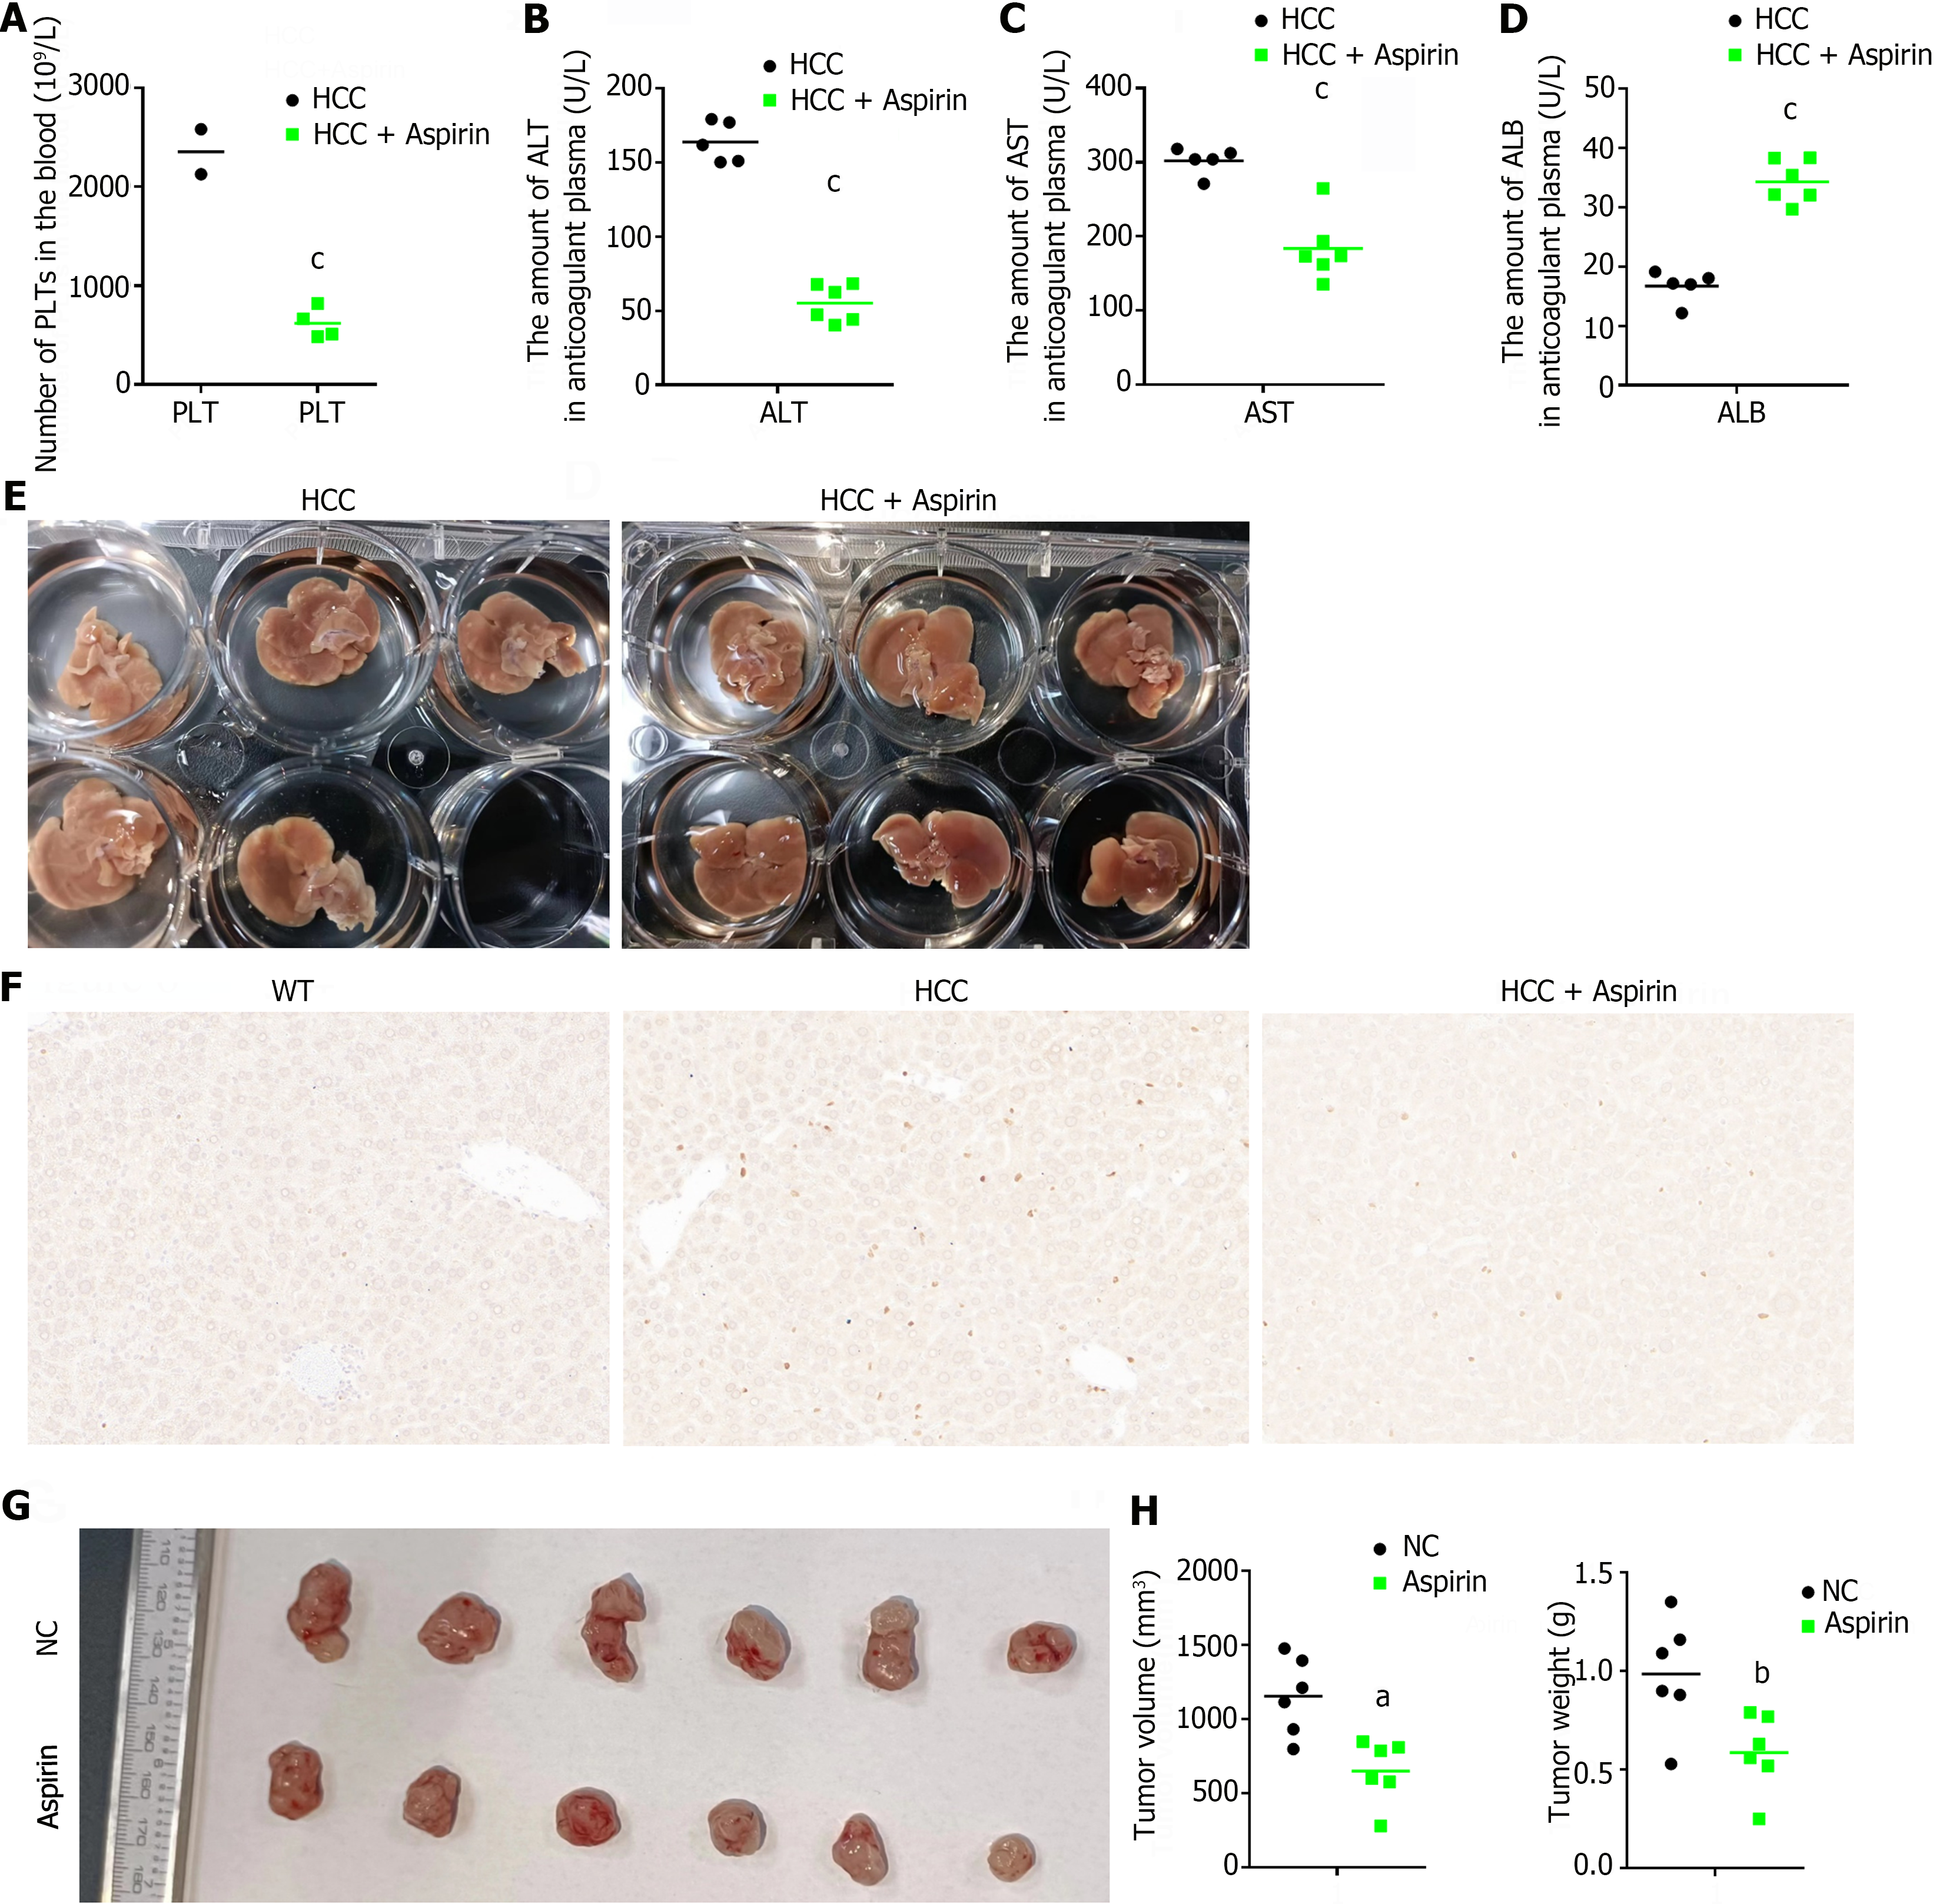
Figure 6 Aspirin can inhibit the progression of hepatocellular carcinoma by inhibiting platelets.
A: Routine blood was used to detect the platelet content in the whole blood of mice in different treatment groups, and statistical analysis was performed; B-D: Blood biochemistry was used to detect alanine transaminase, aspartate transaminase, and albumin in the anticoagulated plasma of mice in different treatment groups, and statistical analysis was performed; E: Macroscopic map of liver tissue from hepatocellular carcinoma mice in different treatment groups; F: Immunohistochemistry was used to detect the content of Ki67 (antigen identified by monoclonal antibody Ki67) in liver tissues from the different treatment groups; G and H: In vivo experiments were performed to detect the effect of aspirin on tumor growth, and statistical analysis was performed. The figure shows the mean ± SD of the experimental results, with asterisks denoting significant differences between the two groups (aP < 0.05, bP < 0.01, cP < 0.001). NC: Negative control; WT: Wild-type; PLT: Platelets; HCC: Hepatocellular carcinoma; ALT: Alanine transaminase; AST: Aspartate transaminase; ALB: Albumin.
- Citation: Zhao LJ, Wang ZY, Liu WT, Yu LL, Qi HN, Ren J, Zhang CG. Aspirin suppresses hepatocellular carcinoma progression by inhibiting platelet activity. World J Gastrointest Oncol 2024; 16(6): 2742-2756
- URL: https://www.wjgnet.com/1948-5204/full/v16/i6/2742.htm
- DOI: https://dx.doi.org/10.4251/wjgo.v16.i6.2742


