Copyright
©The Author(s) 2024.
World J Gastrointest Oncol. Jun 15, 2024; 16(6): 2697-2715
Published online Jun 15, 2024. doi: 10.4251/wjgo.v16.i6.2697
Published online Jun 15, 2024. doi: 10.4251/wjgo.v16.i6.2697
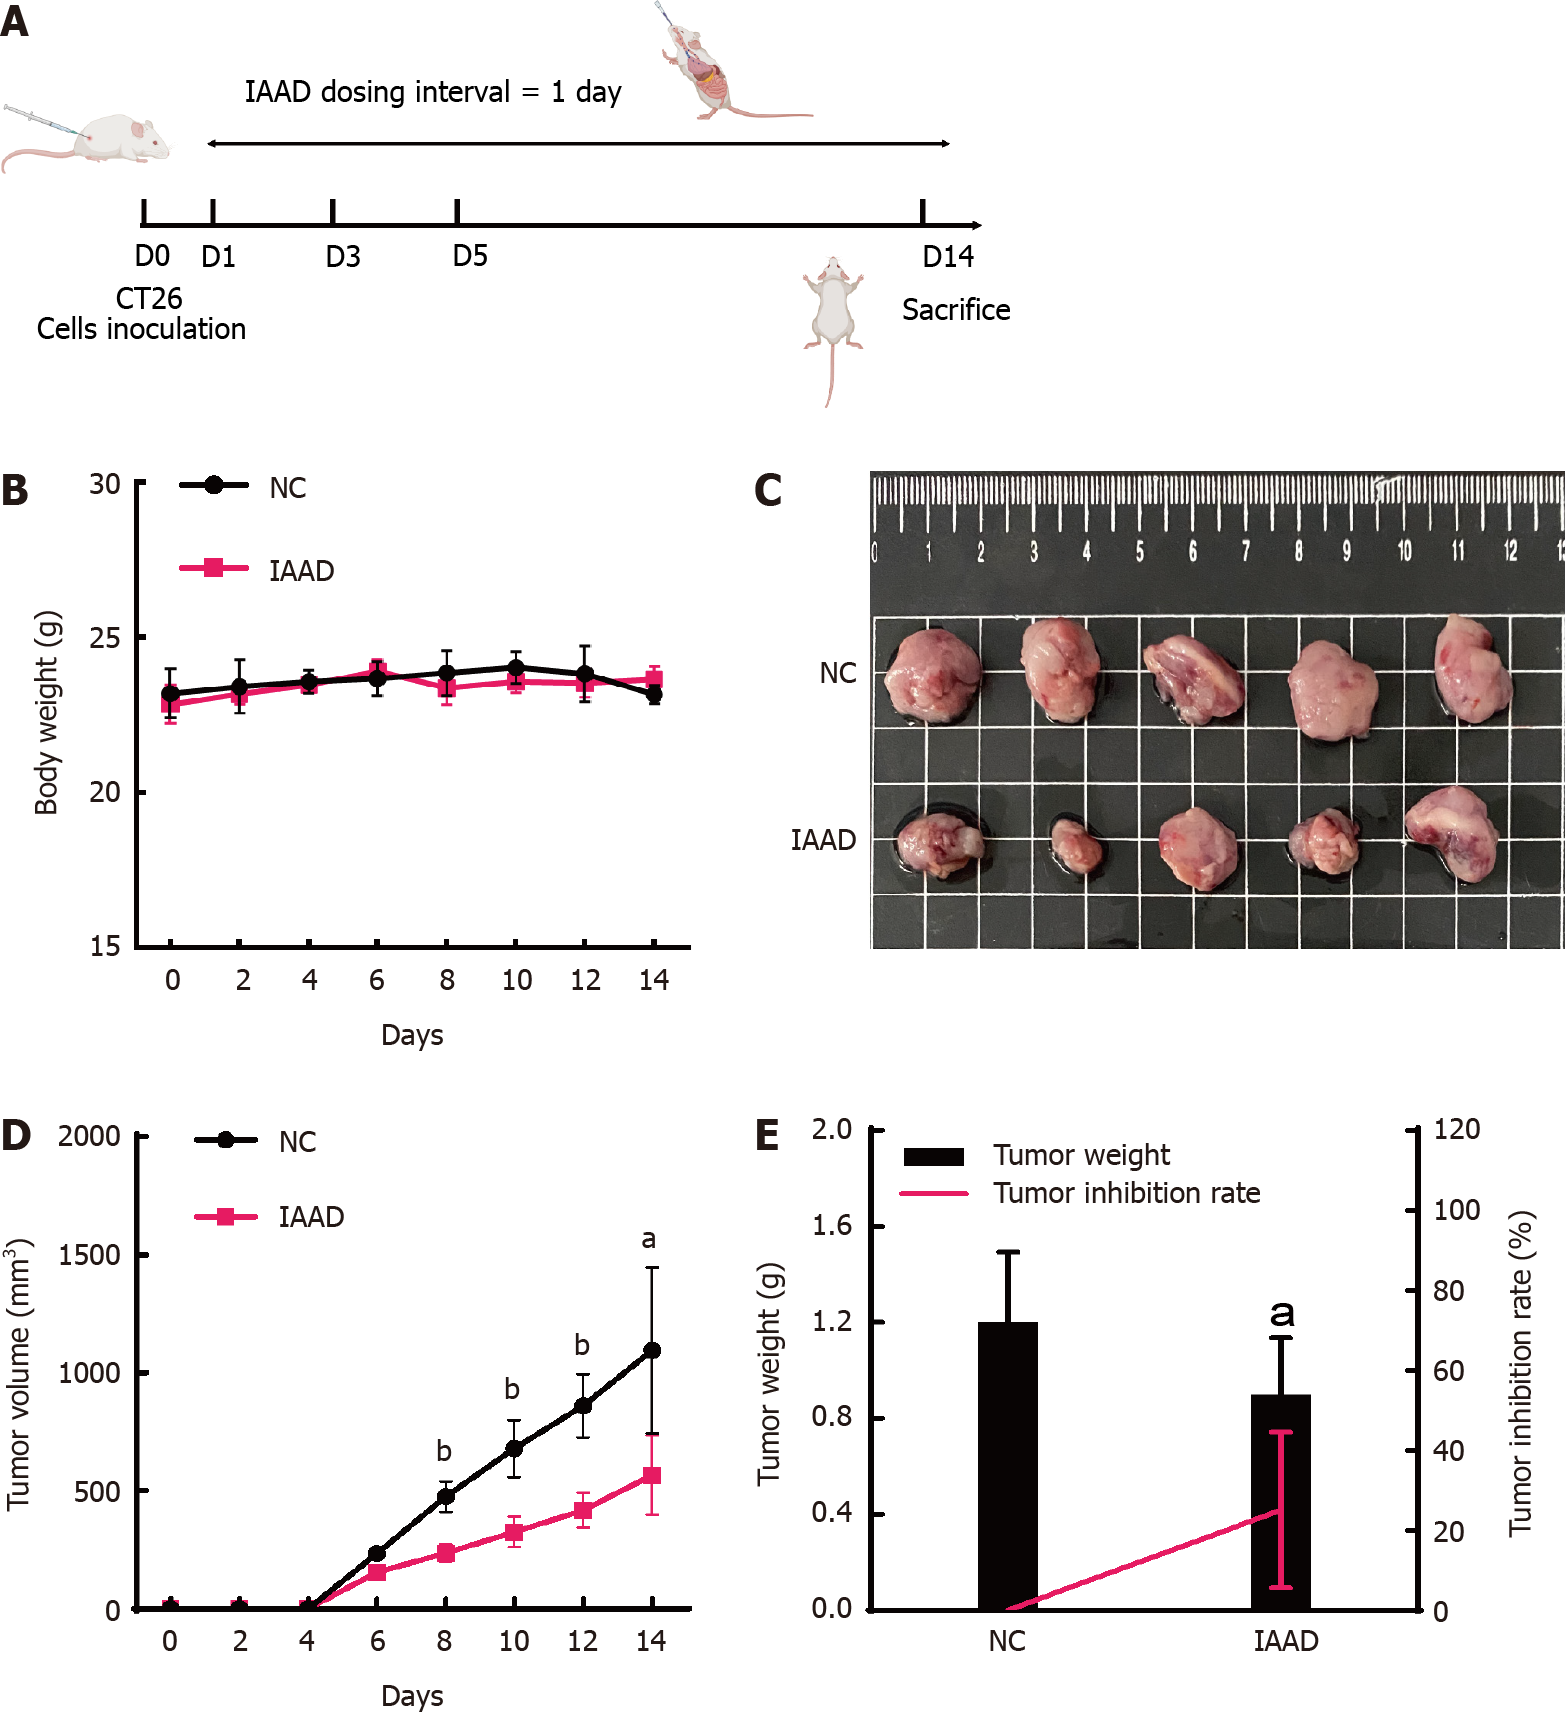
Figure 1 Anti-tumor effect of indole-3-acetaldehyde in vivo.
A: Flowchart of the experiment; B: Changes in body weight; C: Macroscopic view of the subcutaneous tumor; D: Changes in tumor volume; E: Subcutaneous tumor weight and tumor inhibition rate. aP < 0.05 vs control group; bP < 0.01 vs control group. IAAD: Group of mice receiving indole-3-acetaldehyde (dissolved in corn oil); NC: Group of mice receiving corn oil.
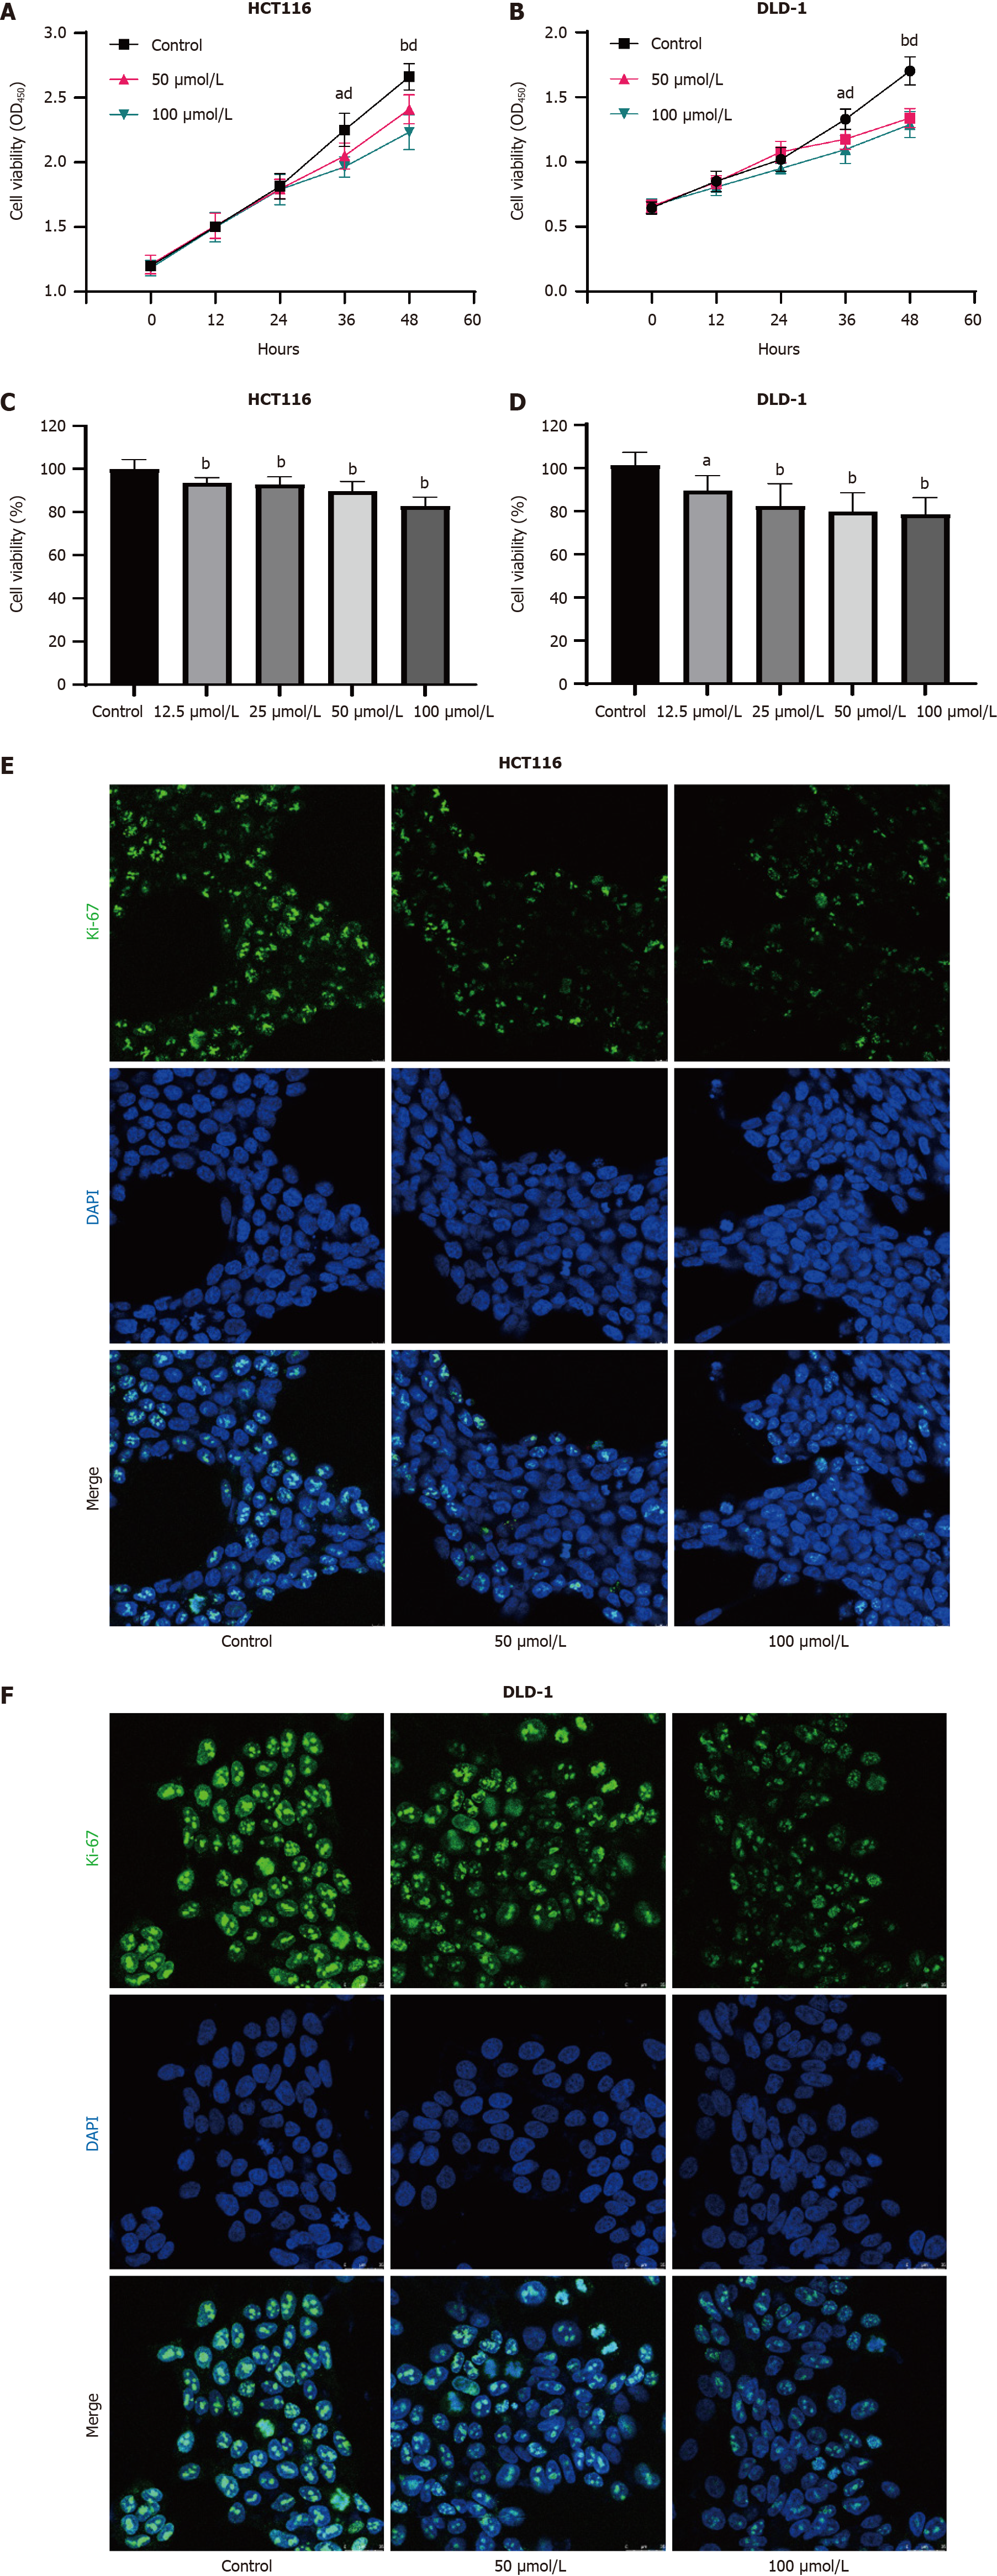
Figure 2 Indole-3-acetaldehyde inhibits proliferation of colorectal cancer cells in vitro.
A and B: Growth curves of HCT116 and DLD-1 cells treated with IAAD; C and D: Vitality of HCT116 and DLD-1 cells treated with different concentrations of indole-3-acetaldehyde after 48 h, compared with the control group; E and F: The expression of Ki-67 in the nucleus was determined by immunofluorescence. aP < 0.05, 50 μmol/L indole-3-acetaldehyde treatment group vs control group; bP < 0.01, 50 μmol/L indole-3-acetaldehyde treatment group vs control group; dP < 0.01, 100 μmol/L indole-3-acetaldehyde treatment group vs control group. DAPI: 4’,6-diamidino-2-phenylindole.
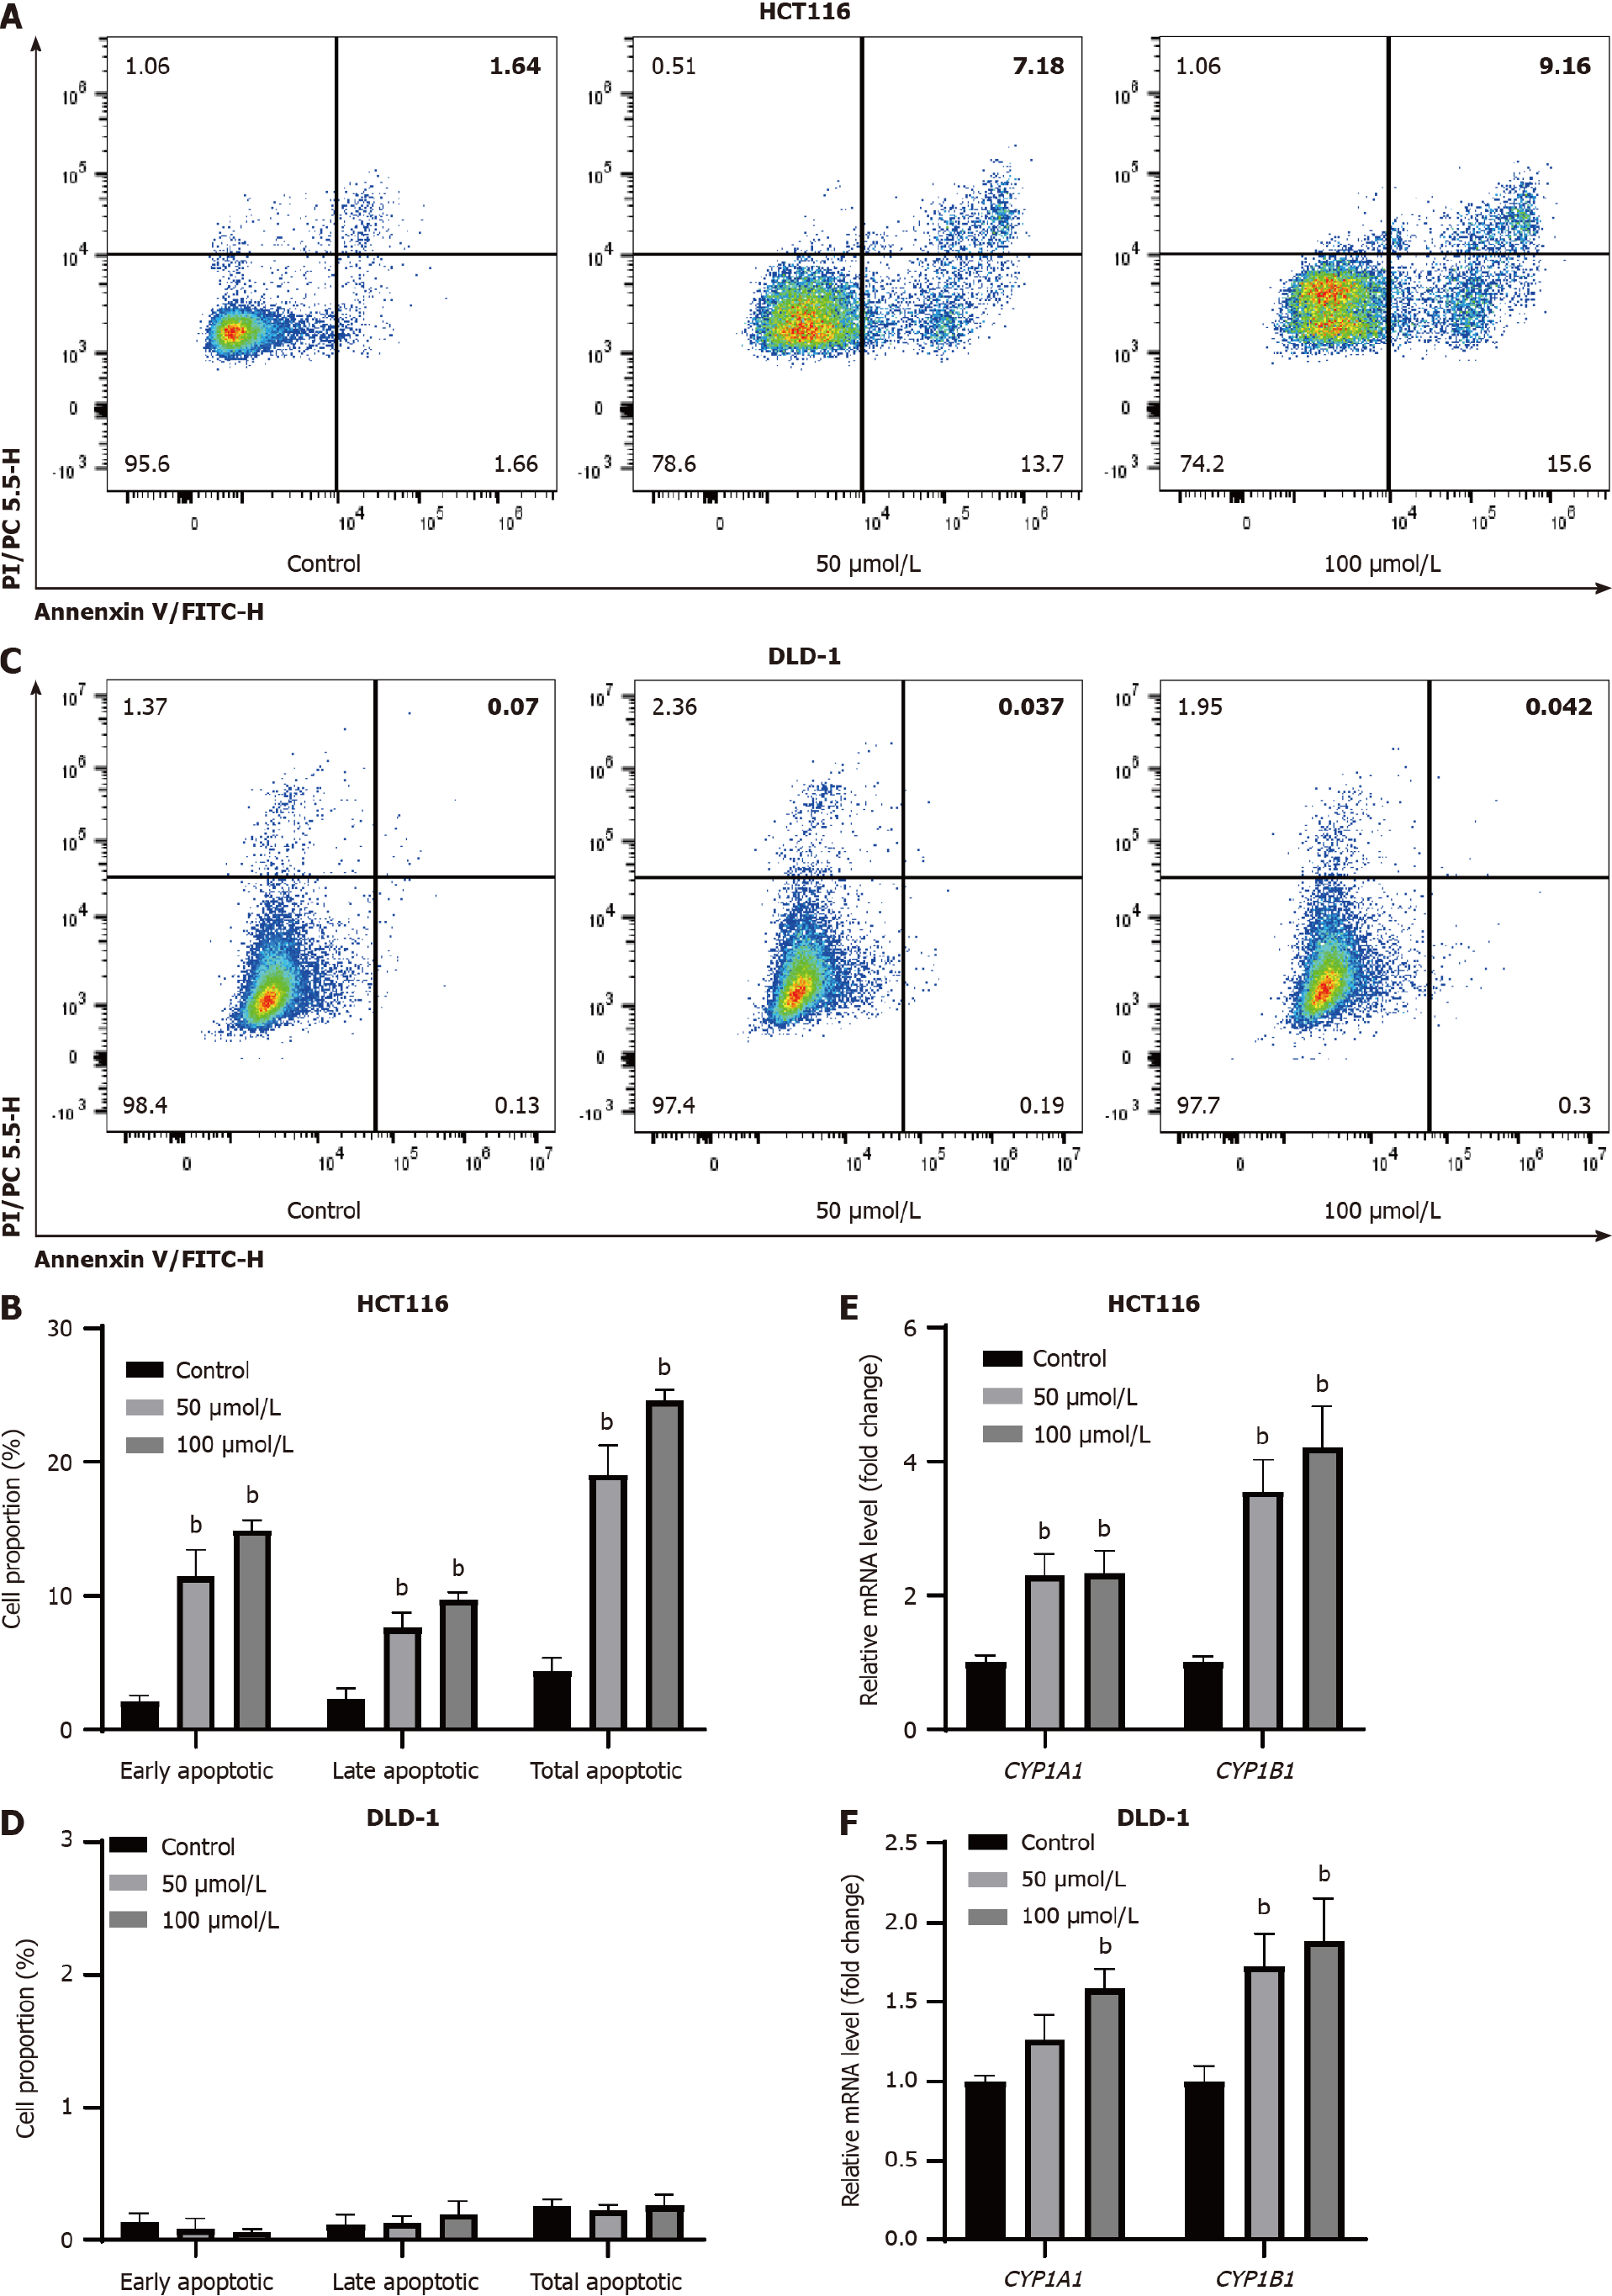
Figure 3 Indole-3-acetaldehyde induces apoptosis in HCT116 cells.
A-D: Apoptosis of colorectal cancer cells was observed by annexin V-fluorescein isothiocyanate/propidium iodide co-staining; E and F: The relative mRNA levels of downstream genes regulated by aryl hydrocarbon receptor were determined by real-time fluorescence quantitative polymerase chain reaction. bP < 0.01 vs control group. CYP1A1: Cytochrome P450 family 1 subfamily A member 1; CYP1B1: Cytochrome P450 family 1 subfamily B member 1.
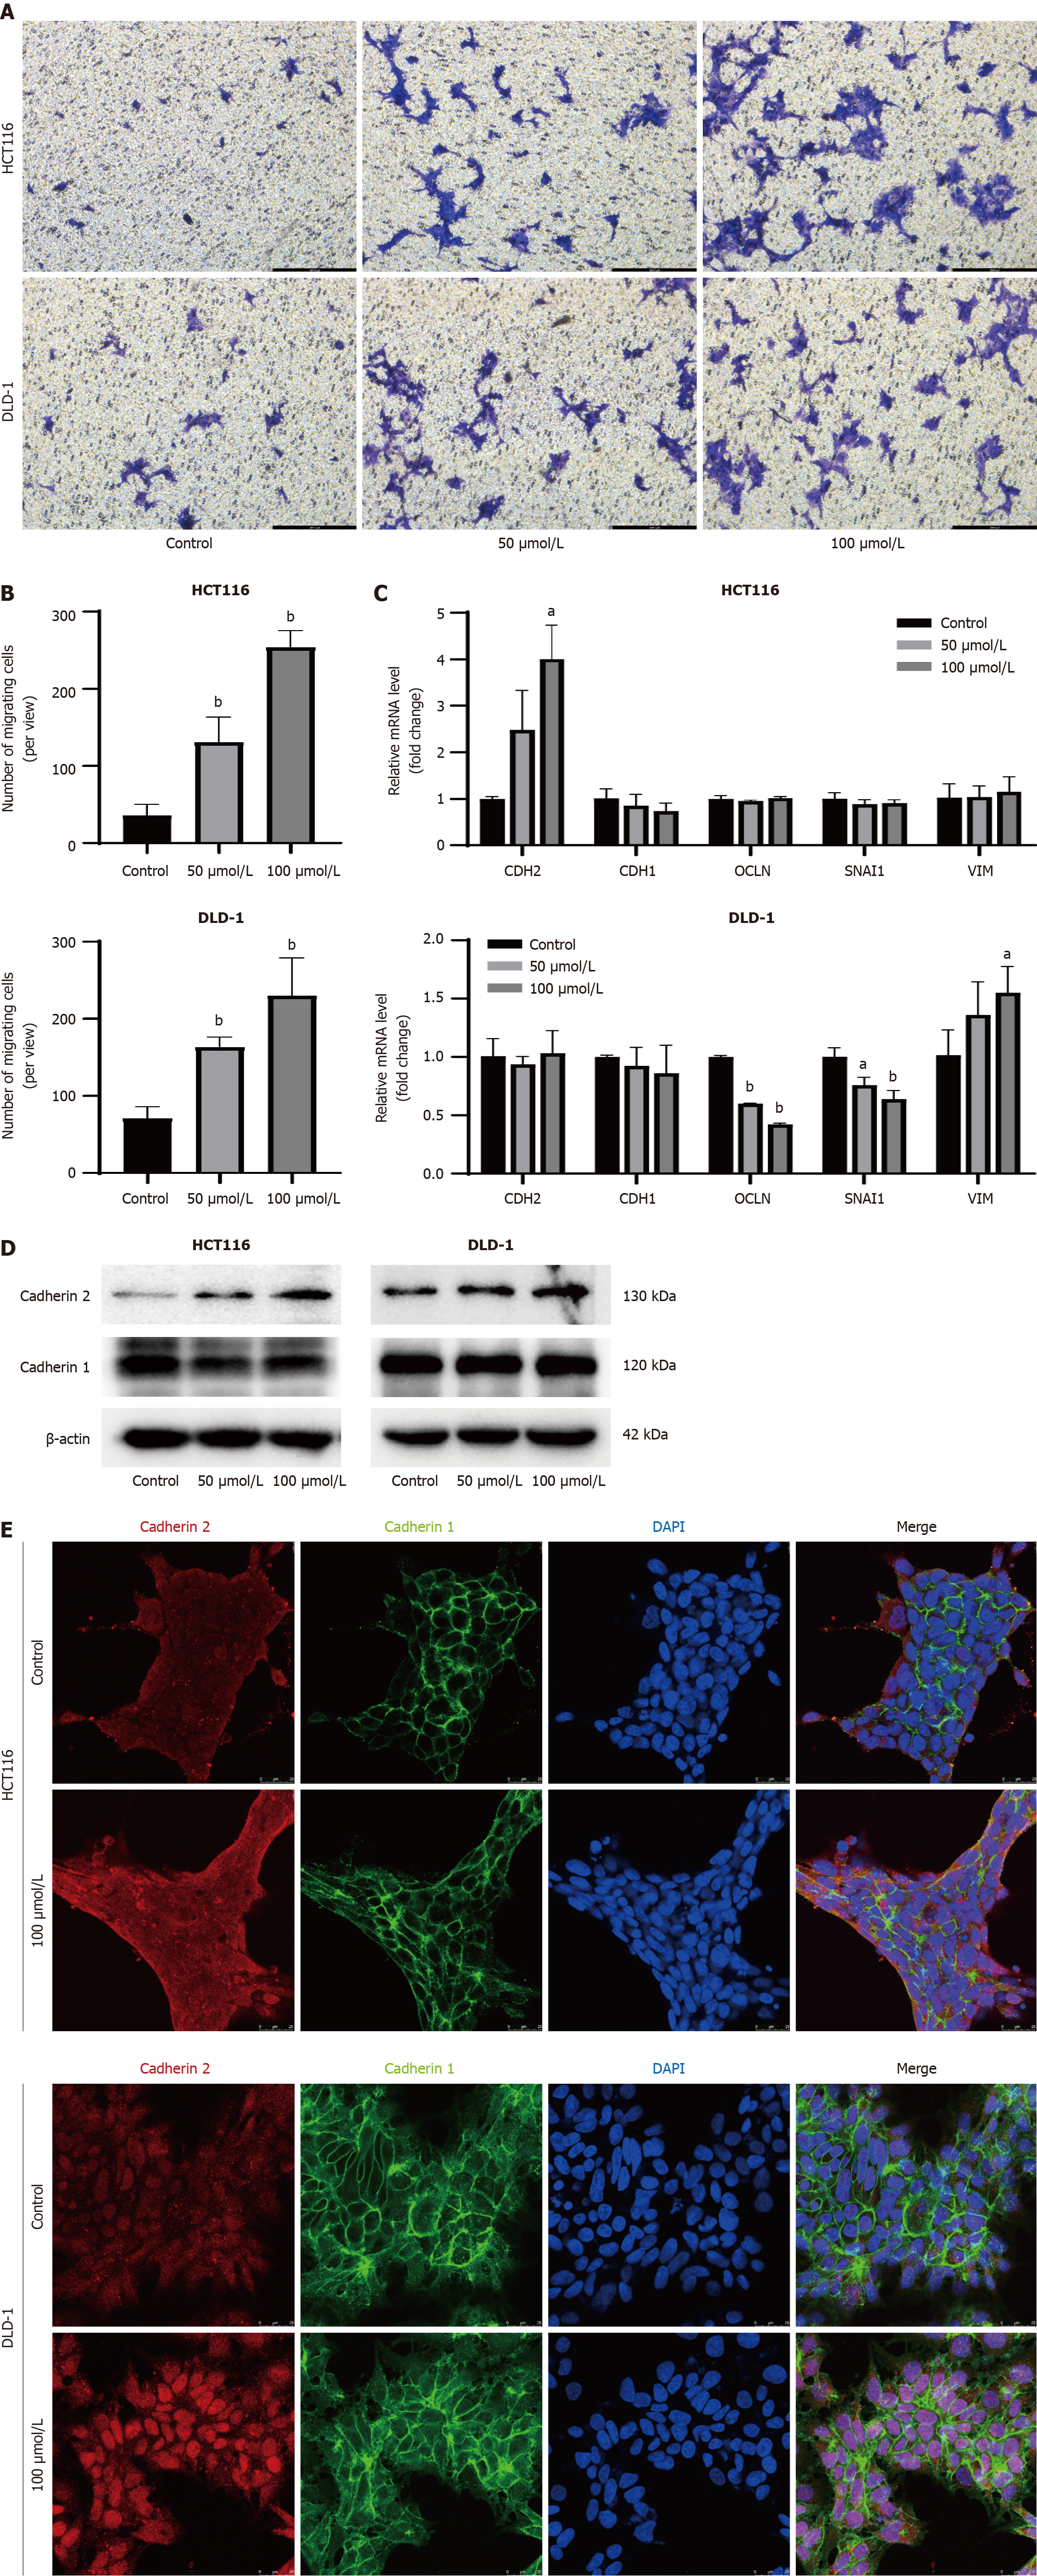
Figure 4 Indole-3-acetaldehyde promotes invasiveness and epithelial-mesenchymal transition of colorectal cancer cell lines.
A: Crystal violet staining image of cells in the lower chamber (100 ×); B: Quantitative analysis of cell numbers in the lower chamber; C: Changes in the mRNA expression levels of cadherin 1, cadherin 2, occludin, snail family transcriptional repressor 1, and vimentin in the HCT116 and DLD-1 cells; D: Western blotting was used to detect the expression of intracellular cadherin; E: The expression and subcellular localization of cadherin were determined by immunofluorescence. aP < 0.05 vs control group; bP < 0.01 vs control group. DAPI: 4’,6-diamidino-2-phenylindole; CDH1: Cadherin 1; CDH2: Cadherin 2; OCLN: Occludin; SNAI1: Snail family transcriptional repressor 1; VIM: Vimentin.
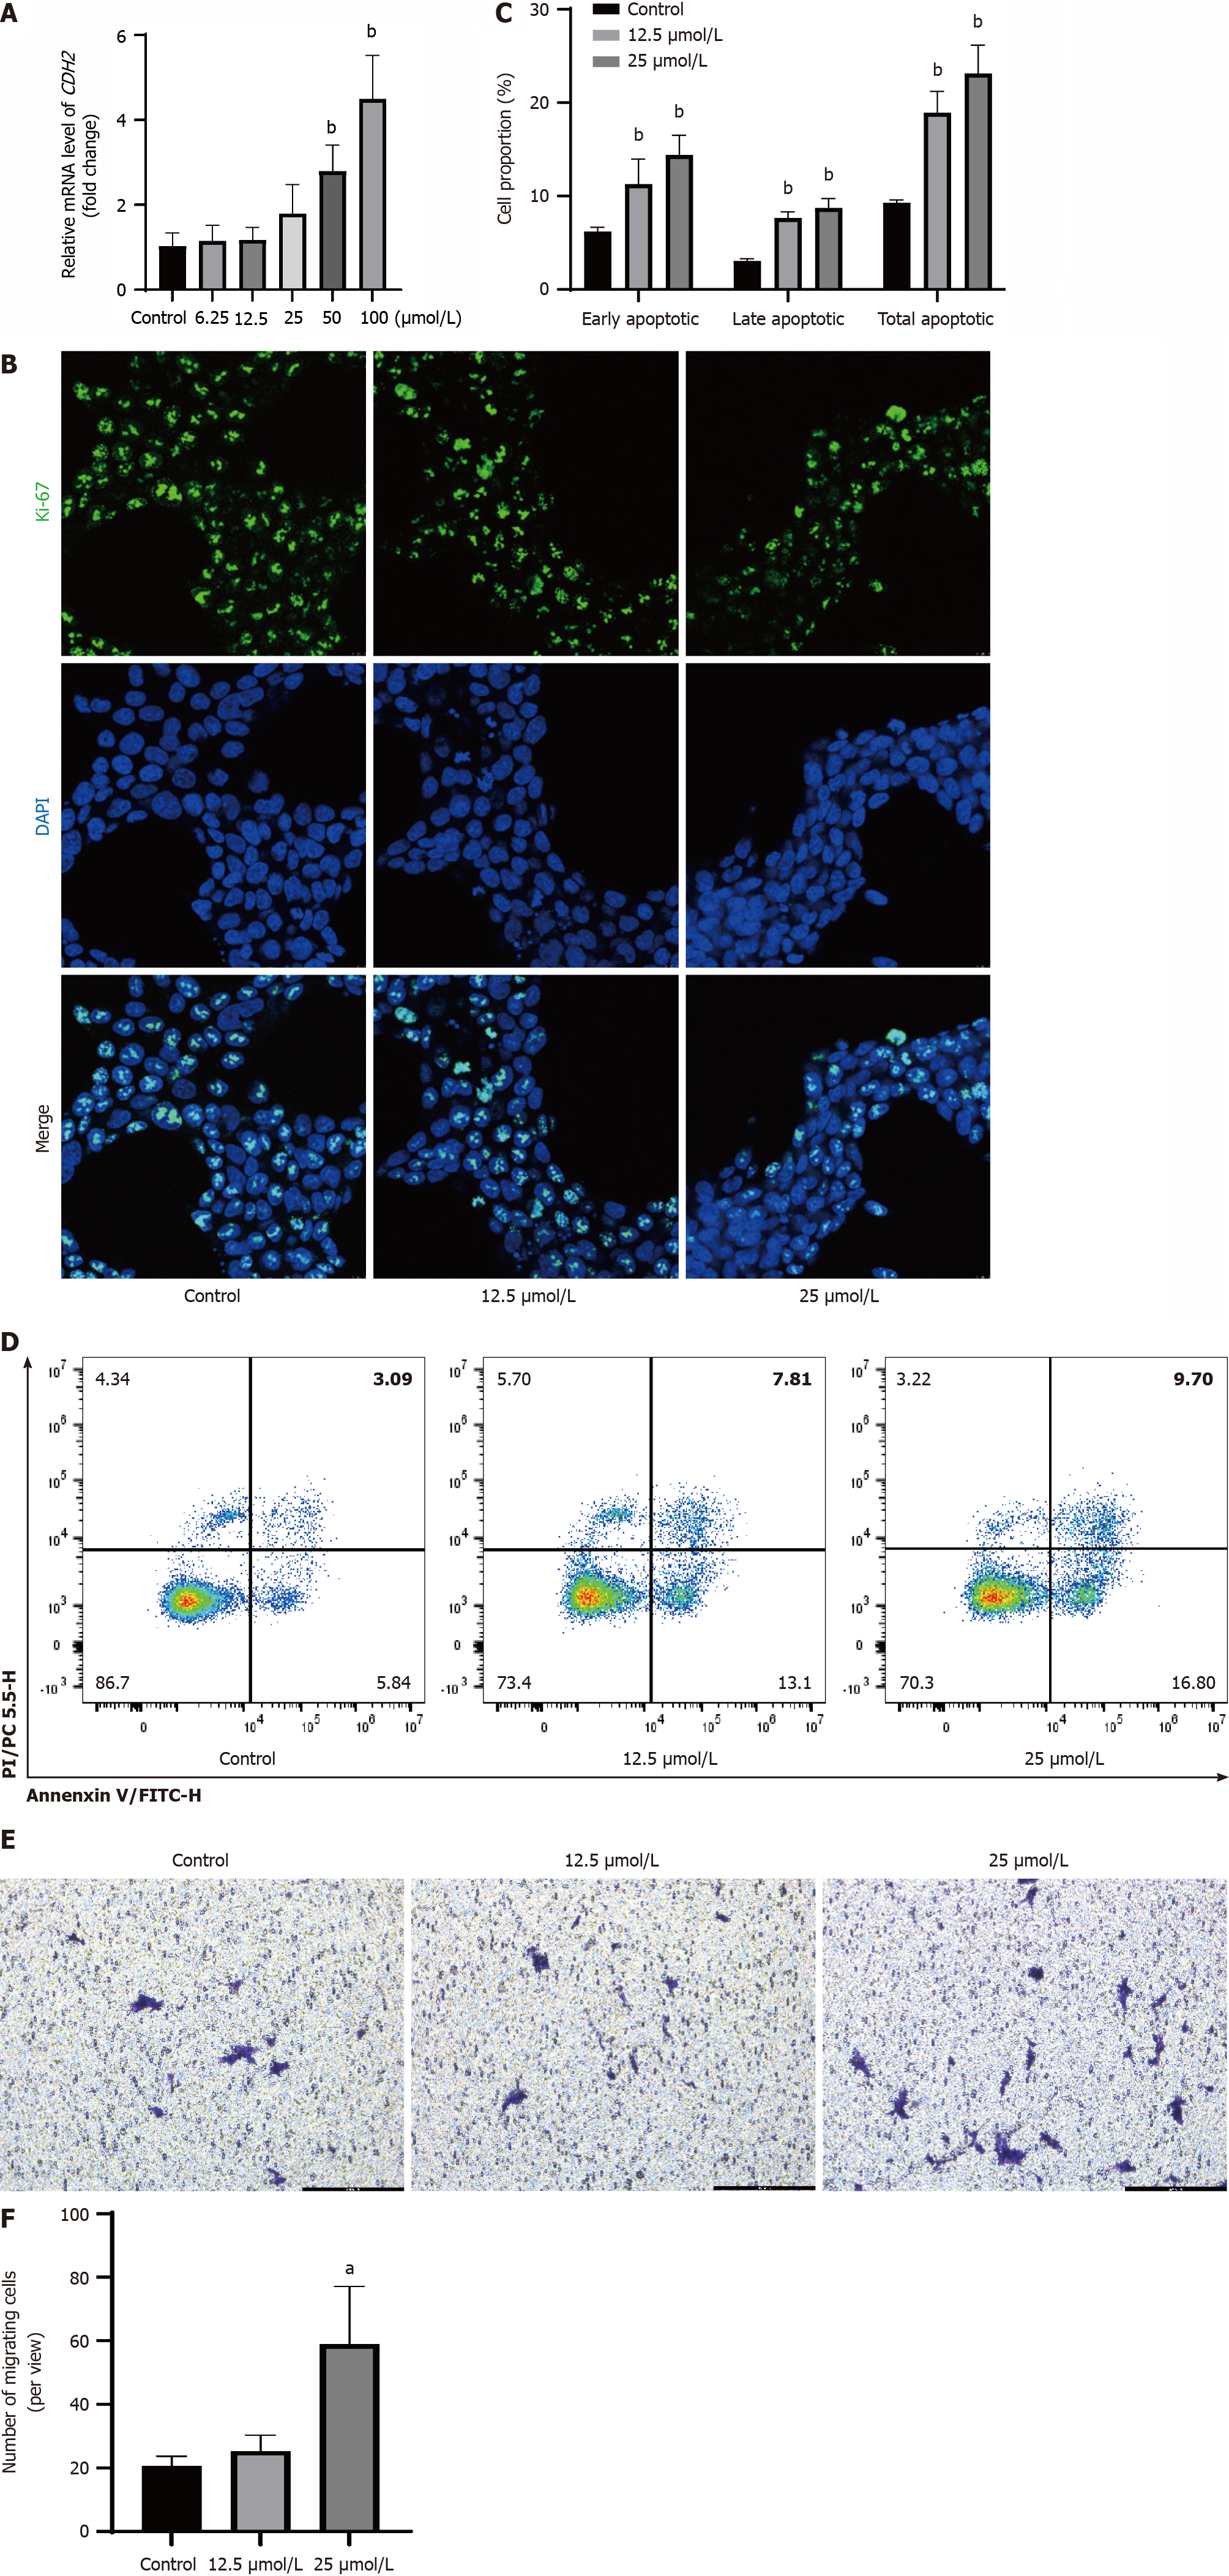
Figure 5 Indole-3-acetaldehyde at a concentration of 12.
5 μmol/L is only cytotoxic and does not promote invasiveness. A: Relative mRNA expression levels of Cadherin 2 in HCT116 cells; B: The expression of Ki-67 in the nucleus was determined via immunofluorescence; C and D: Apoptosis of HCT116 cells was observed by annexin V-fluorescein isothiocyanate/propidium iodide co-staining E: Crystal violet staining image of HCT116 cells in the lower chamber (100 ×); F: Quantitative analysis of HCT116 cell numbers in the lower chamber. aP < 0.05 vs control group; bP < 0.01 vs control group. CDH2: Cadherin 2; DAPI: 4’,6-diamidino-2-phenylindole.
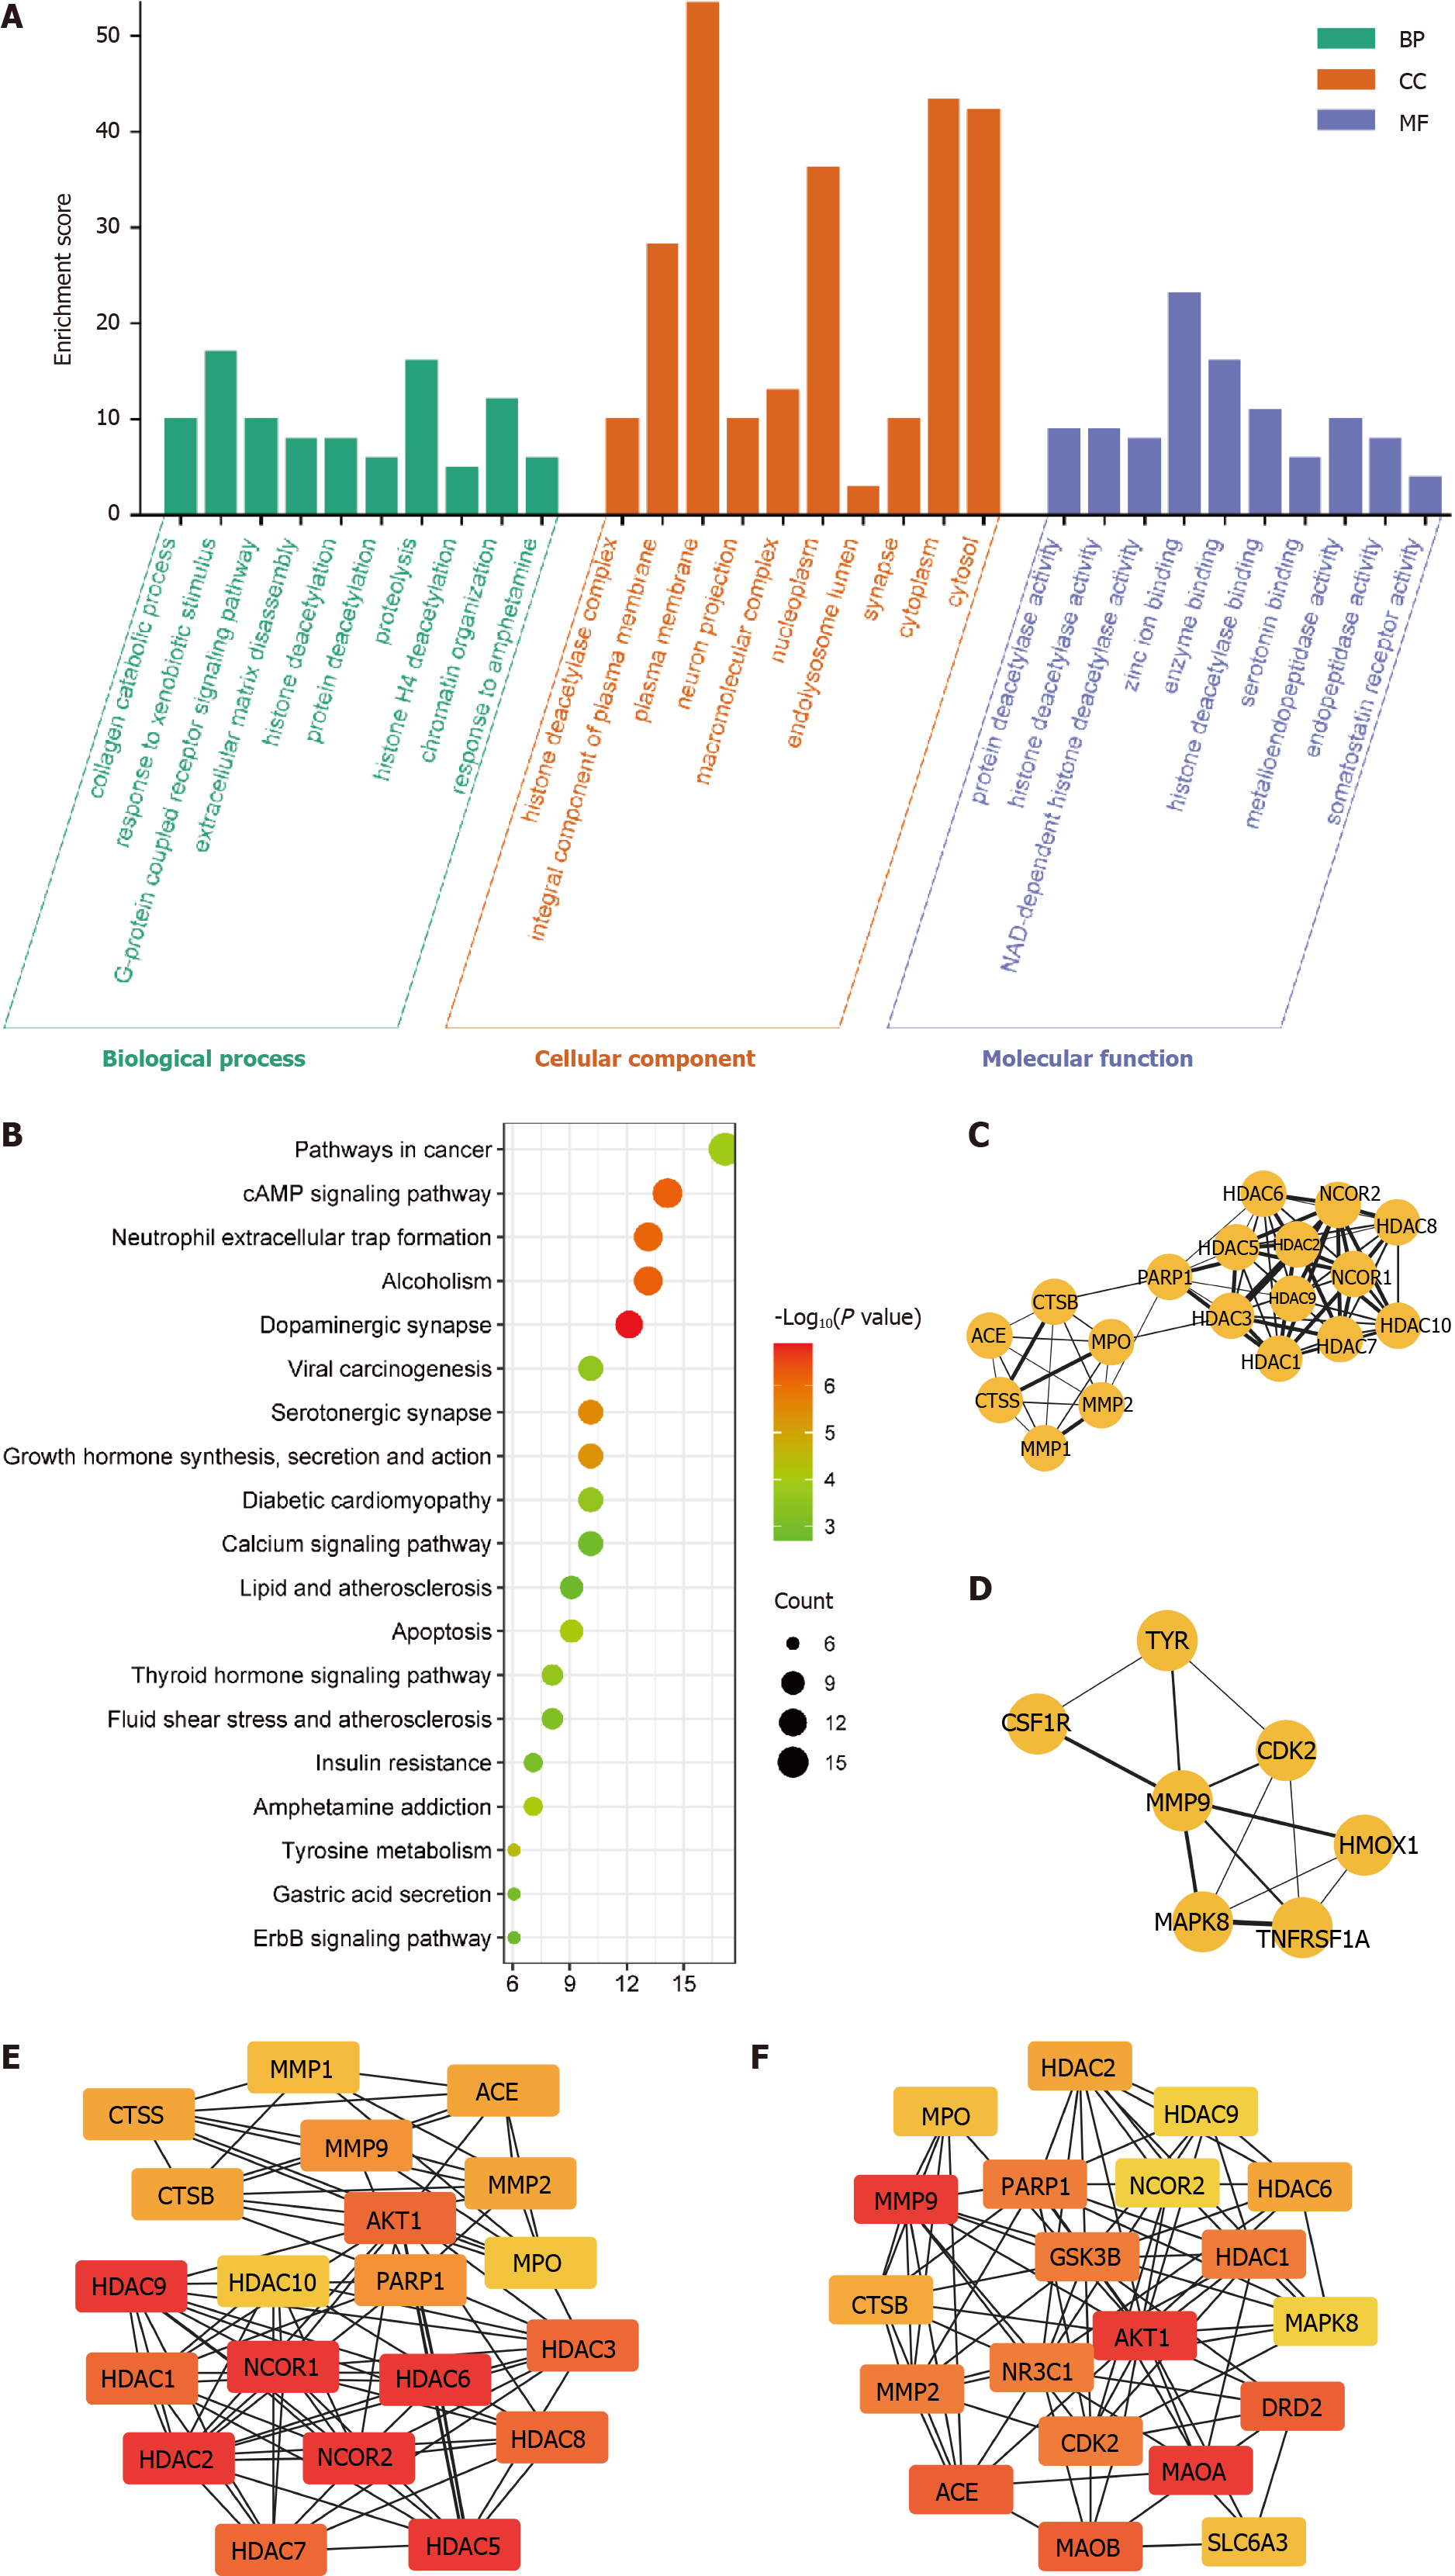
Figure 6 Target protein function prediction and core protein mining of indole-3-acetaldehyde.
A: Analysis based on Gene Ontology database; B: Analysis based on Kyoto Encyclopedia of Genes and Genome database; C and D: Results of the cytoHubba plug-in analysis; E and F: Results of the MCODE plug-in analysis. ACE: Angiotensin converting enzyme; CTSB: Cathepsin B; MPO: Myeloperoxidase; MMP: Matrix Metallopeptidase; CTSS: Cathepsin S; PARP: Poly (ADP-Ribose) Polymerase; HDAC: Histone deacetylase; CSF1R: Colony stimulating factor 1 receptor; TYR: Tyrosinase; CDK: Cyclin dependent kinase; MAPK: Mitogen-activated protein kinase; HMOX: Heme oxygenase 1; TNFRSF1A: TNF receptor superfamily member 1A; NCOR: Nuclear receptor corepressor; GSK3B: Glycogen synthase kinase 3 beta; AKT: AKT serine/threonine kinase; NR3C1: Nuclear receptor subfamily 3 group c member 1; DRD2: Dopamine receptor D2; MAOA: Monoamine oxidase A; MAOB: Monoamine oxidase B; SLC6A3: Solute carrier family 6 member 3.
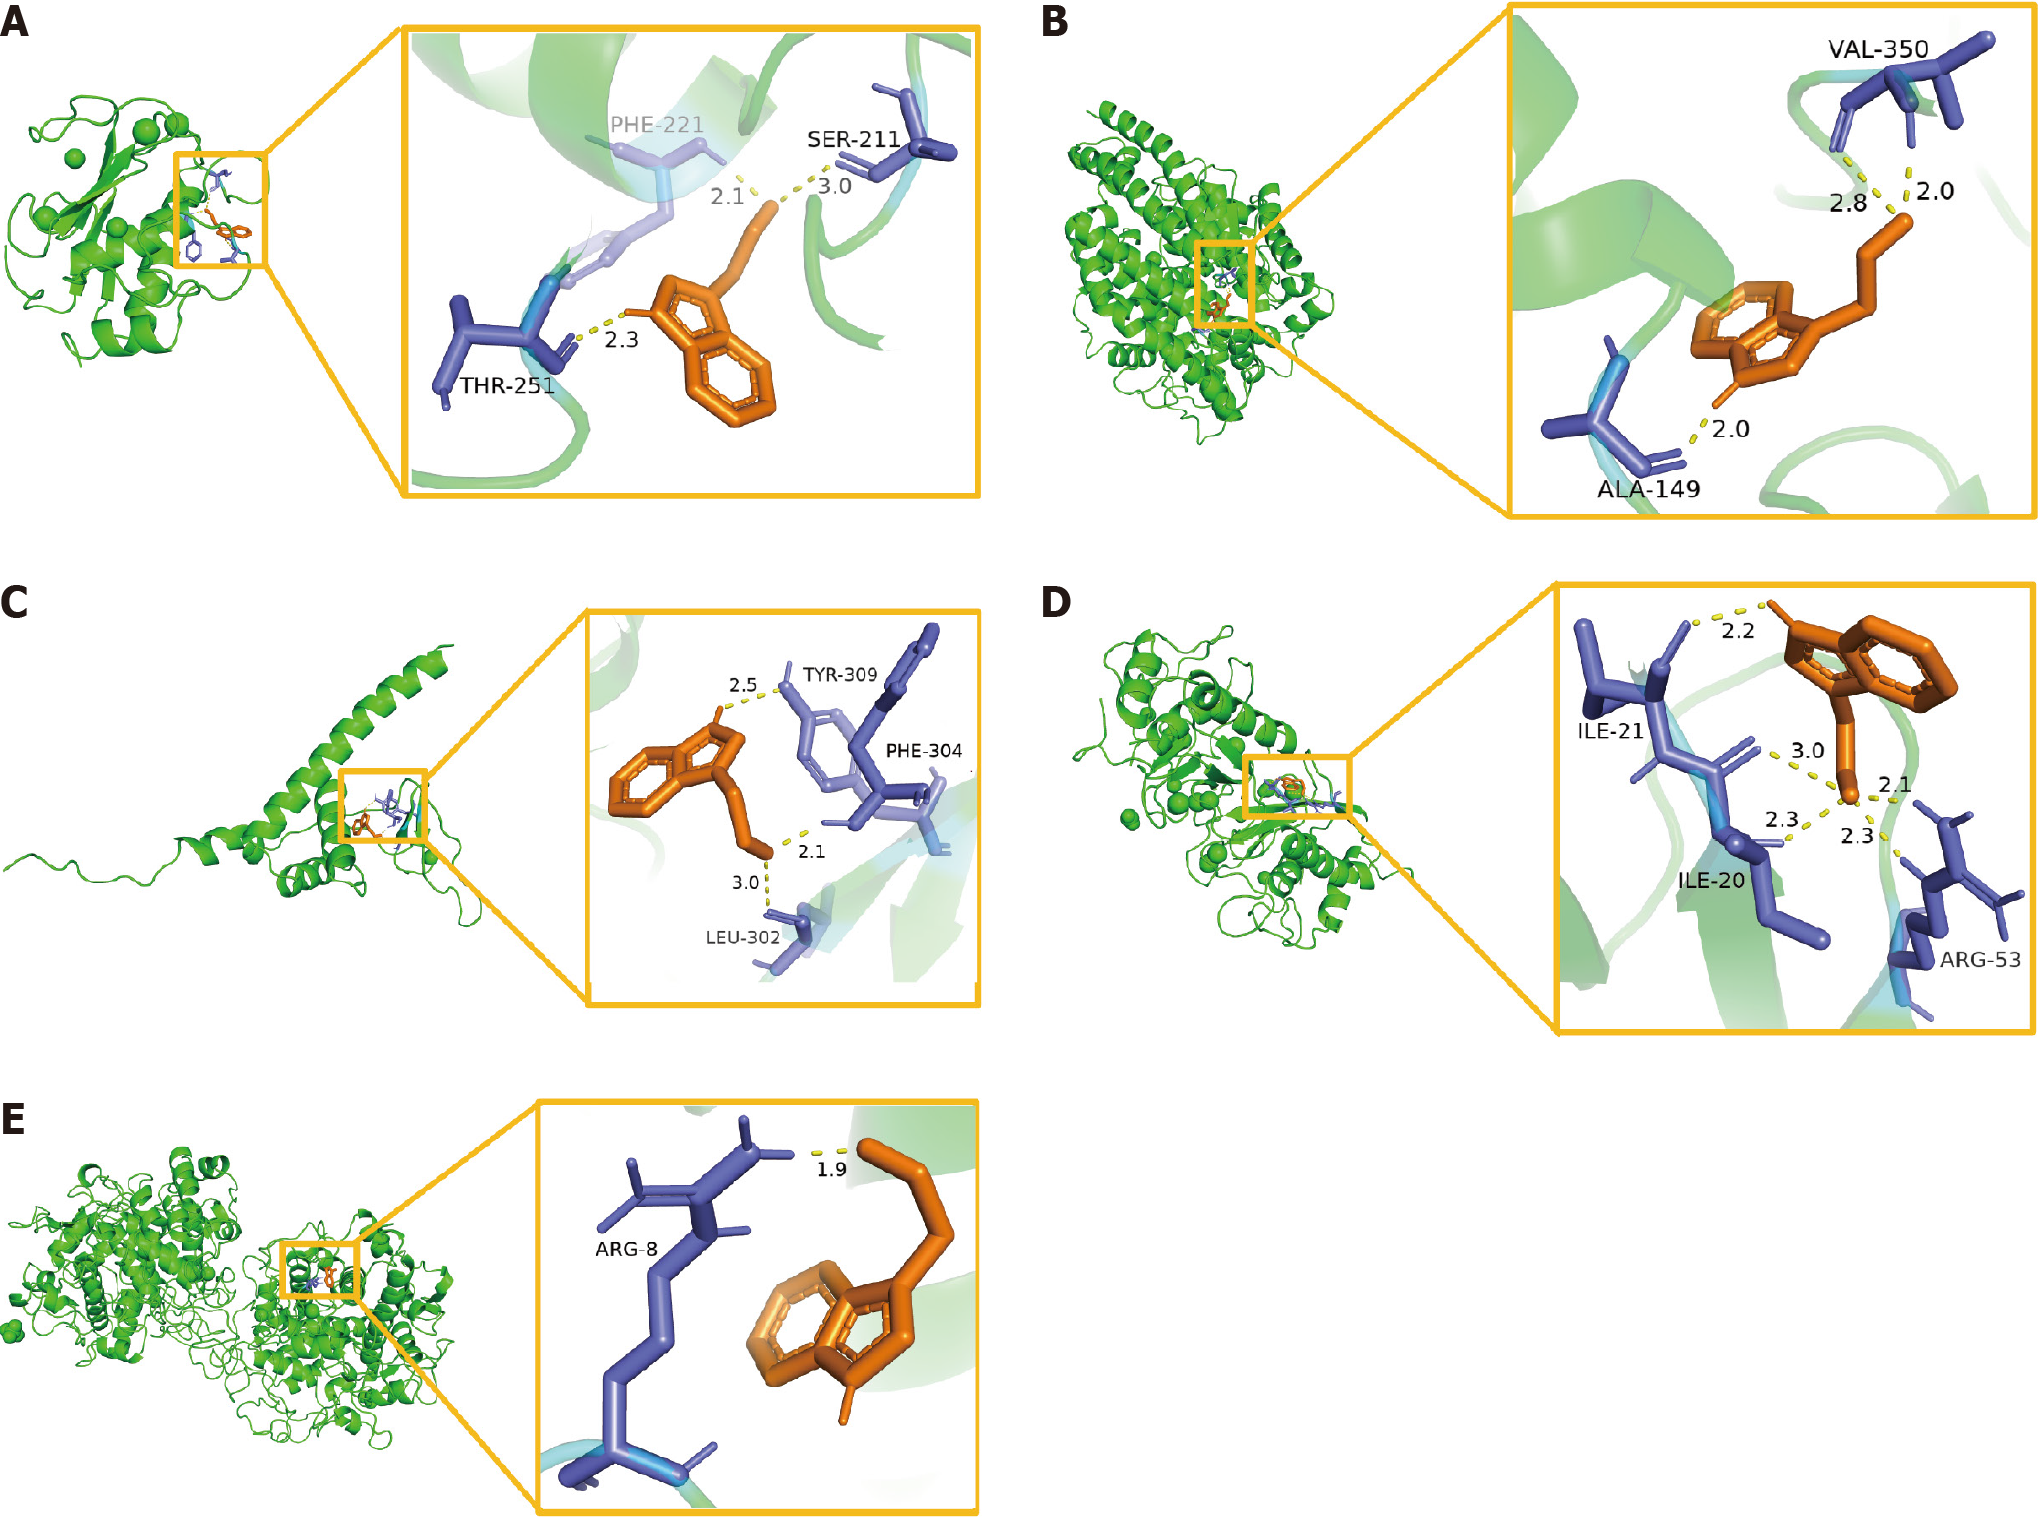
Figure 7 Molecular docking model of the predicted targets and indole-3-acetaldehyde.
A: Matrix metalloproteinase-9-indole-3-acetaldehyde (IAAD); B: Angiotensin converting enzyme-IAAD; C: Poly ADP-ribose polymerase-1-IAAD; D: Matrix metalloproteinase-2-IAAD; E: Myeloperoxidase-IAAD. PHE: Phenylalanine; SER: Serine; THR: Threonine; VAL: Valine; ALA: Alanine; TYR: Tyrosine; LEU: Leucine; ILE: Isoleucine; ARG: Arginine.
- Citation: Dai Z, Deng KL, Wang XM, Yang DX, Tang CL, Zhou YP. Bidirectional effects of the tryptophan metabolite indole-3-acetaldehyde on colorectal cancer. World J Gastrointest Oncol 2024; 16(6): 2697-2715
- URL: https://www.wjgnet.com/1948-5204/full/v16/i6/2697.htm
- DOI: https://dx.doi.org/10.4251/wjgo.v16.i6.2697


