Copyright
©The Author(s) 2024.
World J Gastrointest Oncol. Jun 15, 2024; 16(6): 2646-2662
Published online Jun 15, 2024. doi: 10.4251/wjgo.v16.i6.2646
Published online Jun 15, 2024. doi: 10.4251/wjgo.v16.i6.2646
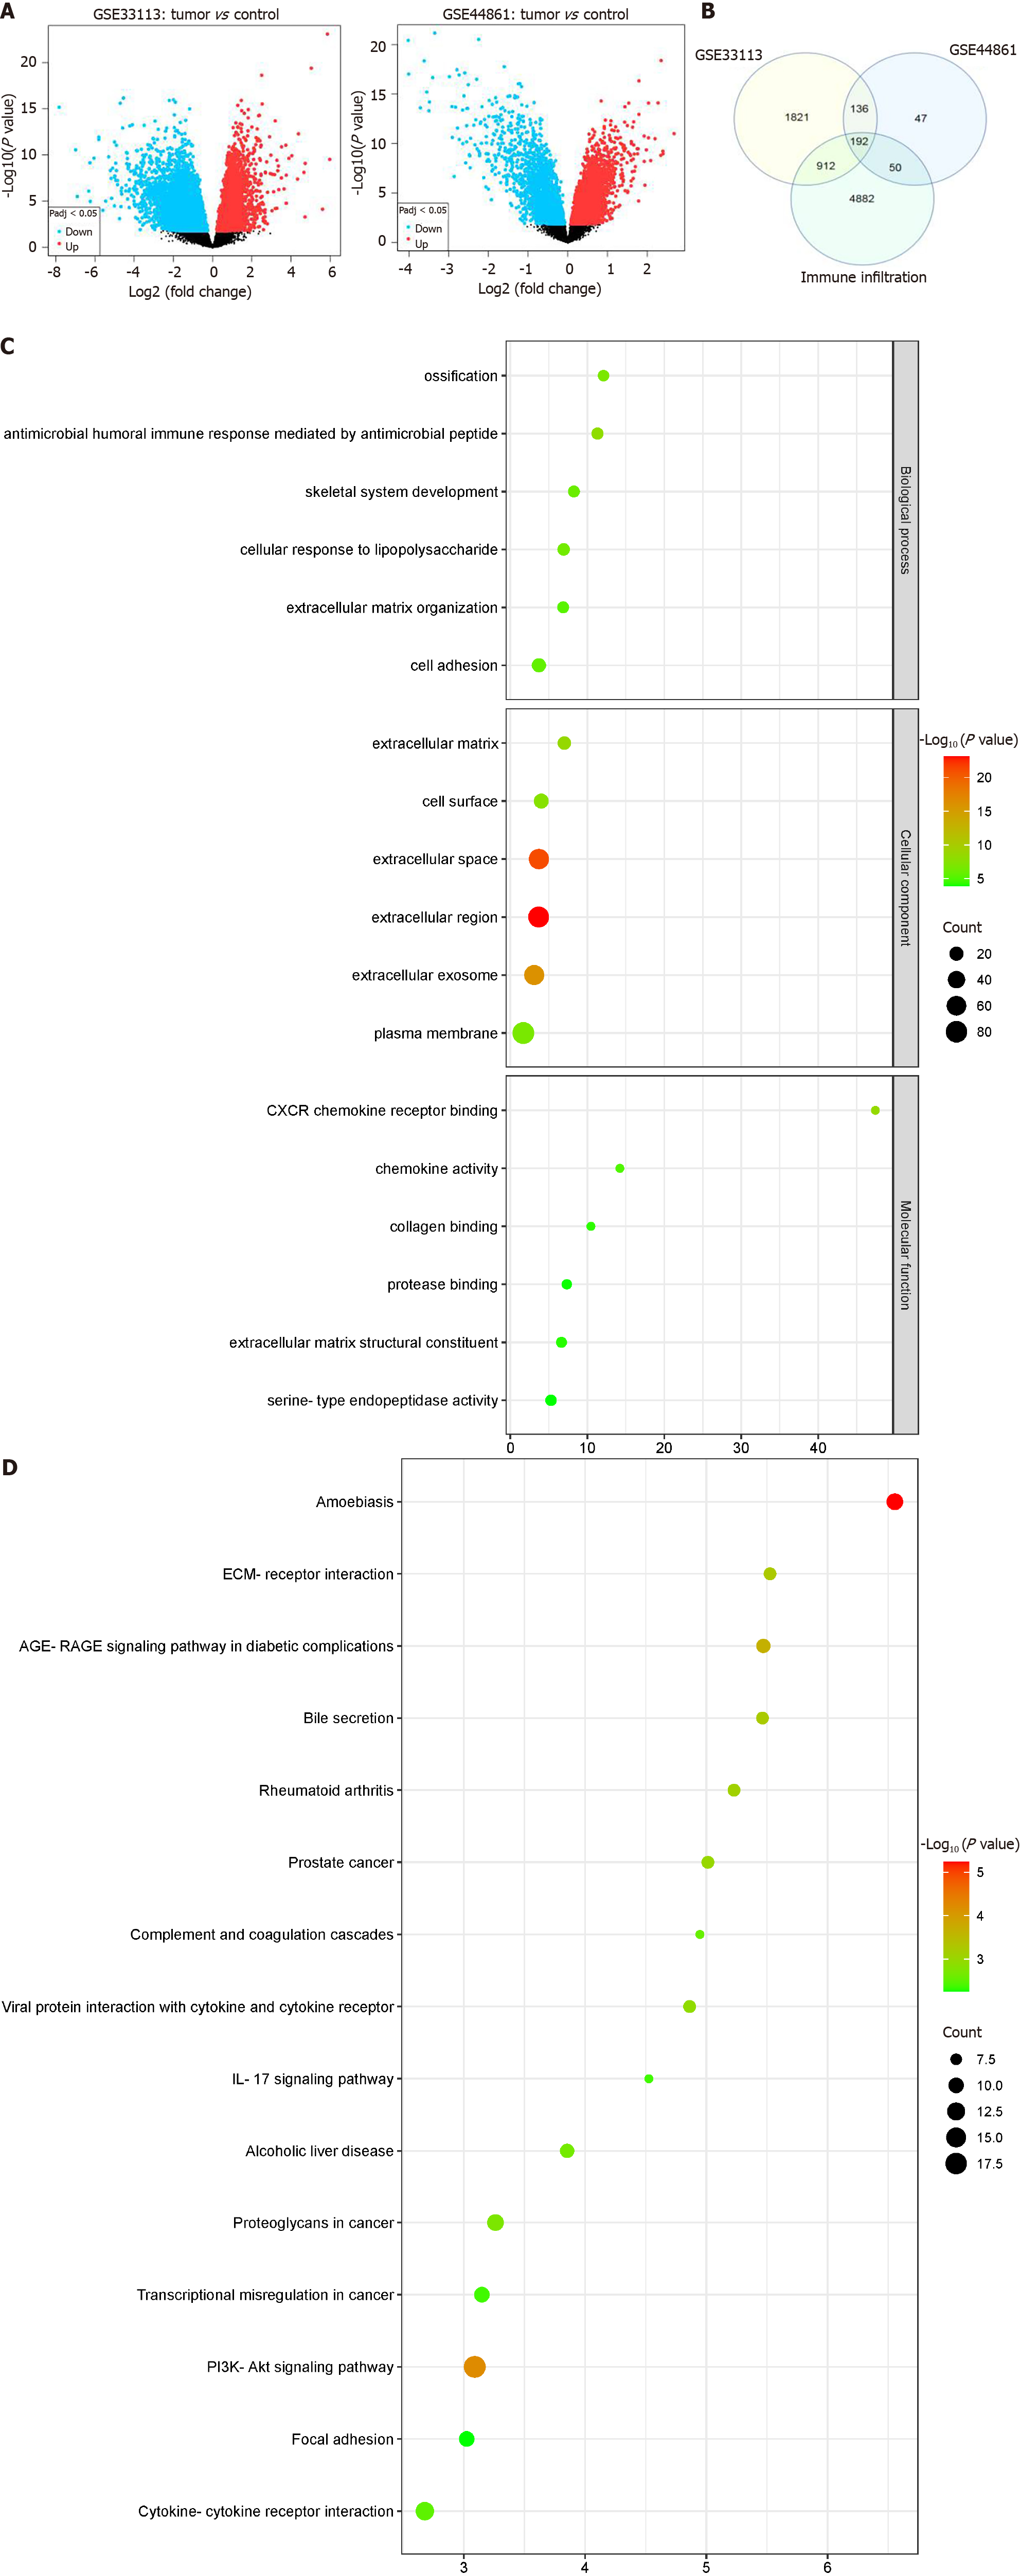
Figure 1 Immune infiltration-associated differentially expressed genes were screened and functional enrichment analysis.
A: Volcano plot of differentially expressed genes (DEGs) between tumor and control in GSE33113 and GSE44861 datasets, respectively. Horizontal coordinates represent log2 fold change and vertical coordinates represent -log10 (P value). Red dots indicate up-regulated genes, blue dots indicate down-regulated genes, and black dots indicate non-significant differentially expressed genes; B: Immune infiltration-associated DEGs were shown in the Venn diagram. DEGs in the GSE44861 dataset were shown in the blue circle, DEGs in the GSE33113 dataset were shown in the yellow circle, and the immune infiltration-related gene set was shown in the green circle. The intersecting parts of the three circles were shared immune infiltration-associated DEGs; C: Bubble chart illustrating the Gene Ontology (GO) enrichment analysis results for the DEGs. Horizontal coordinate represents GO terms, and vertical coordinate represents -log10 (P value); D: The results of Kyoto Encyclopedia of Genes and Genomes functional enrichment analysis for the DEGs were visualized in the Bubble chart. The horizontal coordinate denotes -log10 (P value), and the vertical coordinate denotes the pathway name.
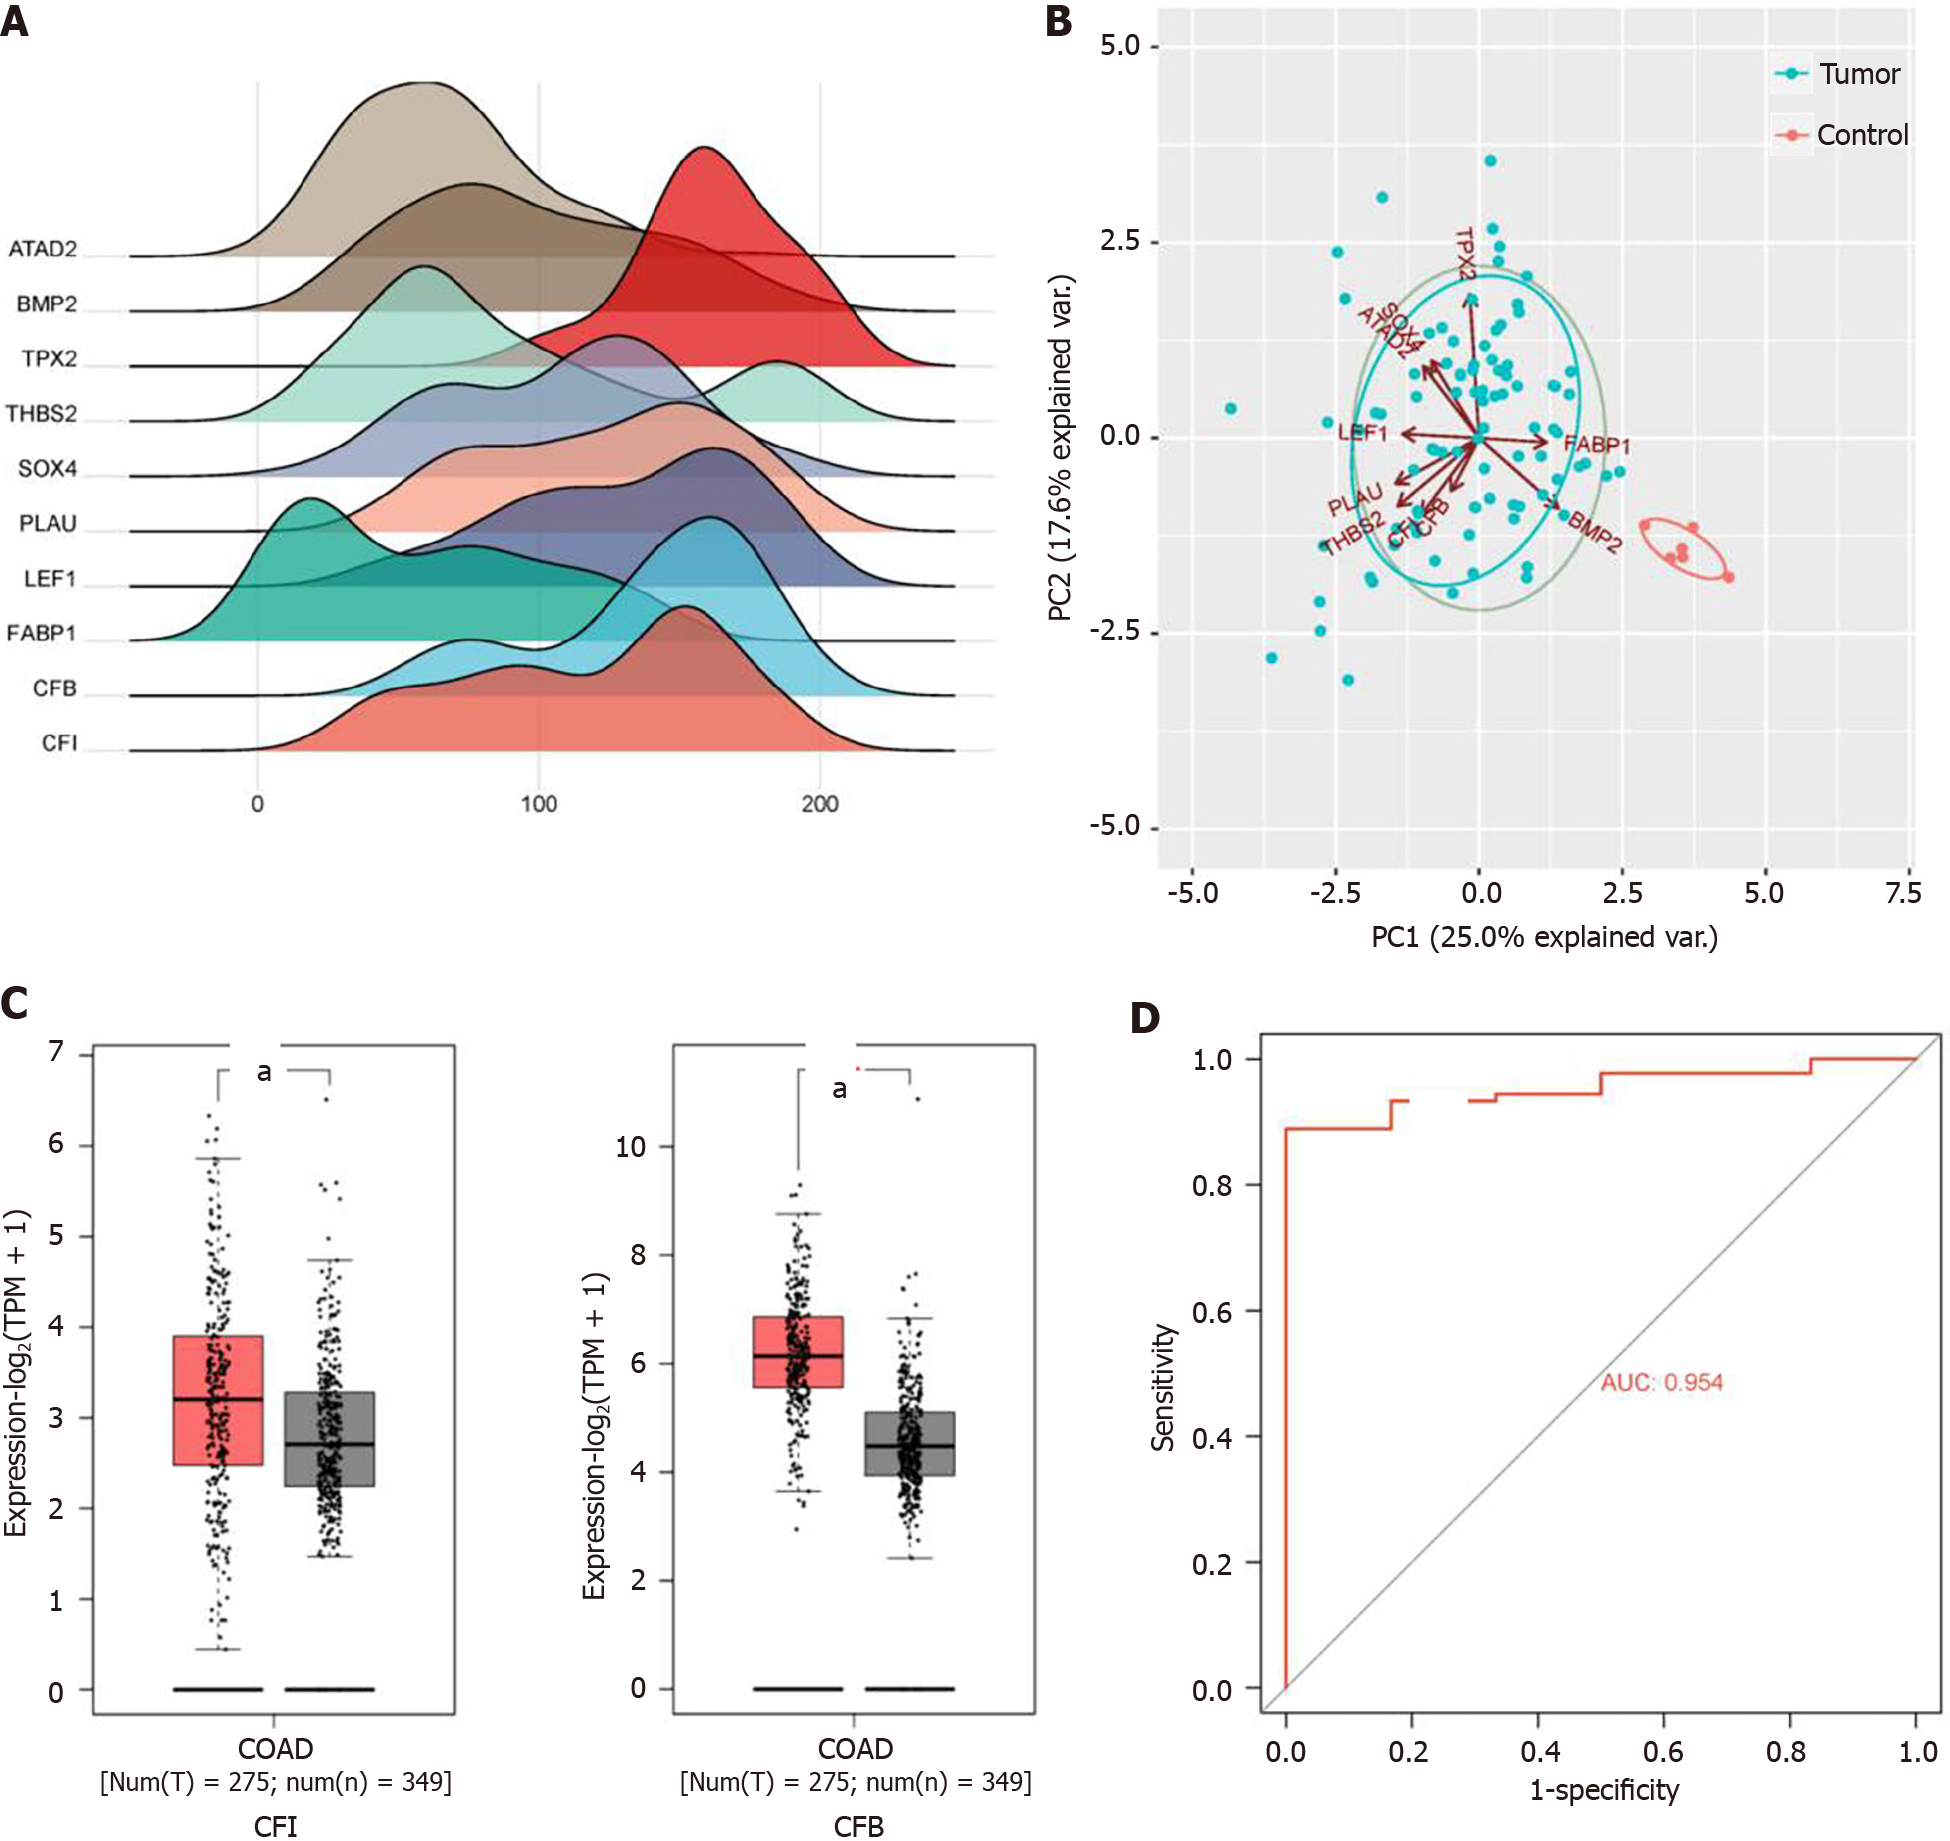
Figure 2 Bioinformatics analysis of key genes.
A: Ridge line graph of hub gene expression. Horizontal coordinate indicates gene expression, and the height of the mountain range graph indicates sample abundance; B: Plot of principal component analysis of hub genes. Dots represent samples, and different colors indicate different subgroups; C: Validation of complement factor I (CFI) and complement factor B expression levels in colon cancer tissues in the GEPIA 2 database. aP < 0.05 vs normal tissues; D: Receiver operating characteristic curve plot of CFI. Horizontal coordinate represents false positive rate and vertical coordinate represents true positive rate. BMP2: Bone morphogenetic protein-2; SOX4: SRY-related high-mobility-group box 4; LEF1: Lymphoid enhancer binding factor 1; FABP1: Fatty acid-binding protein 1; AUC: Area under the receiver operating characteristic curve; CFI: Complement factor I; CFB: Complement factor B.
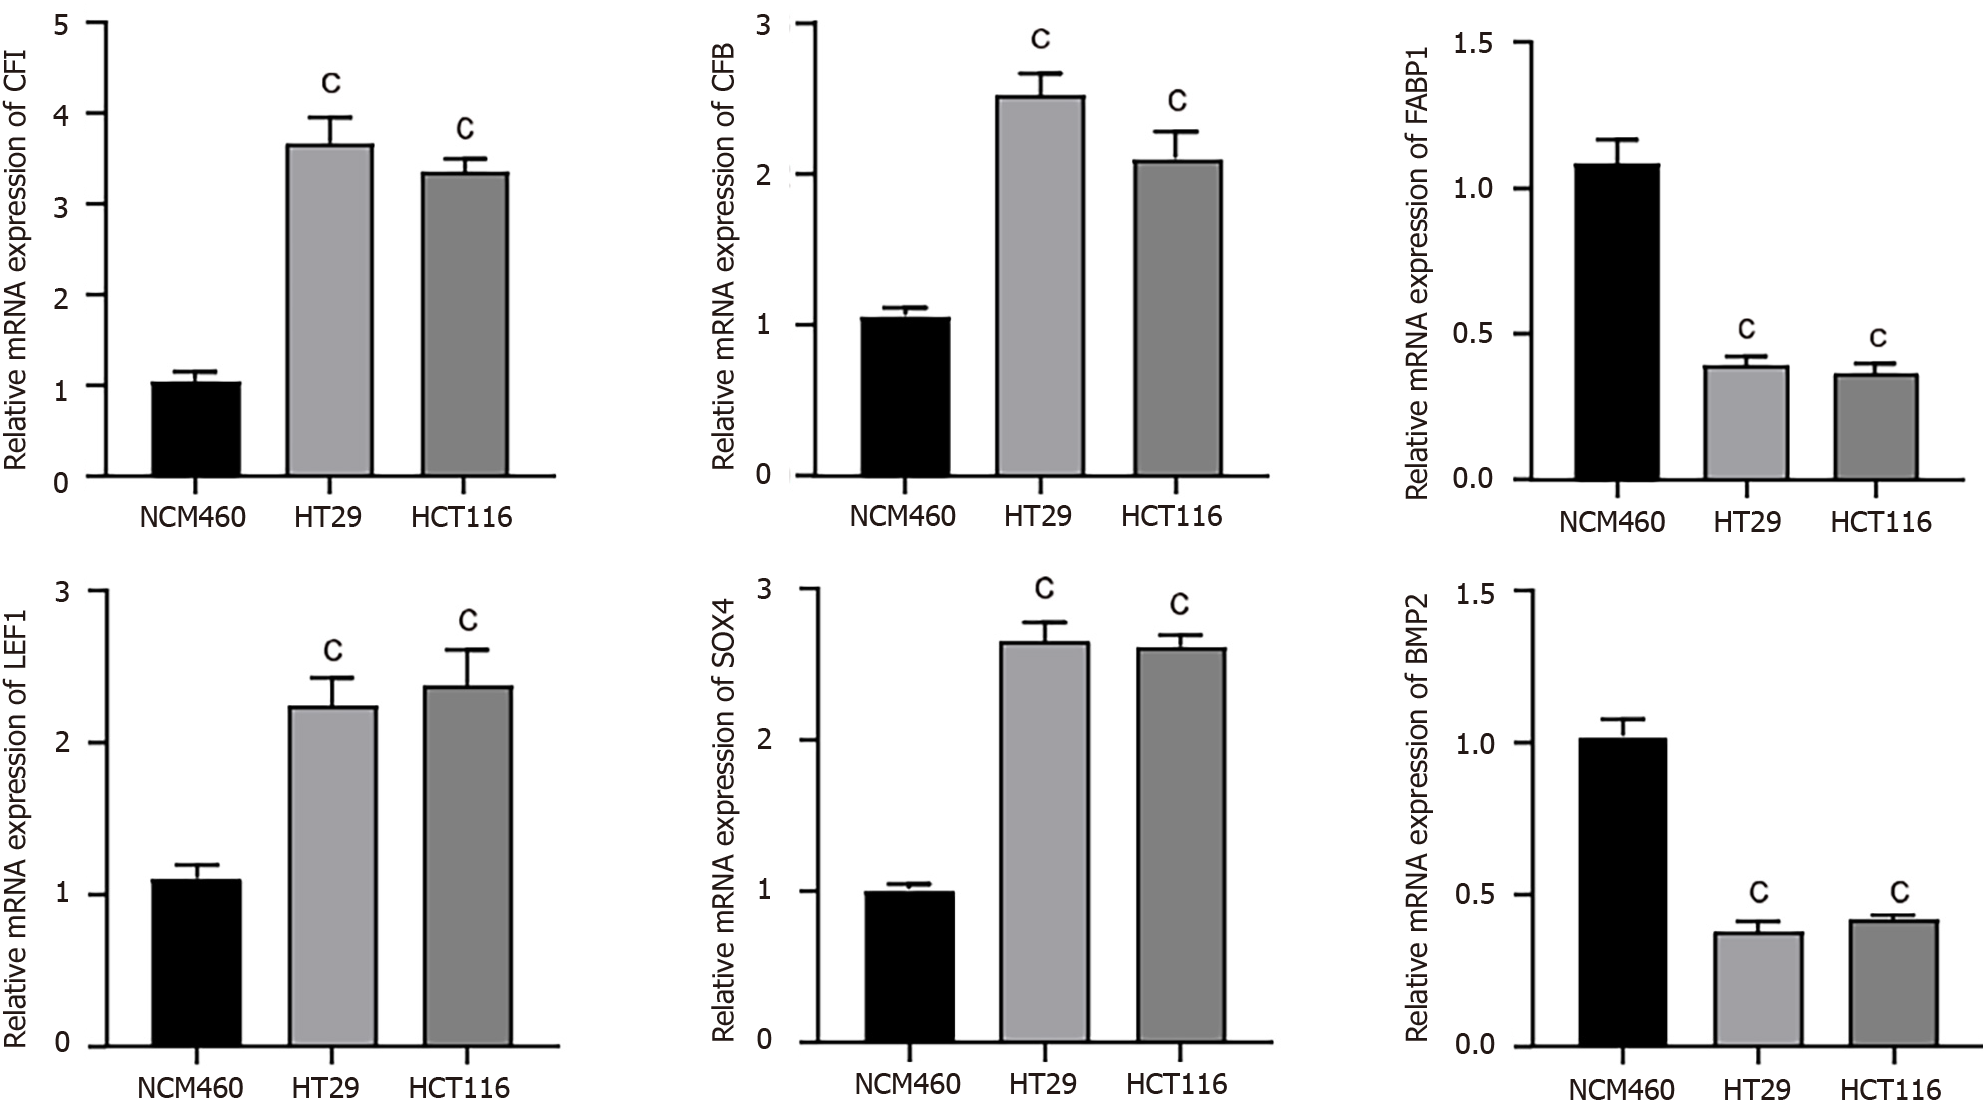
Figure 3 Quantitative reverse transcription polymerase chain reaction was used to validate hub gene expression in colon cancer cells.
cP < 0.001 vs NCM460 group. BMP2: Bone morphogenetic protein-2; SOX4: SRY-related high-mobility-group box 4; LEF1: Lymphoid enhancer binding factor 1; FABP1: Fatty acid-binding protein 1; CFI: Complement factor I; CFB: Complement factor B.
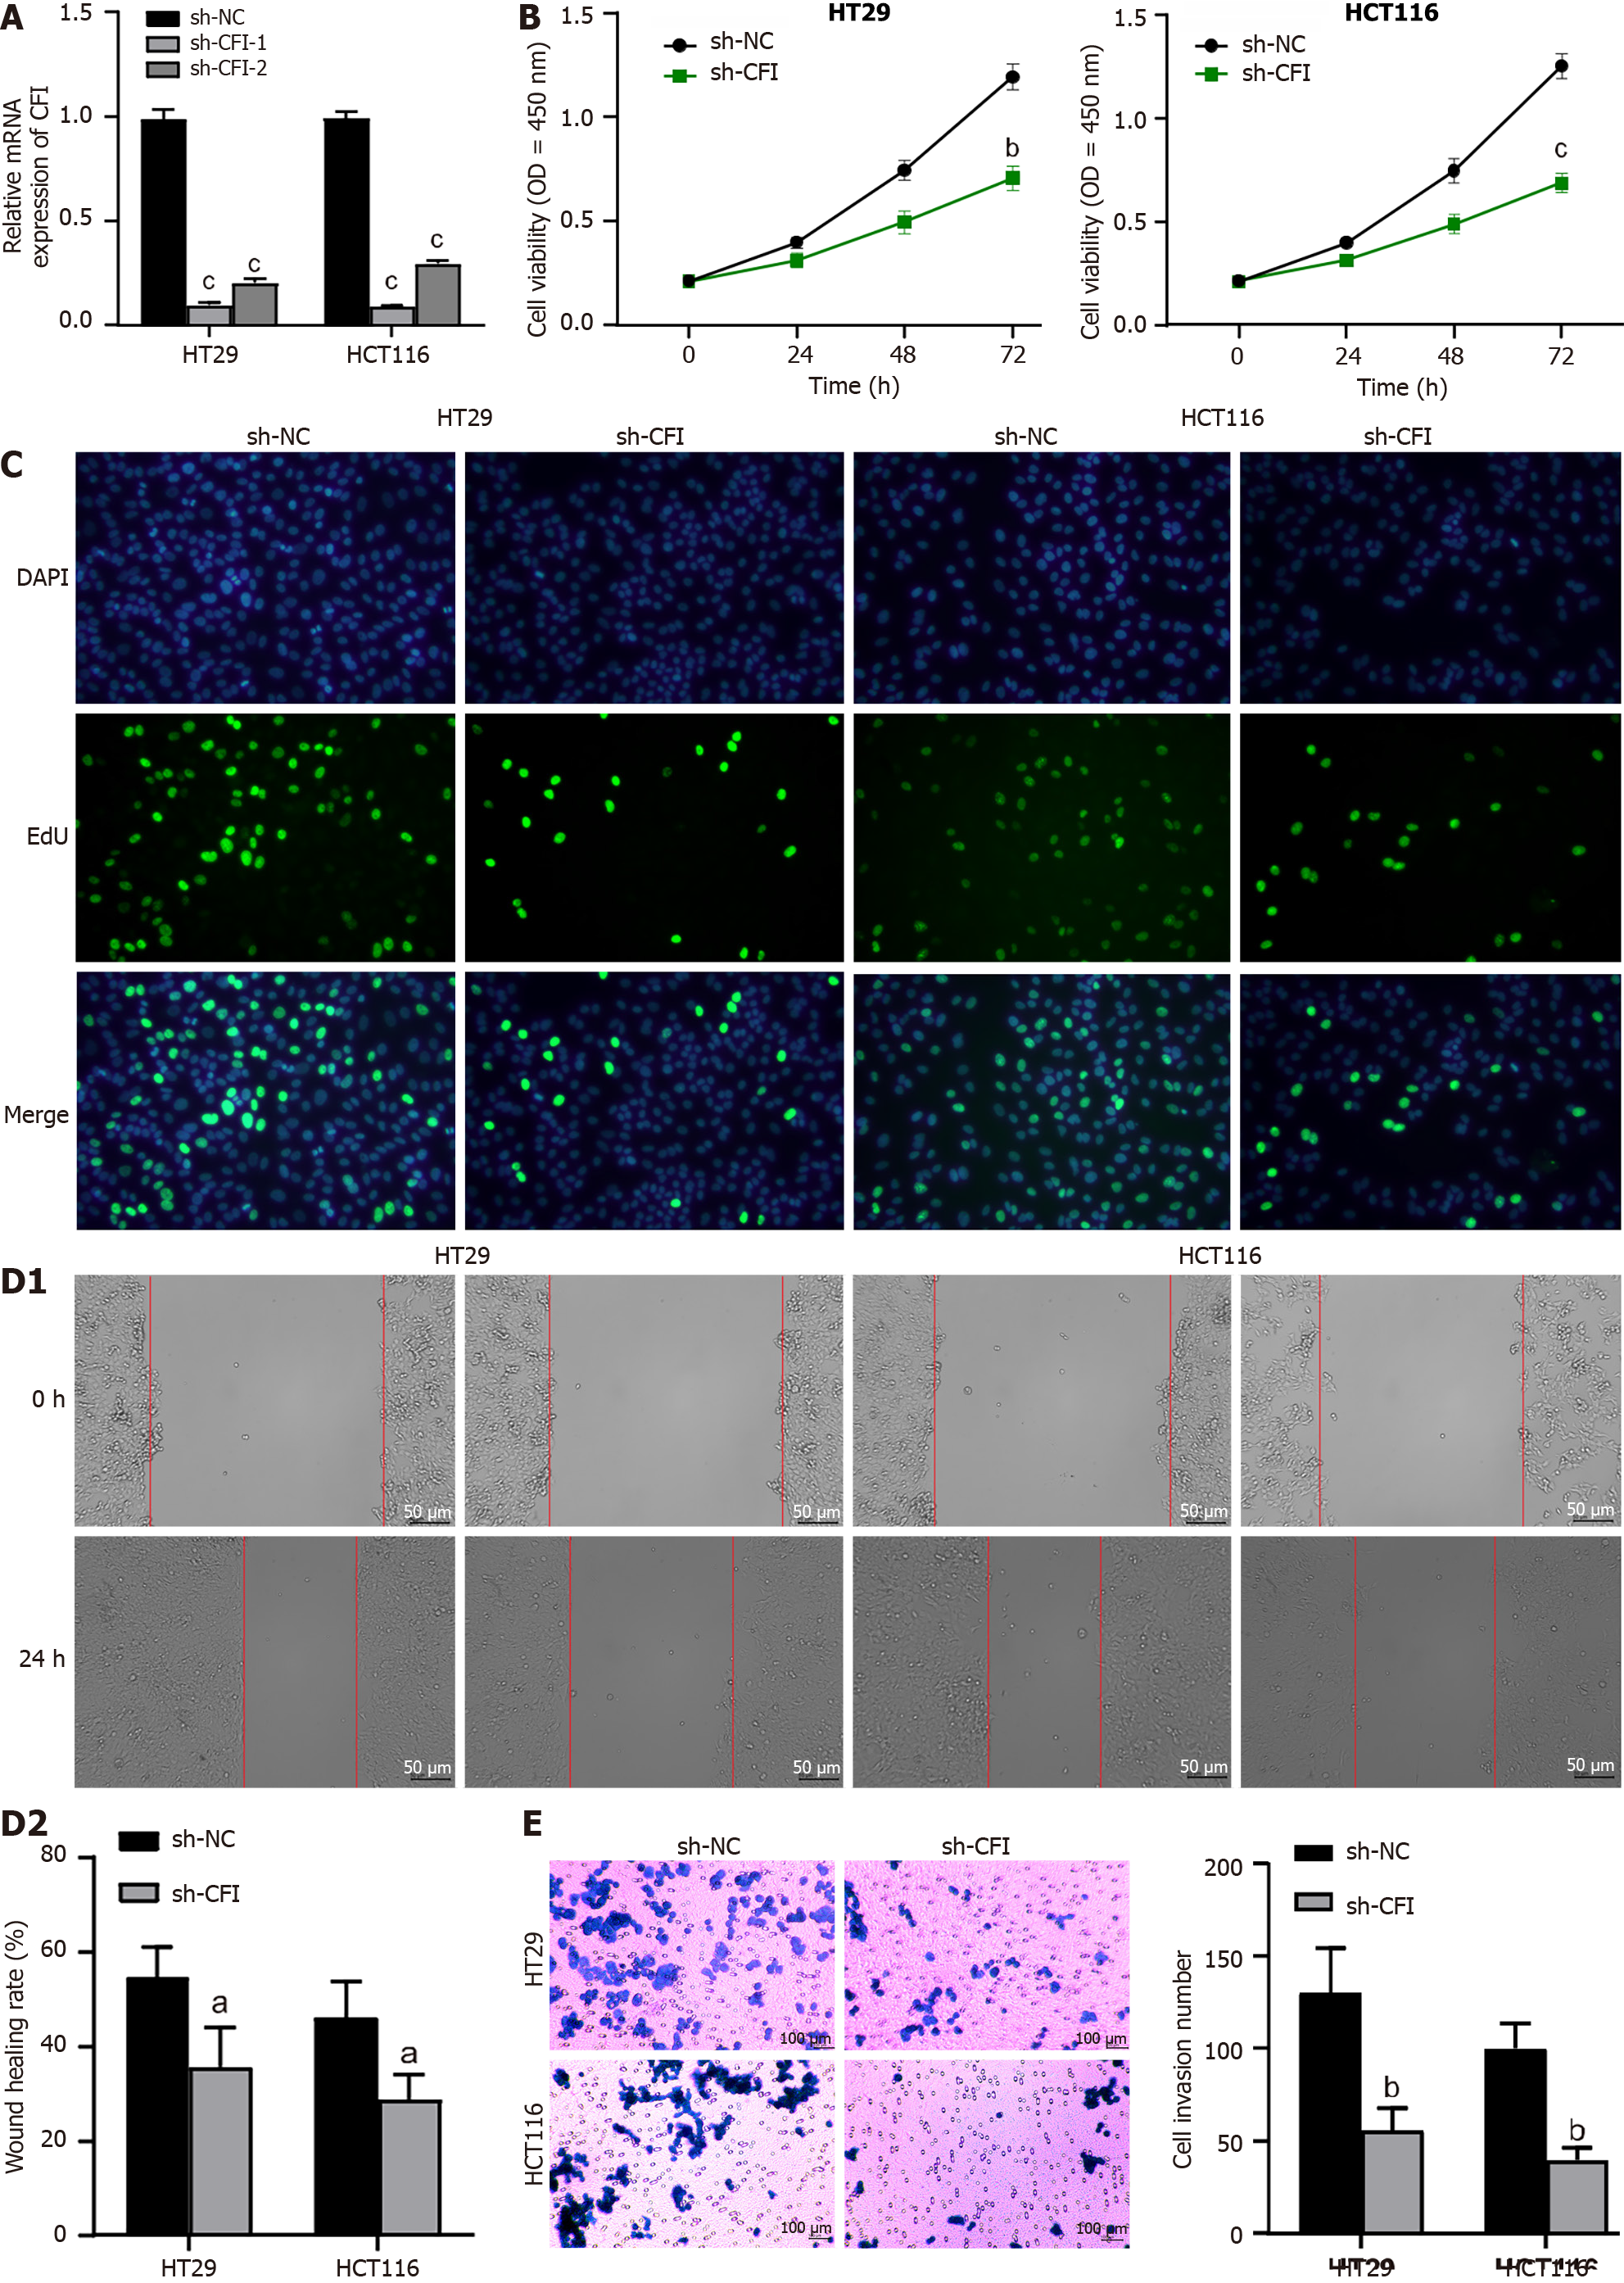
Figure 4 Knockdown of complement factor I inhibited proliferation, migration and invasion of colon cancer cells.
A: Quantitative reverse transcription polymerase chain reaction analysis was conducted to evaluate the effectiveness of complement factor I (CFI) silencing; B: CCK-8 assay was performed to assess the viability of colon cancer cells in each group; C: Cell proliferation capability was measured by 5-ethynyl-2’-deoxyuridine assay; D: At 0 h and 24 h, the area inside the scratched area was measured, and the wound healing assay was used to evaluate cell migration; E: Using the transwell assay, the cellular invasion was assessed. aP < 0.05, bP < 0.01, cP < 0.001 vs sh-NC group. CFI: Complement factor I; EdU: 5-ethynyl-2’-deoxyuridine.
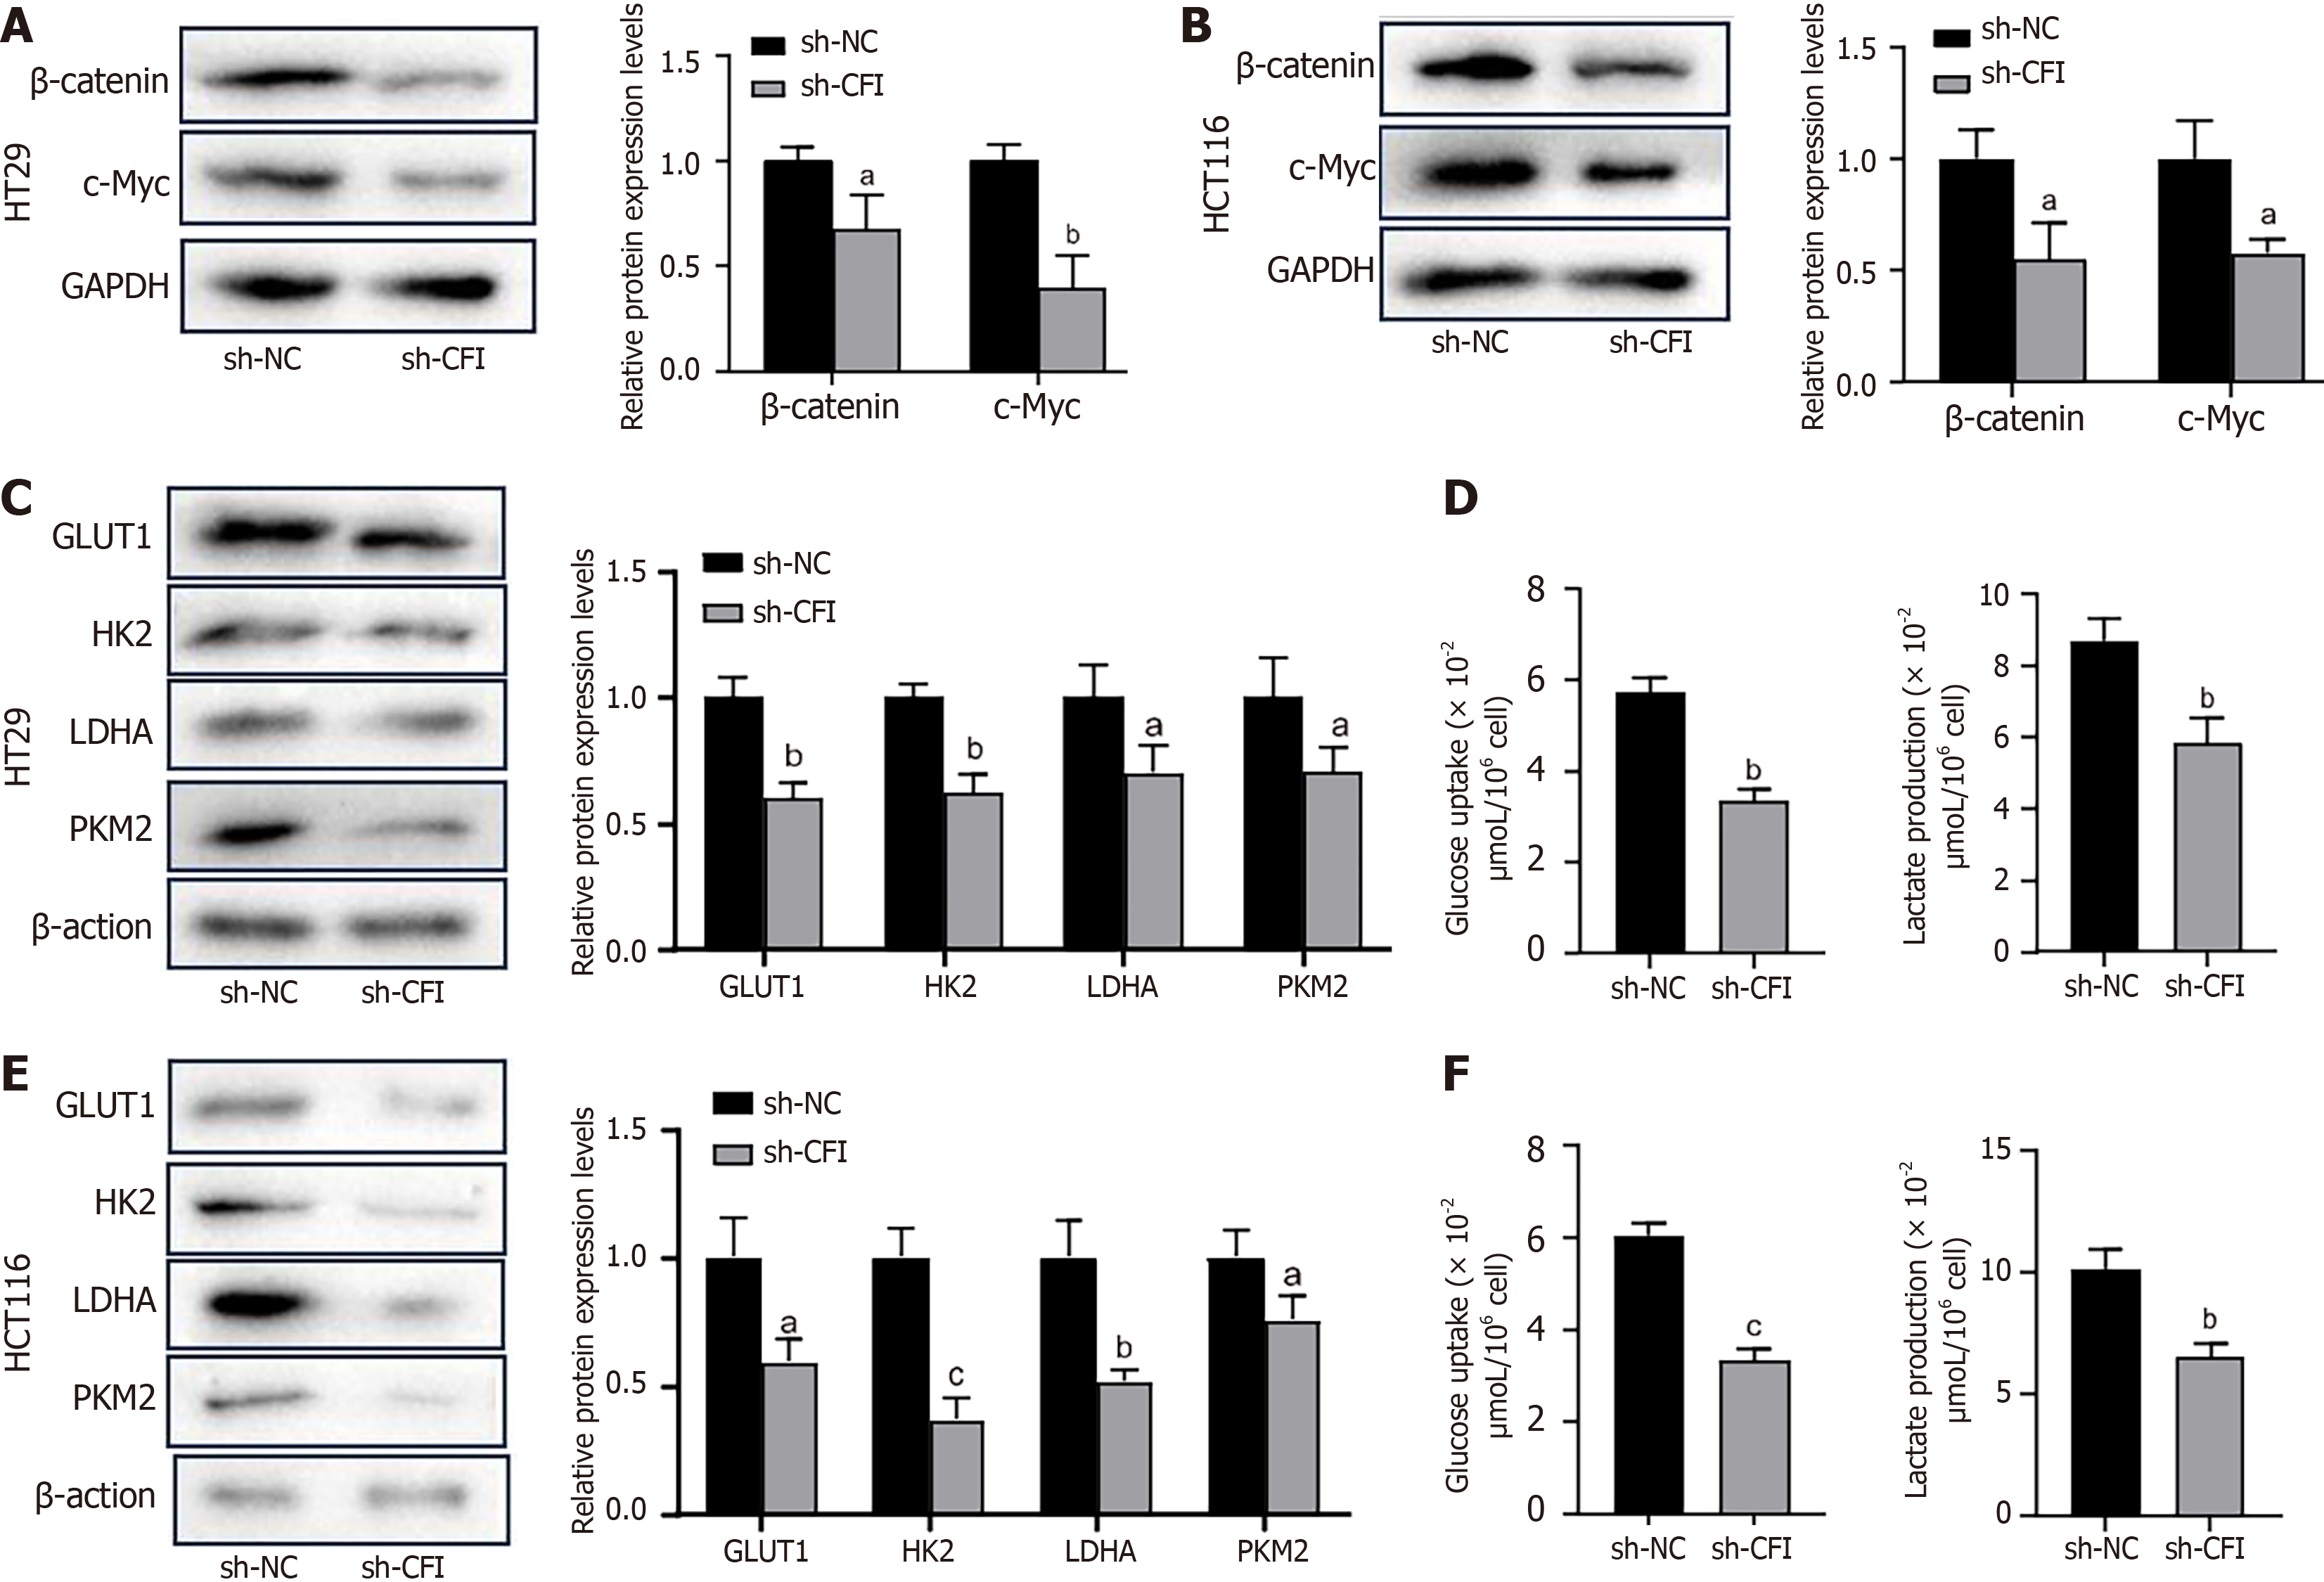
Figure 5 Complement factor I knockdown inhibits Wnt/β-catenin/c-Myc signaling pathway and glycolytic metabolism in colon cancer cells.
A and B: Detection of β-catenin and c-Myc protein expression levels by western blotting after knockdown of complement factor I (CFI) in HT29 cells and HCT116 cells; C-F: The sh-CFI vector was transfected into HT29 and HCT116 colon cancer (CC) cells, and western blotting was used to examine the protein expression levels of key enzymes in the glycolytic pathway, including glucose transporter 1, hexokinase 2, lactate dehydrogenase A and pyruvate kinase M2 (C and E); glucose uptake and lactate production in HT29 and HCT116 CC cells (D and F). aP < 0.05, bP < 0.01, cP < 0.001 vs sh-NC group. CFI: Complement factor I; GLUT1: Glucose transporter 1; HK2: Hexokinase 2; LDHA: Lactate dehydrogenase A; PKM2: Pyruvate kinase M2.
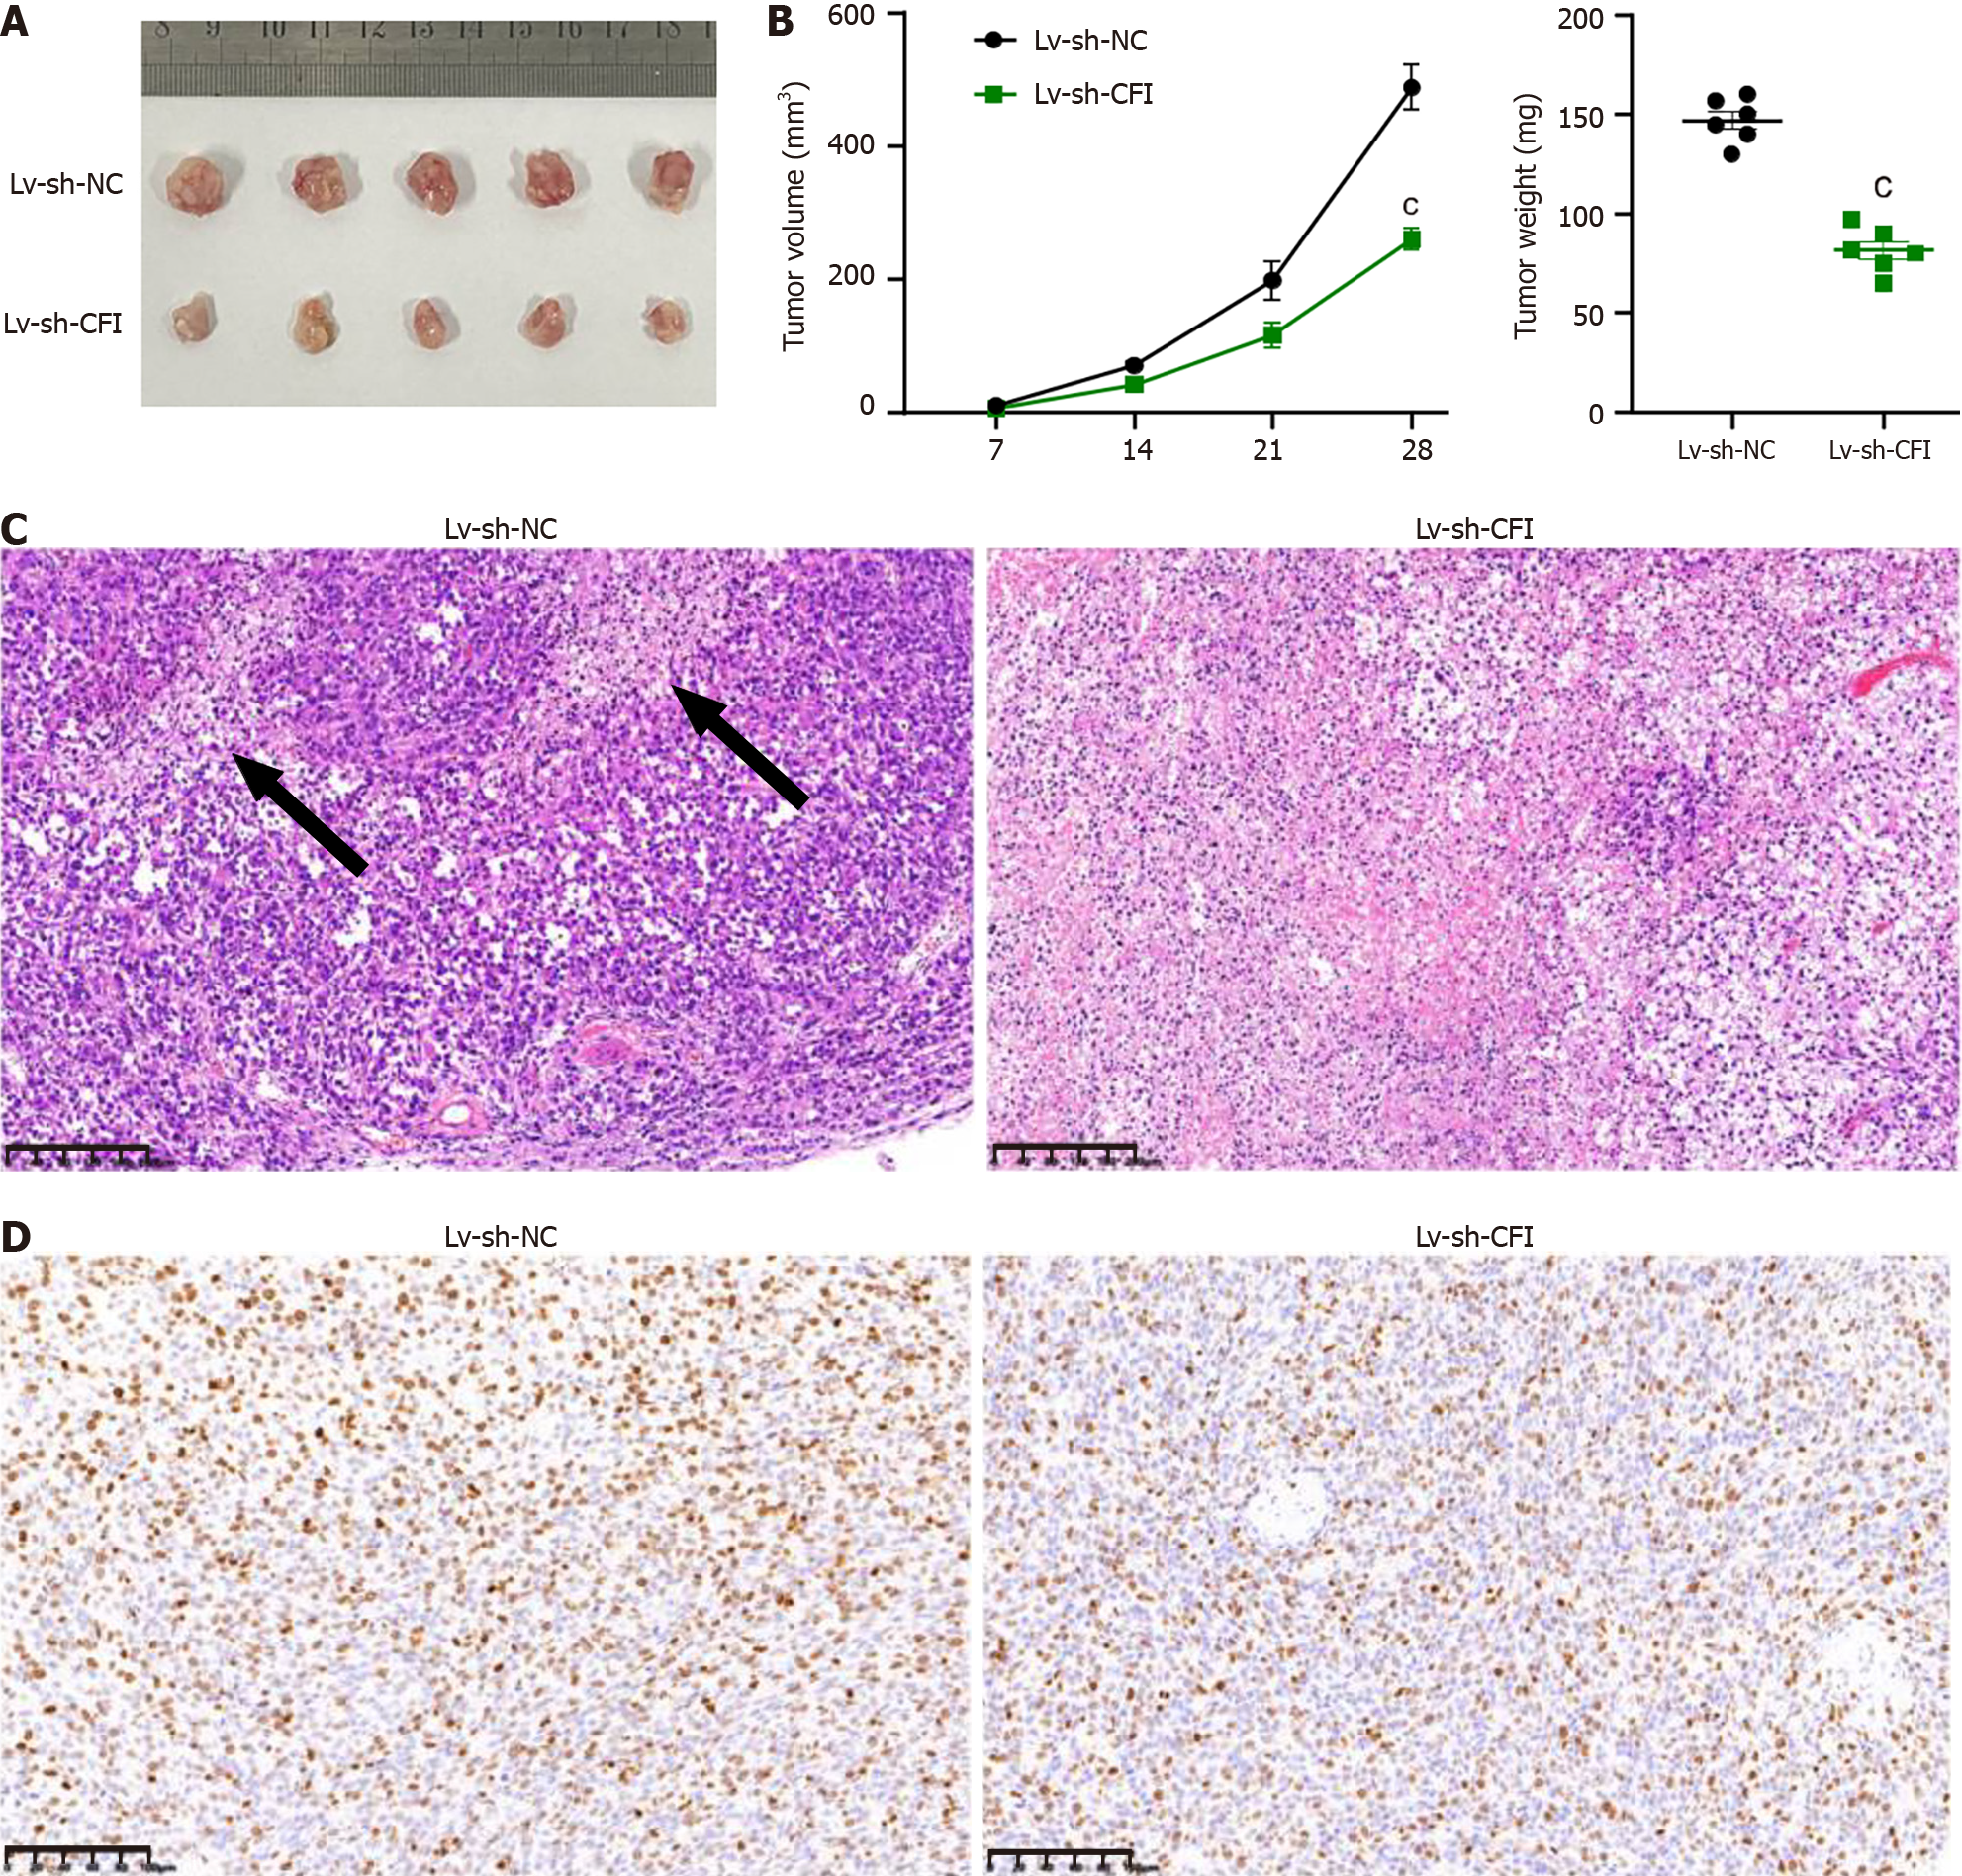
Figure 6 Knockdown of complement factor I inhibited tumor growth in colon cancer model mice.
A: Representative images of colon cancer (CC) xenograft tumors in the Lv-sh-NC and Lv-sh-complement factor I (CFI) groups; B: Tumor growth curves and weight determinations; C: The histological alterations in CC tumors were observed using hematoxylin and eosin staining; D: Immunohistochemistry was employed to measure Ki67 levels in the Lv-sh-NC and Lv-sh-CFI groups. cP < 0.001 vs Lv-sh-NC group (n = 6 mice per group). CFI: Complement factor I.
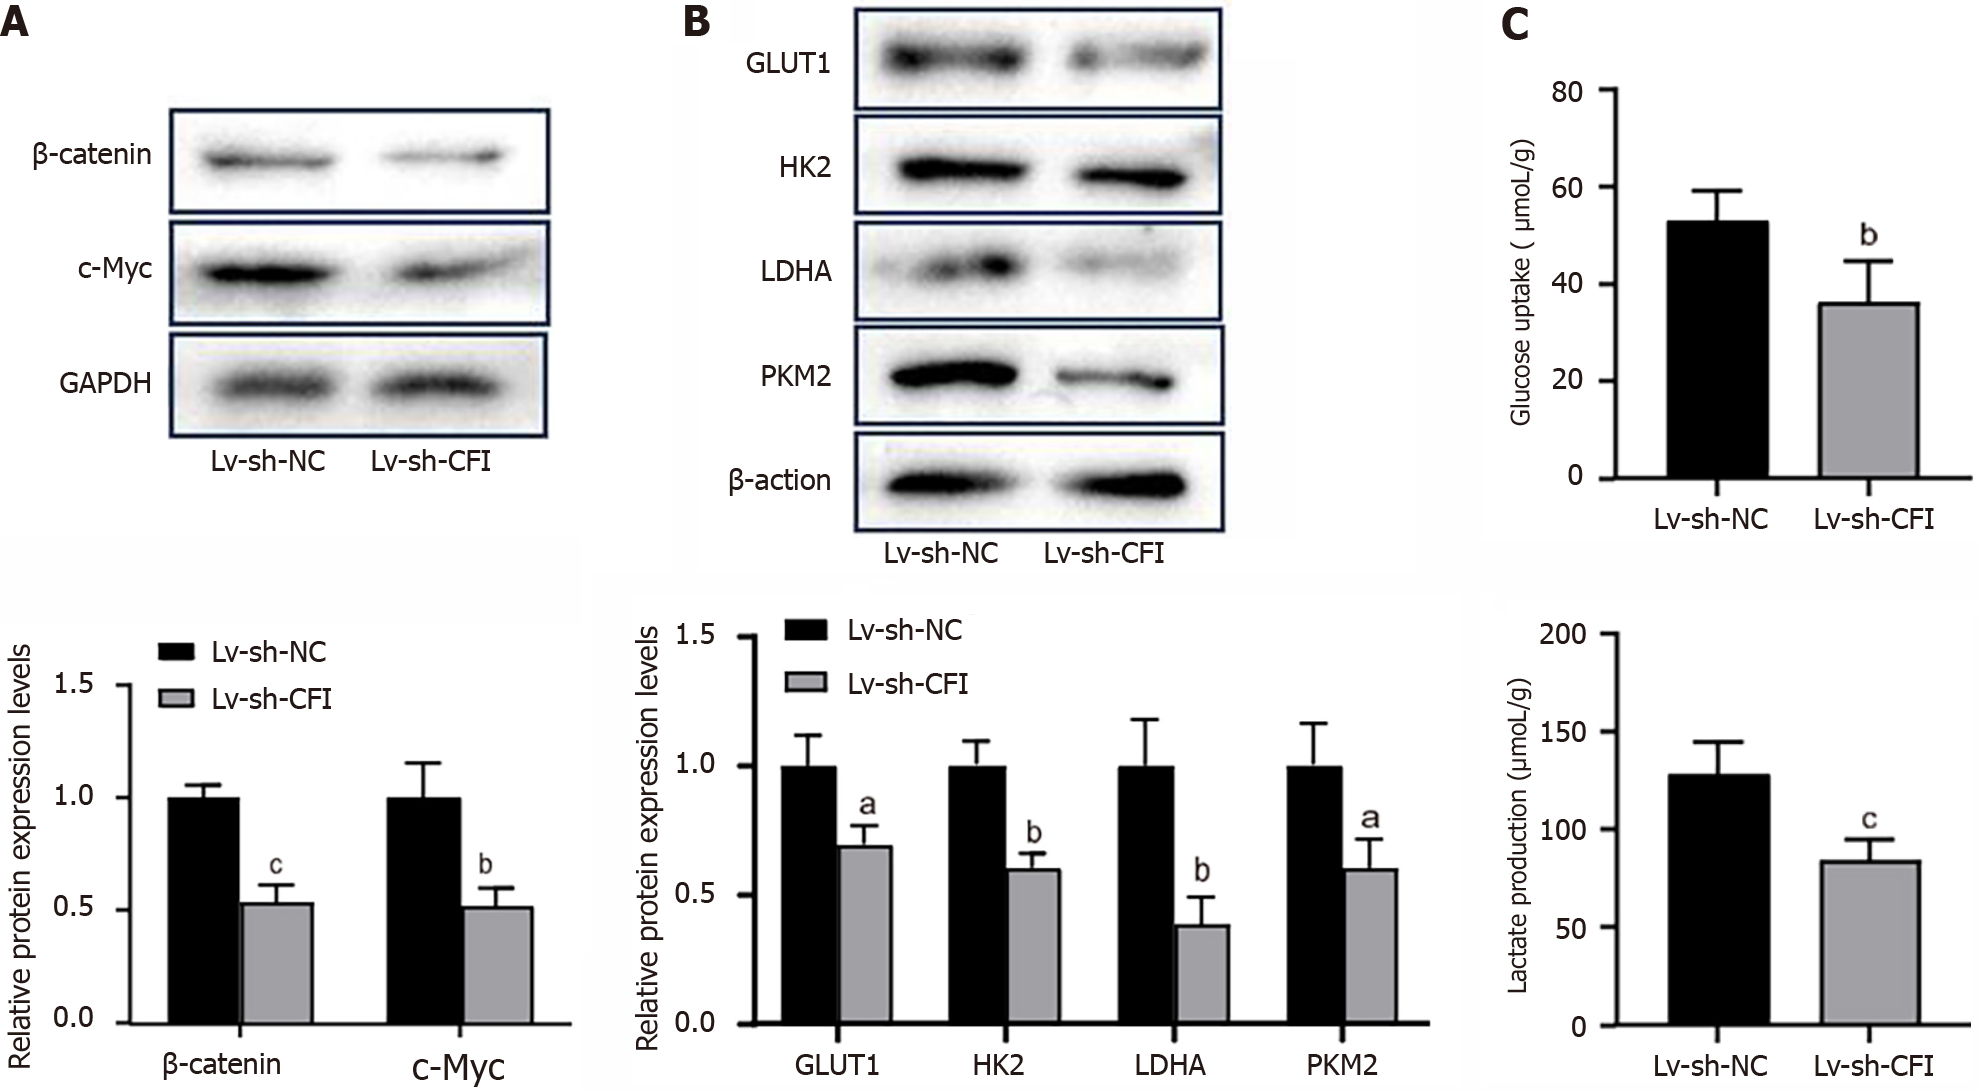
Figure 7 Complement factor I knockdown suppressed Wnt/β-catenin/c-Myc signaling pathway and glycolysis in colon cancer model mice.
A: Western blotting was used to detect the protein expression levels of β-catenin and c-Myc in tumor tissues; B: Protein expression levels of key enzymes of the glycolytic pathway (glucose transporter 1, hexokinase 2, lactate dehydrogenase A and pyruvate kinase M2) were measured by western blot; C: Glucose uptake and lactate production in tumor tissue. aP < 0.05, bP < 0.01, cP < 0.001 vs Lv-sh-NC group (n = 6 mice per group). CFI: Complement factor I; GLUT1: Glucose transporter 1; HK2: Hexokinase 2; LDHA: Lactate dehydrogenase A; PKM2: Pyruvate kinase M2.
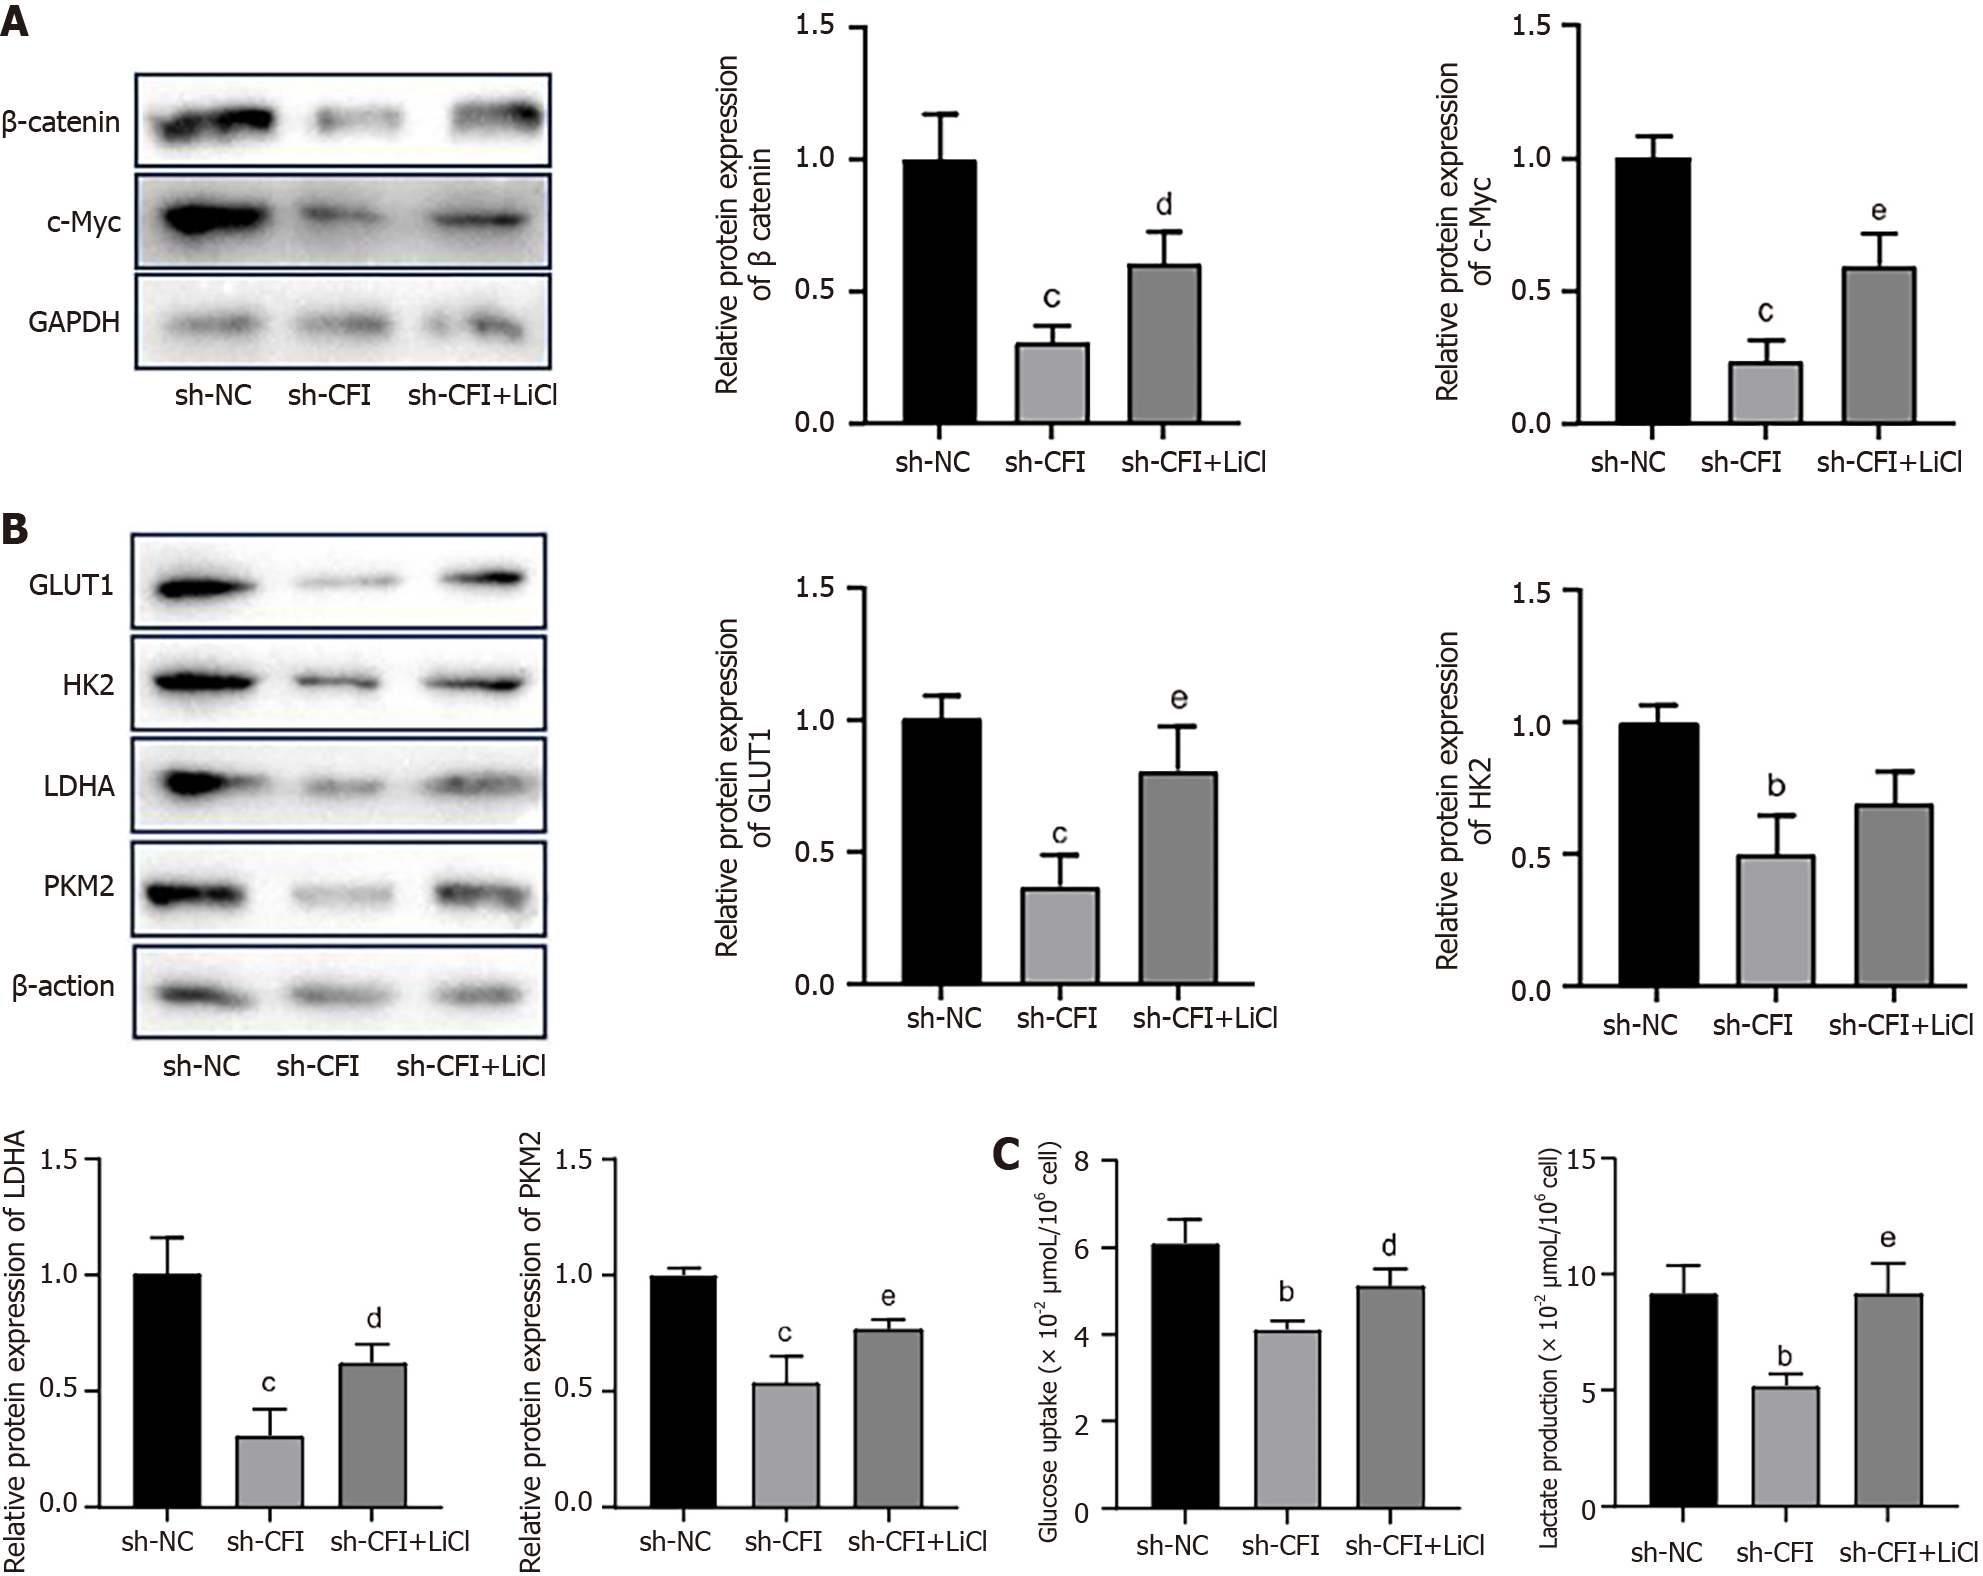
Figure 8 Complement factor I silencing inhibited glycolysis in colon cancer cells by regulating the Wnt/β-catenin/c-Myc signaling pathway.
A and B: Protein expression levels of β-catenin, c-Myc, glucose transporter 1, hexokinase 2, lactate dehydrogenase A, and pyruvate kinase M2 were examined by western blotting in HT29 cells in the sh-NC, sh-CFI, and sh-CFI + lithium chloride groups; C: In HT29 cells, glucose absorption and lactate generation are detected. bP < 0.01, cP < 0.001 vs sh-NC group; dP < 0.05, eP < 0.01 vs sh-CFI group. CFI: Complement factor I; GLUT1: Glucose transporter 1; HK2: Hexokinase 2; LDHA: Lactate dehydrogenase A; PKM2: Pyruvate kinase M2; LiCl: Lithium chloride.
- Citation: Du YJ, Jiang Y, Hou YM, Shi YB. Complement factor I knockdown inhibits colon cancer development by affecting Wnt/β-catenin/c-Myc signaling pathway and glycolysis. World J Gastrointest Oncol 2024; 16(6): 2646-2662
- URL: https://www.wjgnet.com/1948-5204/full/v16/i6/2646.htm
- DOI: https://dx.doi.org/10.4251/wjgo.v16.i6.2646


