Copyright
©The Author(s) 2024.
World J Gastrointest Oncol. Jun 15, 2024; 16(6): 2555-2570
Published online Jun 15, 2024. doi: 10.4251/wjgo.v16.i6.2555
Published online Jun 15, 2024. doi: 10.4251/wjgo.v16.i6.2555
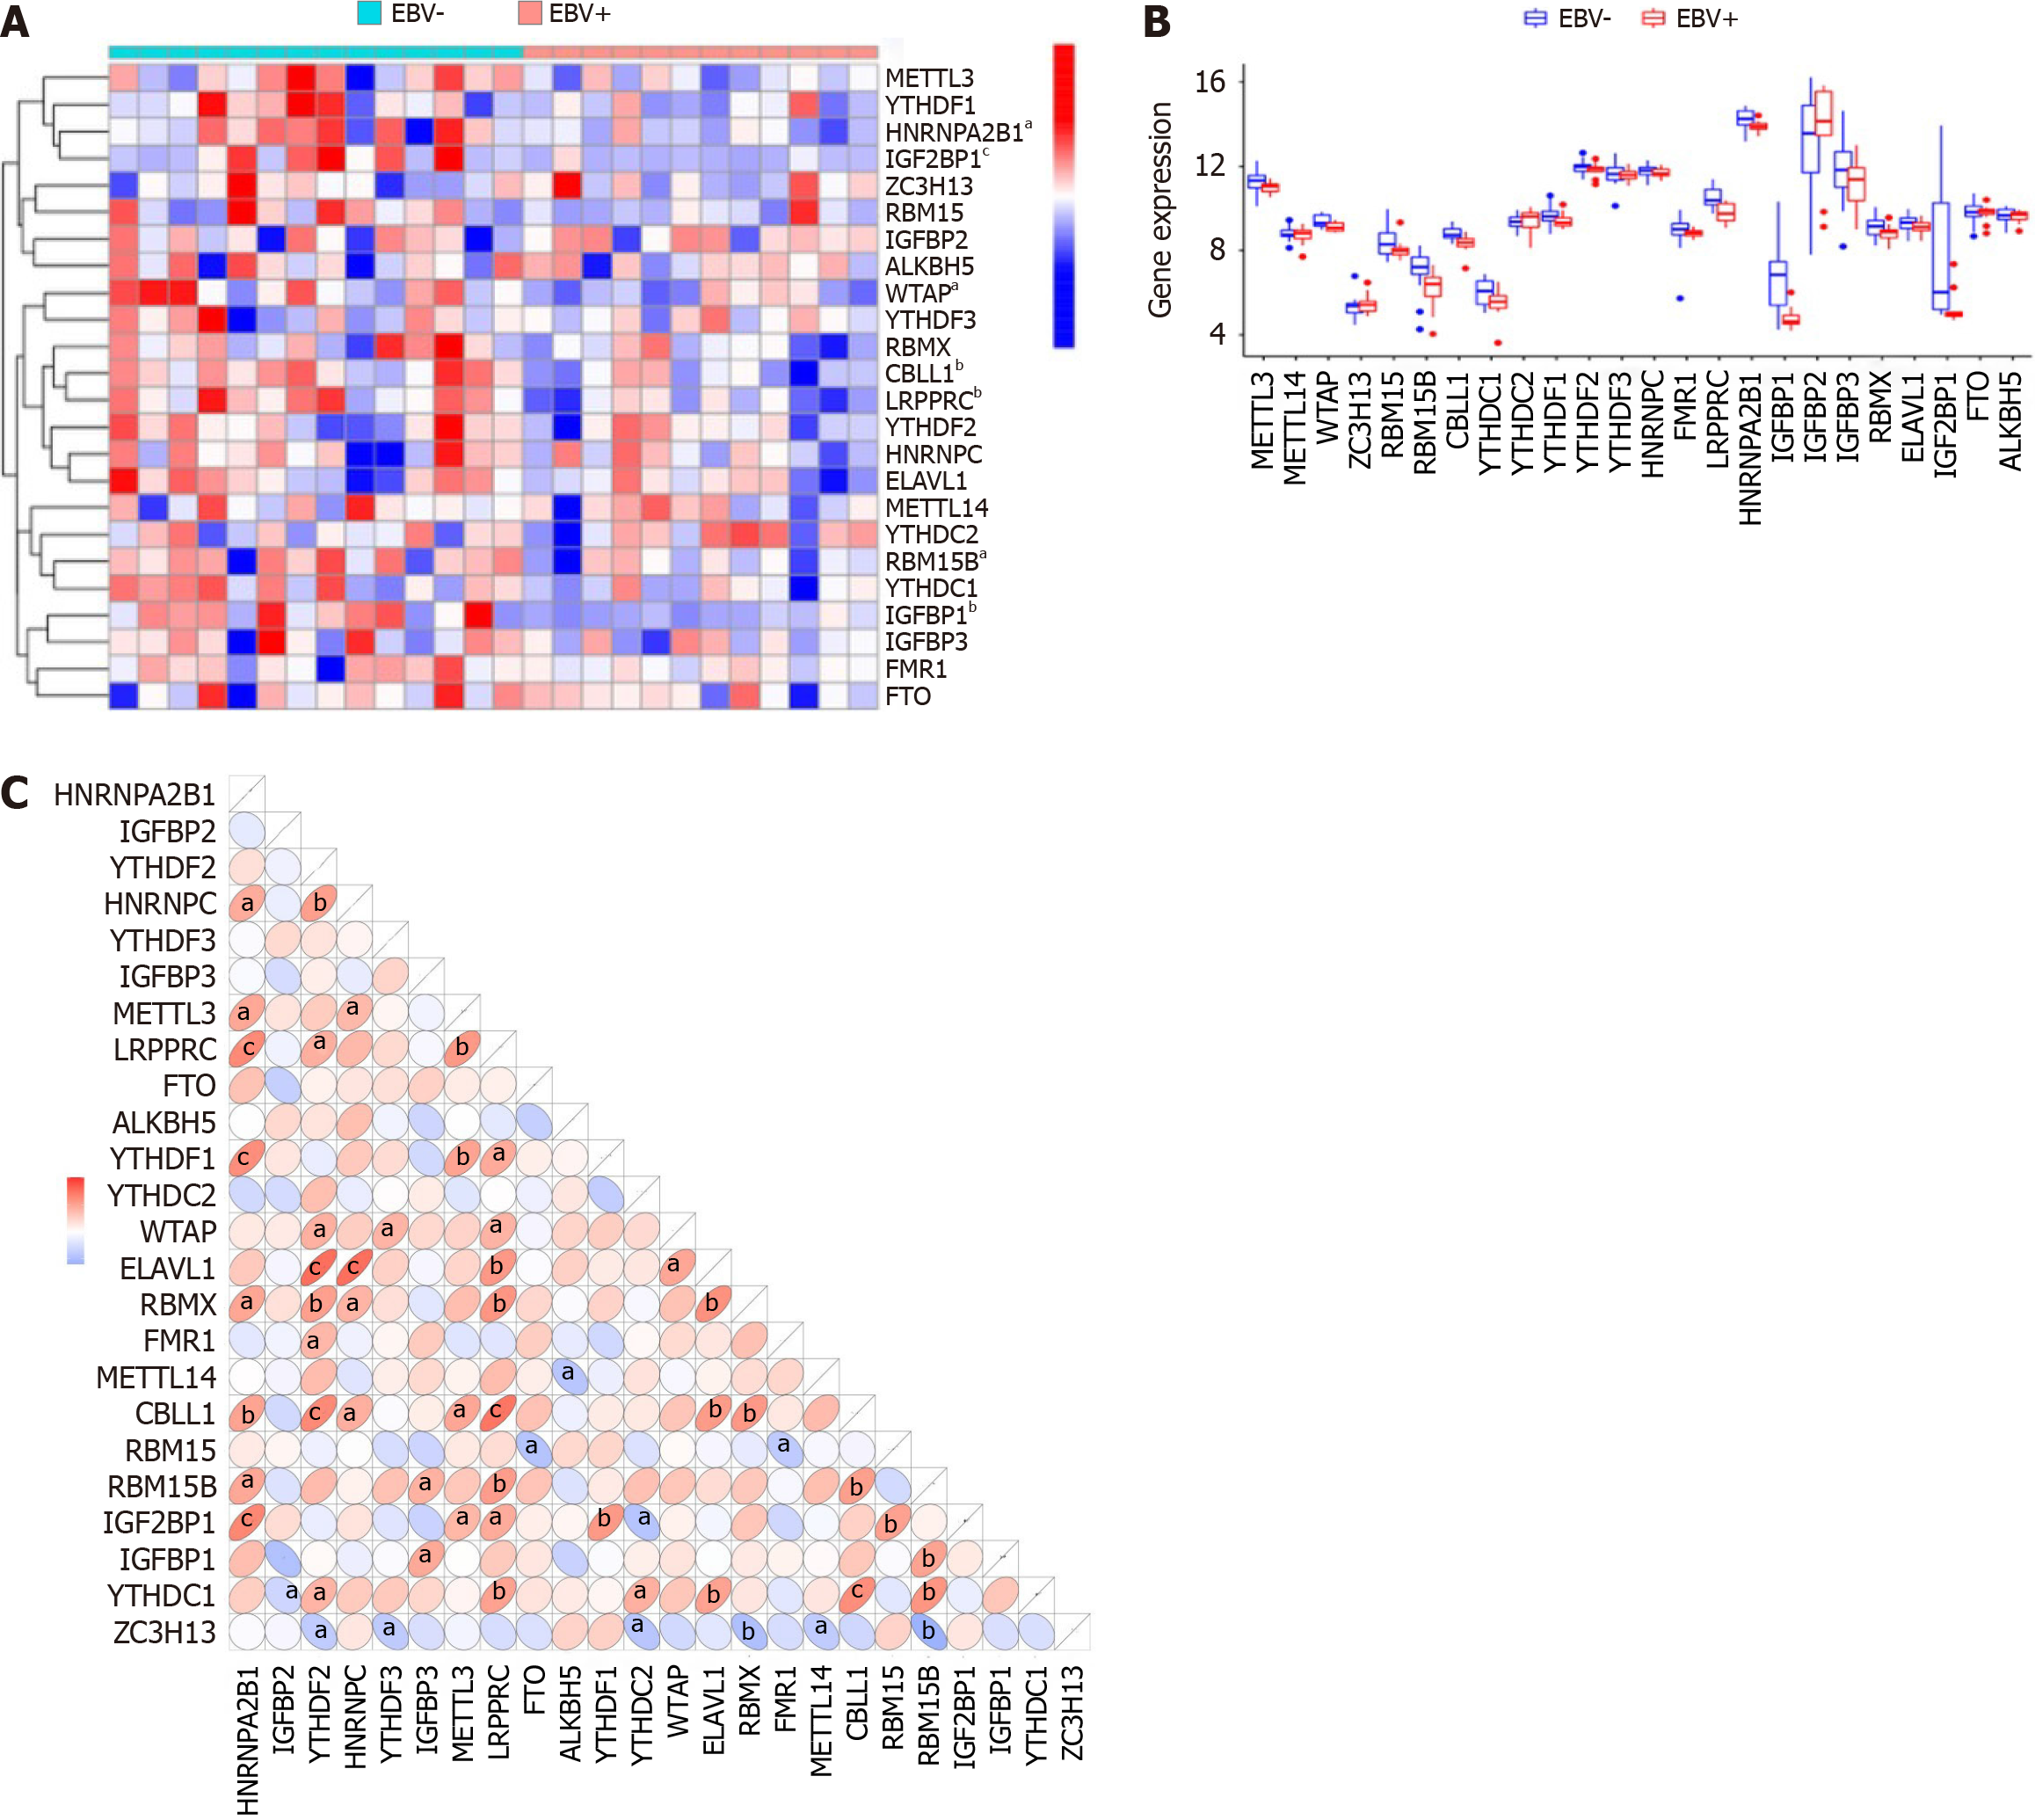
Figure 1 Landscape of the 24 N6-methyladenosine regulators in Epstein-Barr virus-associated gastric cancer.
A: Expression heat map of the 24 N6-methyladenosine (m6A) regulators in Epstein-Barr virus (EBV)-associated gastric cancer (EBVaGC) and EBV-negative gastric cancer (EBVnGC); B: Differential expression histogram of the 24 m6A regulators identified between EBVaGC and EBVnGC; C: The interaction between m6A regulators. aP < 0.05, bP < 0.01, cP < 0.001. EBV: Epstein-Barr virus.
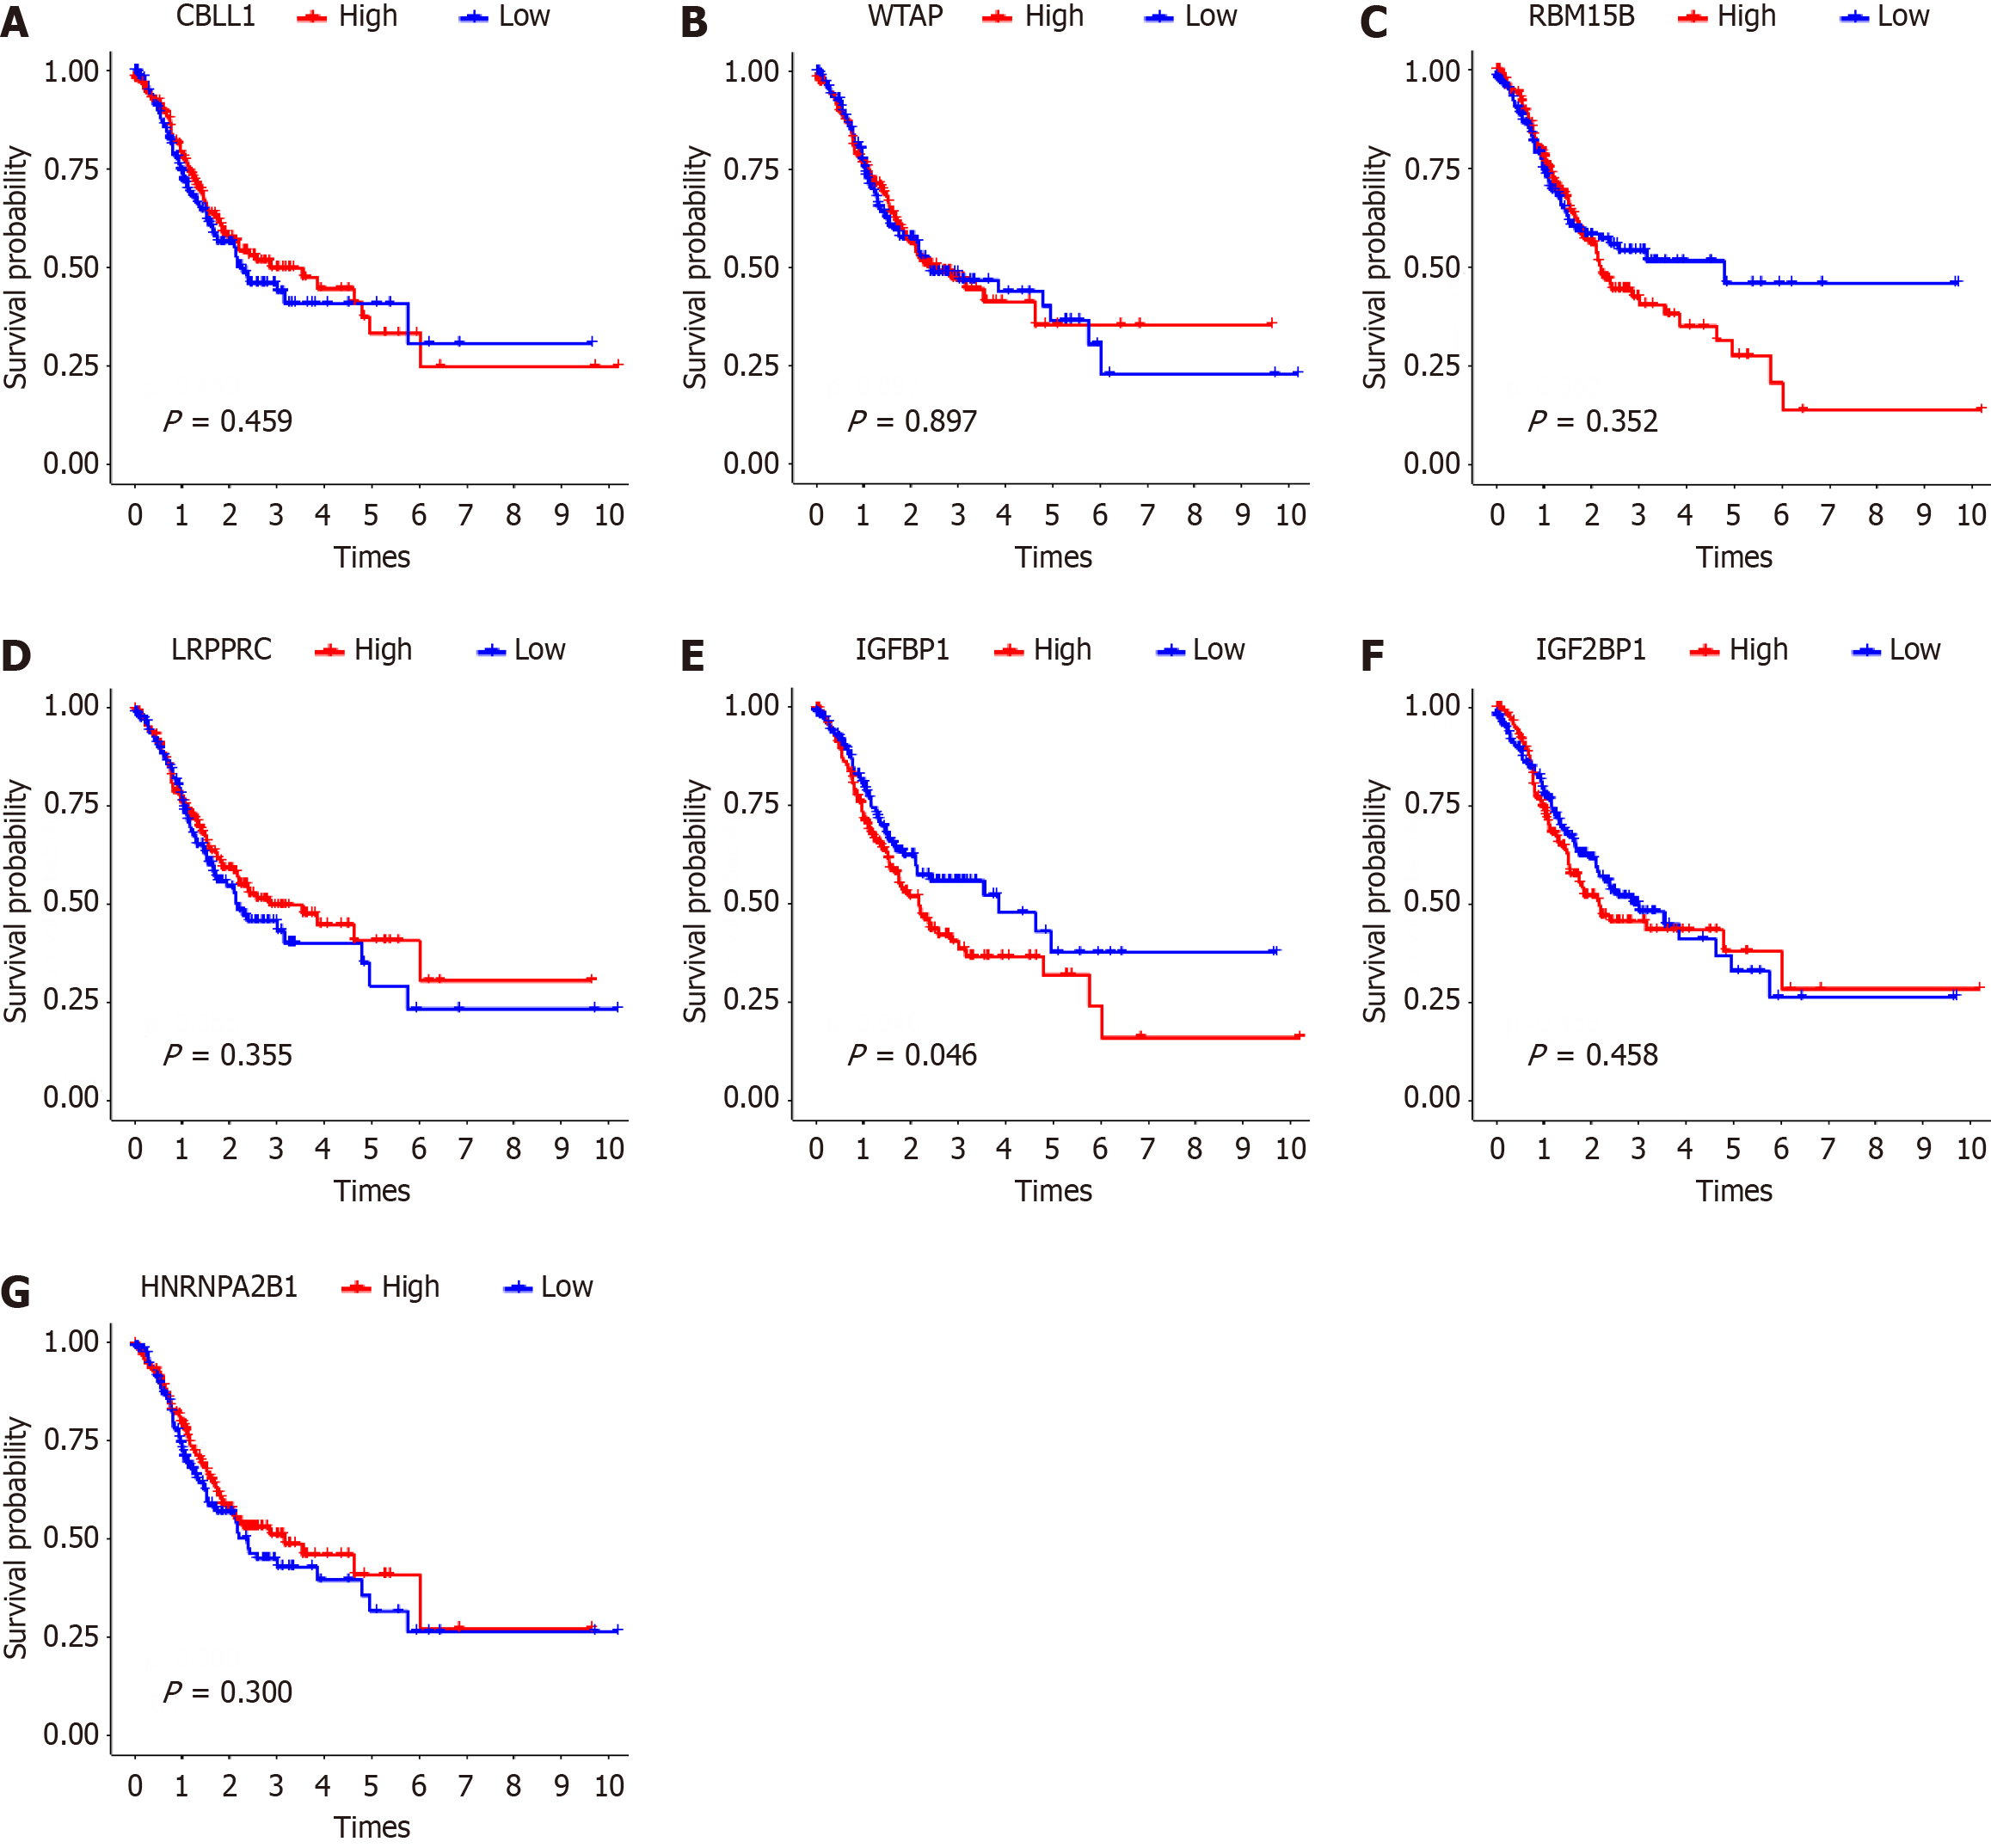
Figure 2 Kaplan-meter survival curves of 7 N6-methyladenosine regulators with differences in Epstein-Barr virus-associated gastric cancer.
A: Heterogeneous nuclear ribonucleoprotein A2B1; B: Insulin like growth factor 2 binding protein 1; C: Insulin like growth factor binding protein 1; D: Leucine rich pentatricopeptide repeat containing; E: RNA Binding Motif Protein 15B; F: CBL proto-oncogene like 1; G: Wilms tumor 1 associated protein. HNRNPA2B1: Heterogeneous nuclear ribonucleoprotein A2B1; IGF2BP1: Insulin like growth factor 2 binding protein 1; IGFBP1: Insulin like growth factor binding protein 1; LRPPRC: Leucine rich pentatricopeptide repeat containing; RBM15B: RNA Binding Motif Protein 15B; CBLL1: CBL proto-oncogene like 1; WTAP: Wilms tumor 1 associated protein.
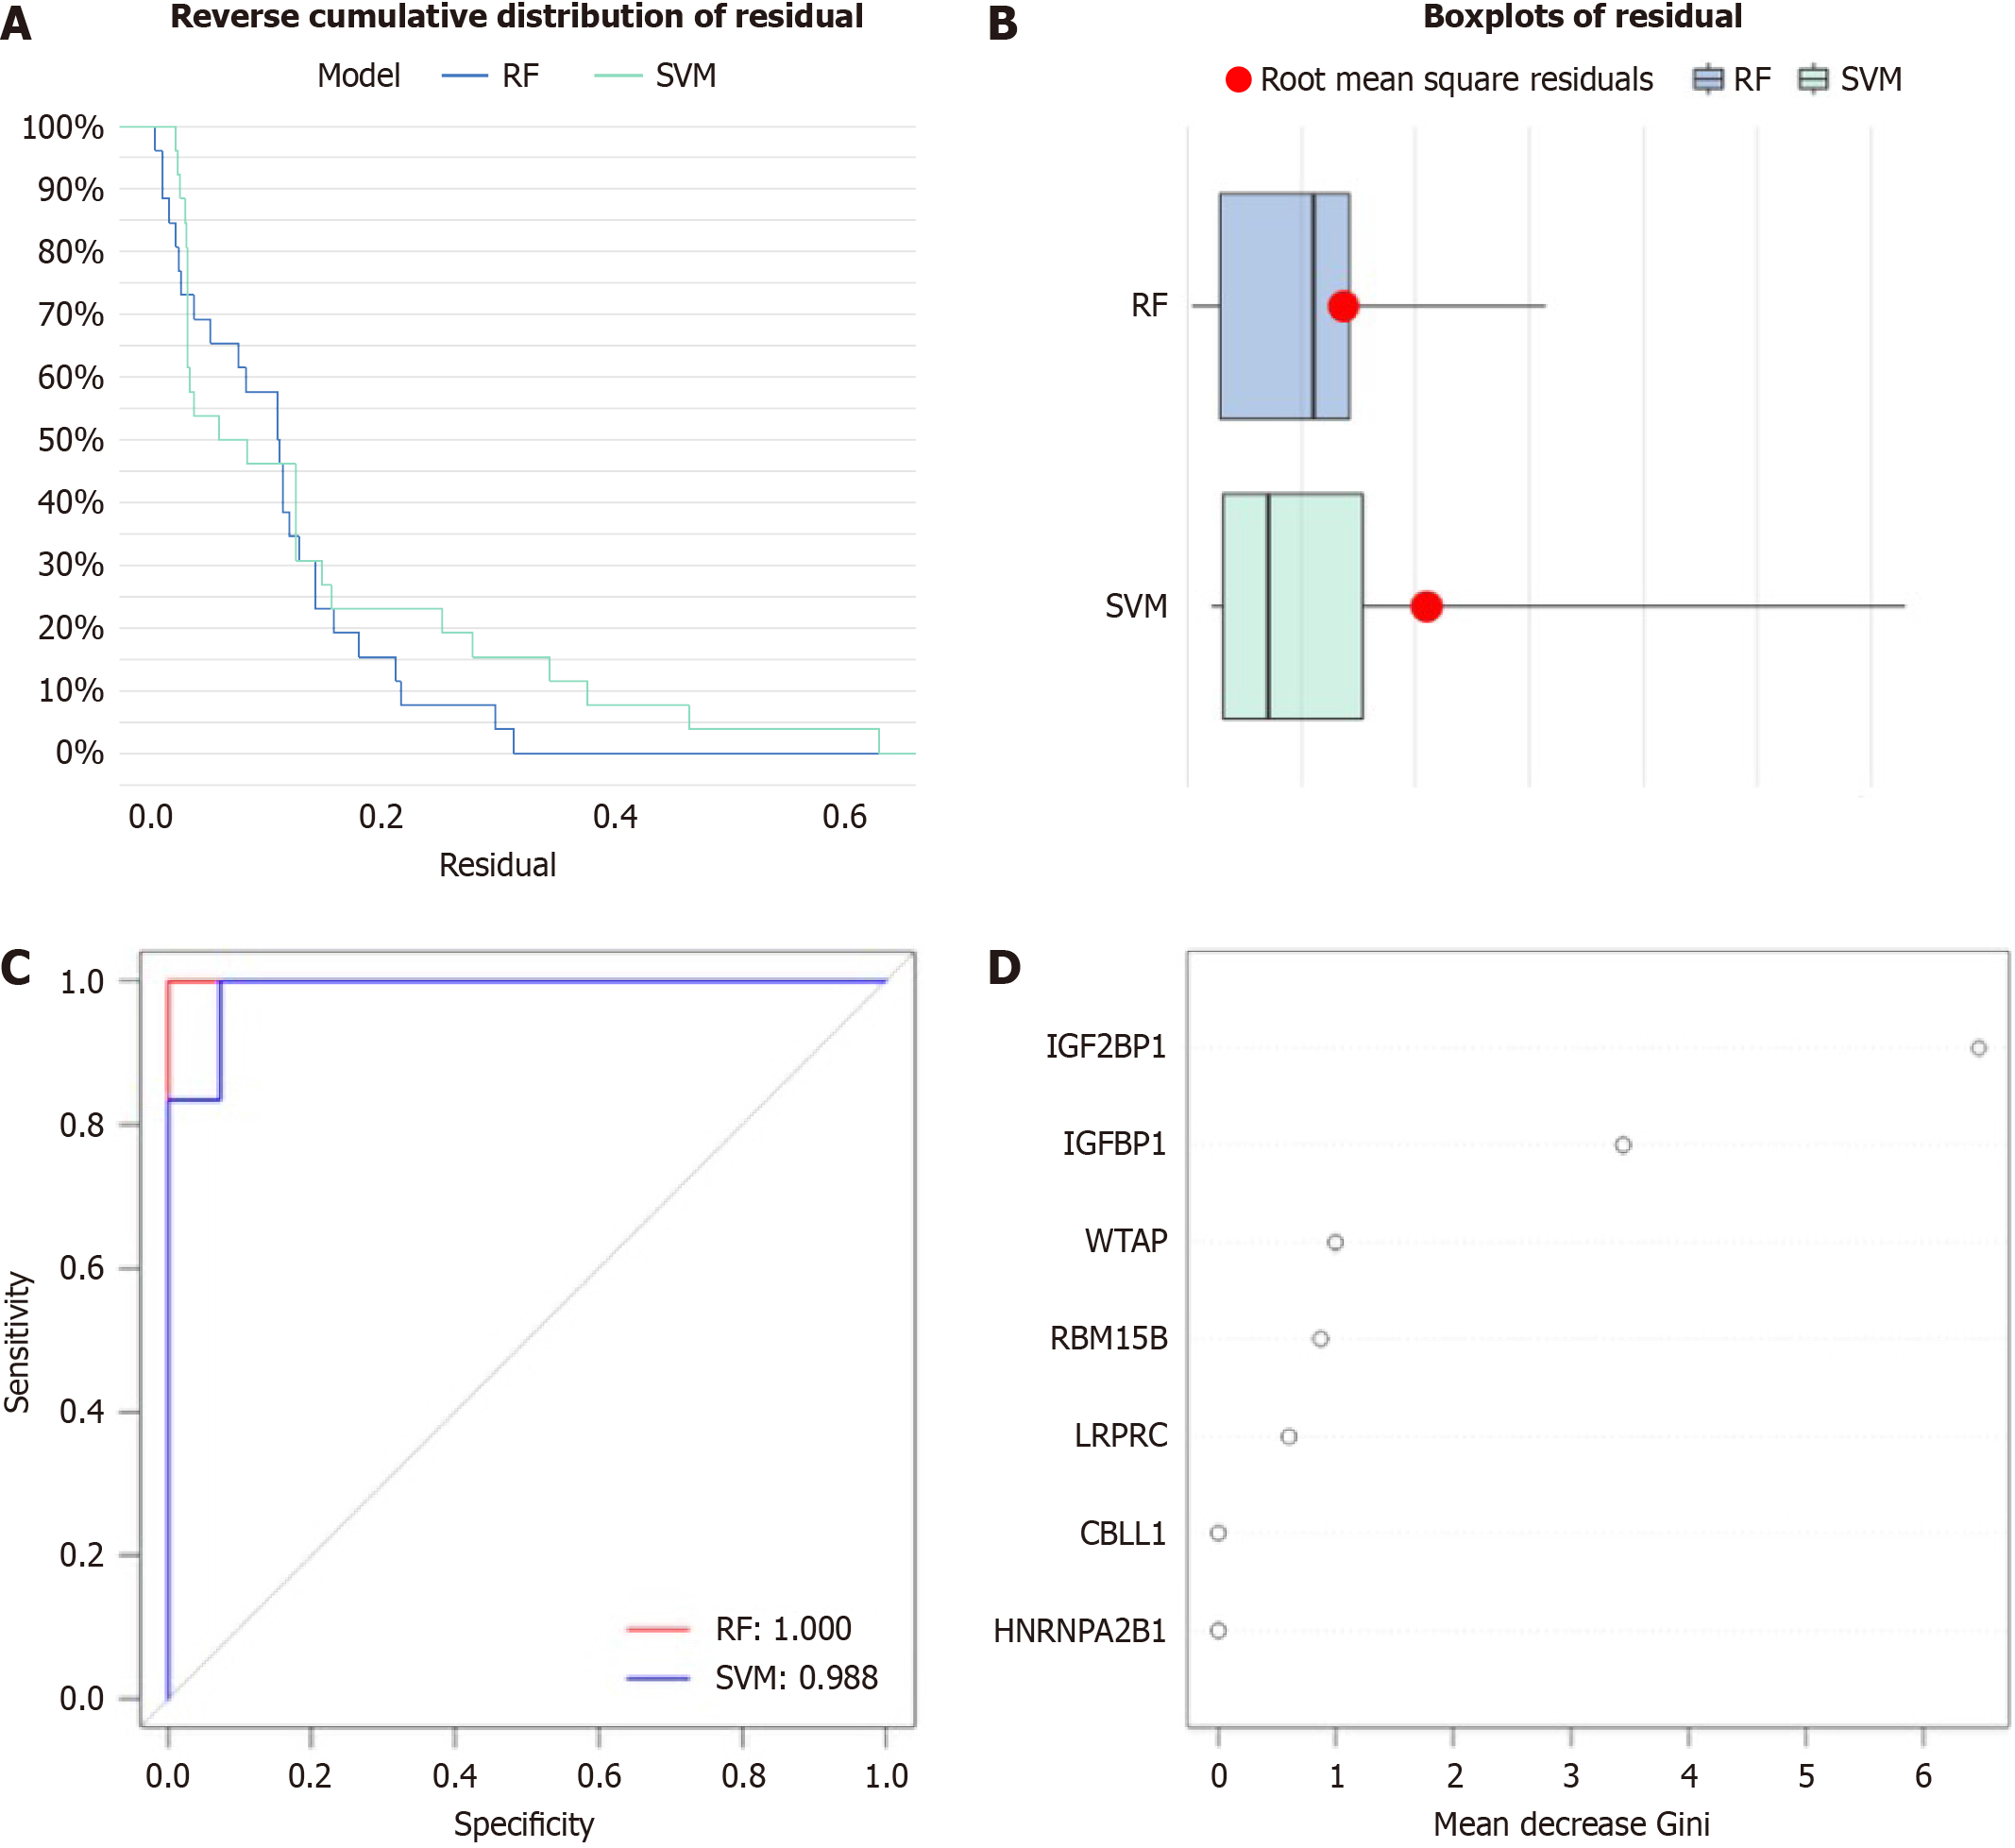
Figure 3 Random forest model and support vector machine model.
A: Reverse cumulative distribution of residual was plotted to show the residual distribution of random forest (RF) and support vector machine (SVM) model; B: Boxplots of residual was plotted to show the residual distribution of RF and SVM model; C: Receiver operator characteristic curves indicated the accuracy of the RF and SVM model; D: Gini index of the 7 N6-methyladenosine regulators with differences in Epstein-Barr virus-associated gastric cancer based on the RF model. RF: Random forest; SVM: Support vector machine; HNRNPA2B1: Heterogeneous nuclear ribonucleoprotein A2B1; IGF2BP1: Insulin like growth factor 2 binding protein 1; IGFBP1: Insulin like growth factor binding protein 1; LRPPRC: Leucine rich pentatricopeptide repeat containing; RBM15B: RNA Binding Motif Protein 15B; CBLL1: CBL proto-oncogene like 1; WTAP: Wilms tumor 1 associated protein.
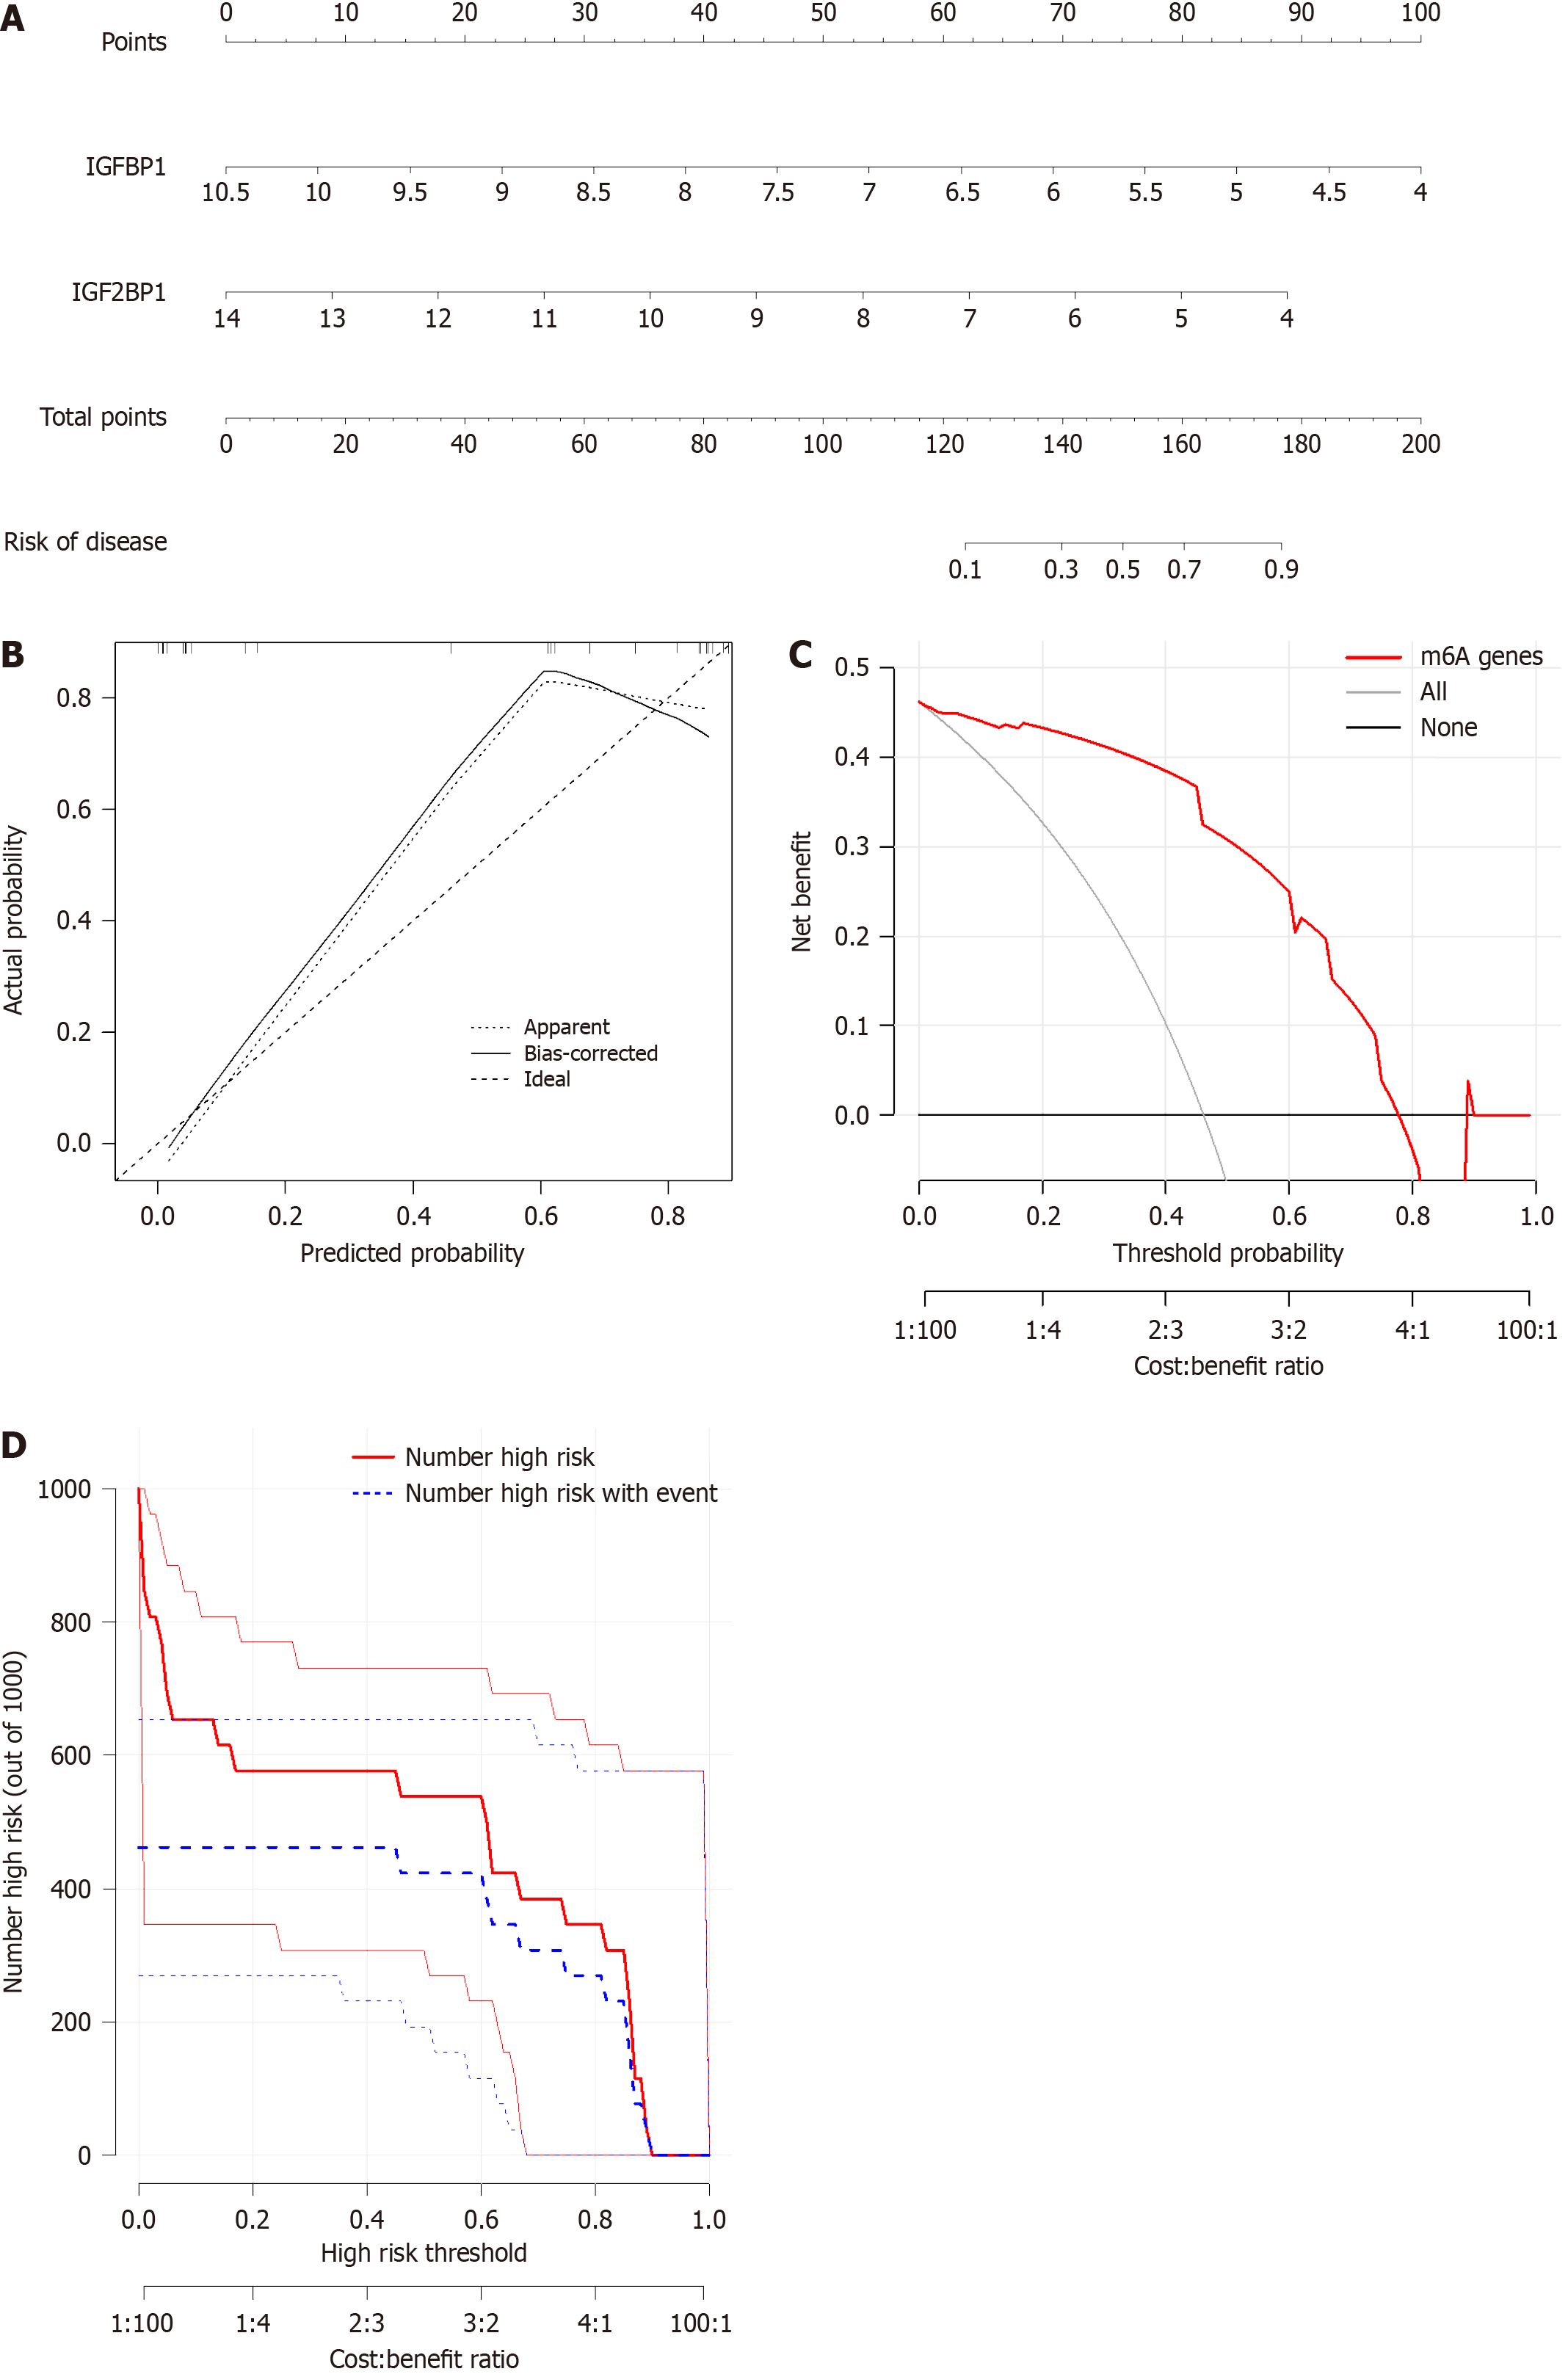
Figure 4 Construction of the nomogram model.
A: Construction of the nomogram model based on the insulin like growth factor binding protein 1 and insulin like growth factor 2 binding protein 1; B: Predictive calues of the model by the calibration curve; C: Decision curve analysis to evaluate the model; D: Clinical impact of the model. IGF2BP1: Insulin like growth factor 2 binding protein 1; IGFBP1: Insulin like growth factor binding protein 1; m6A: N6-methyladenosine.
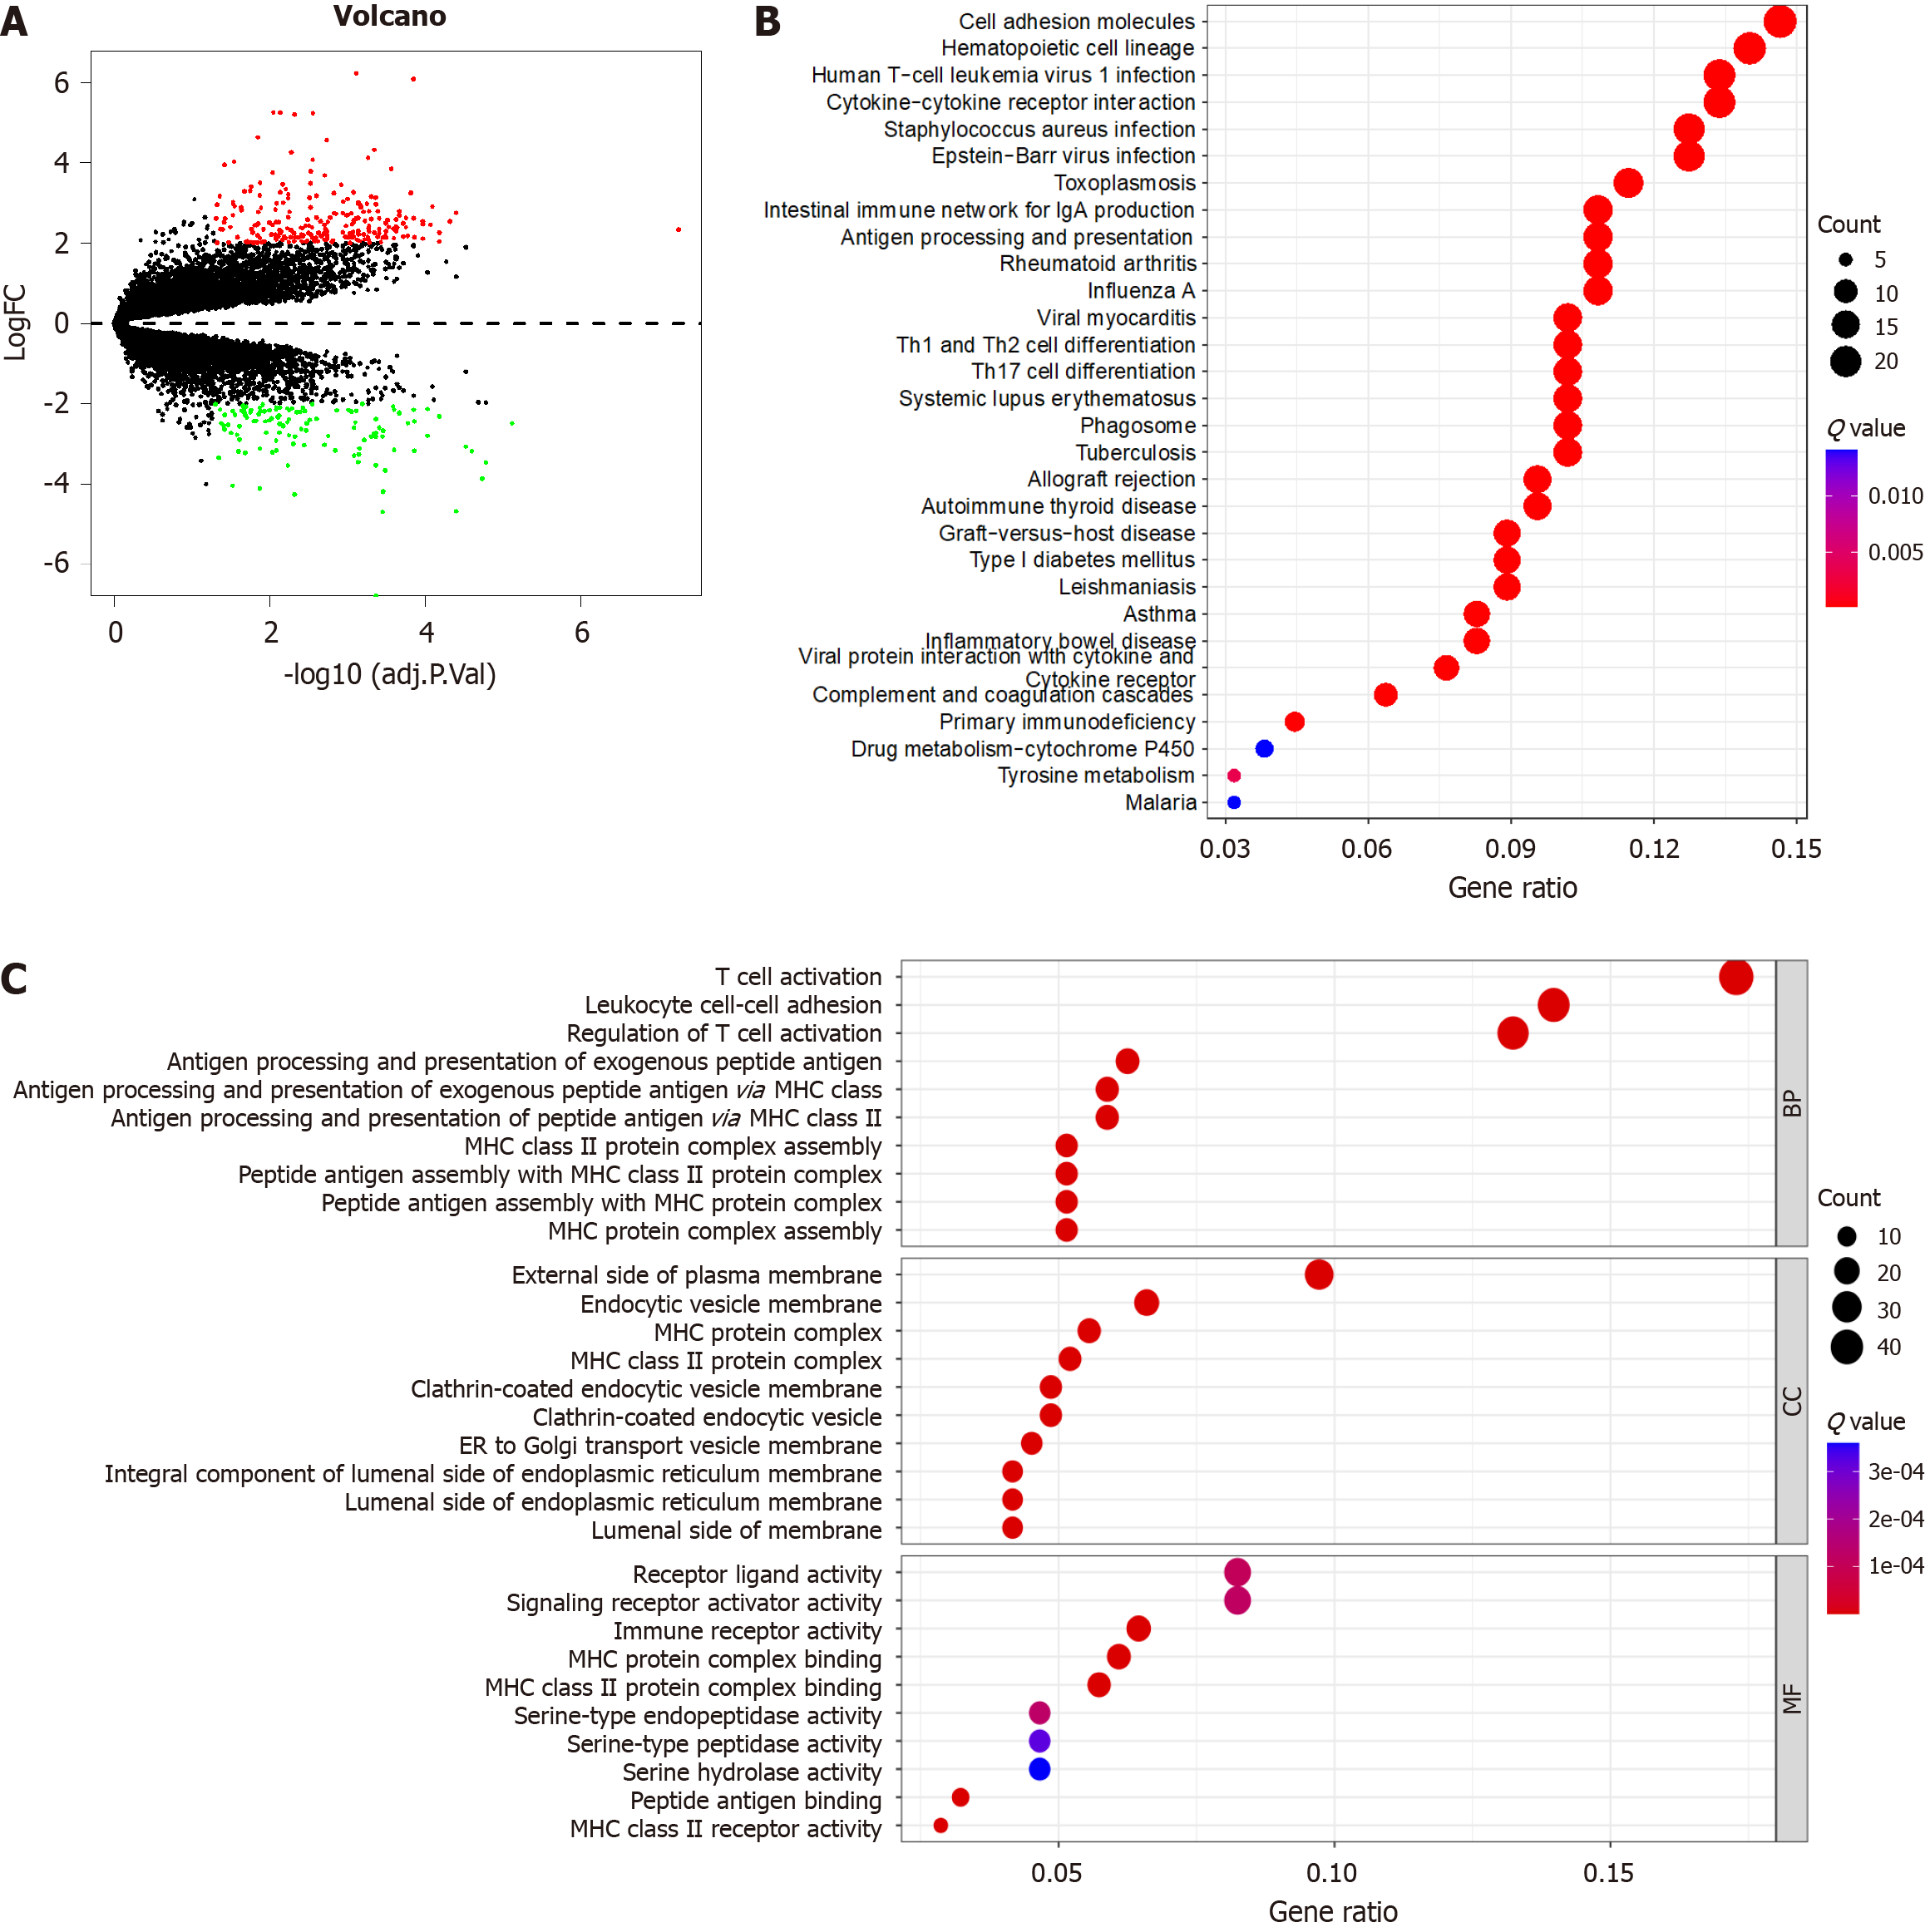
Figure 5 Enrichment analysis of genes participating in Epstein-Barr virus-associated gastric cancer.
A: N6-methyladenosine (m6A)-related differentially expressed genes (DEGs); B: Gene ontology analysis that explores the potential mechanism underlying the effect of the 365 m6A-related DEGs on the occurrence and development of Epstein-Barr virus-associated gastric cancer; C: Kyoto Encyclopedia of Genes and Genomes analysis that explores the potential signal pathway. FC: Fold change.
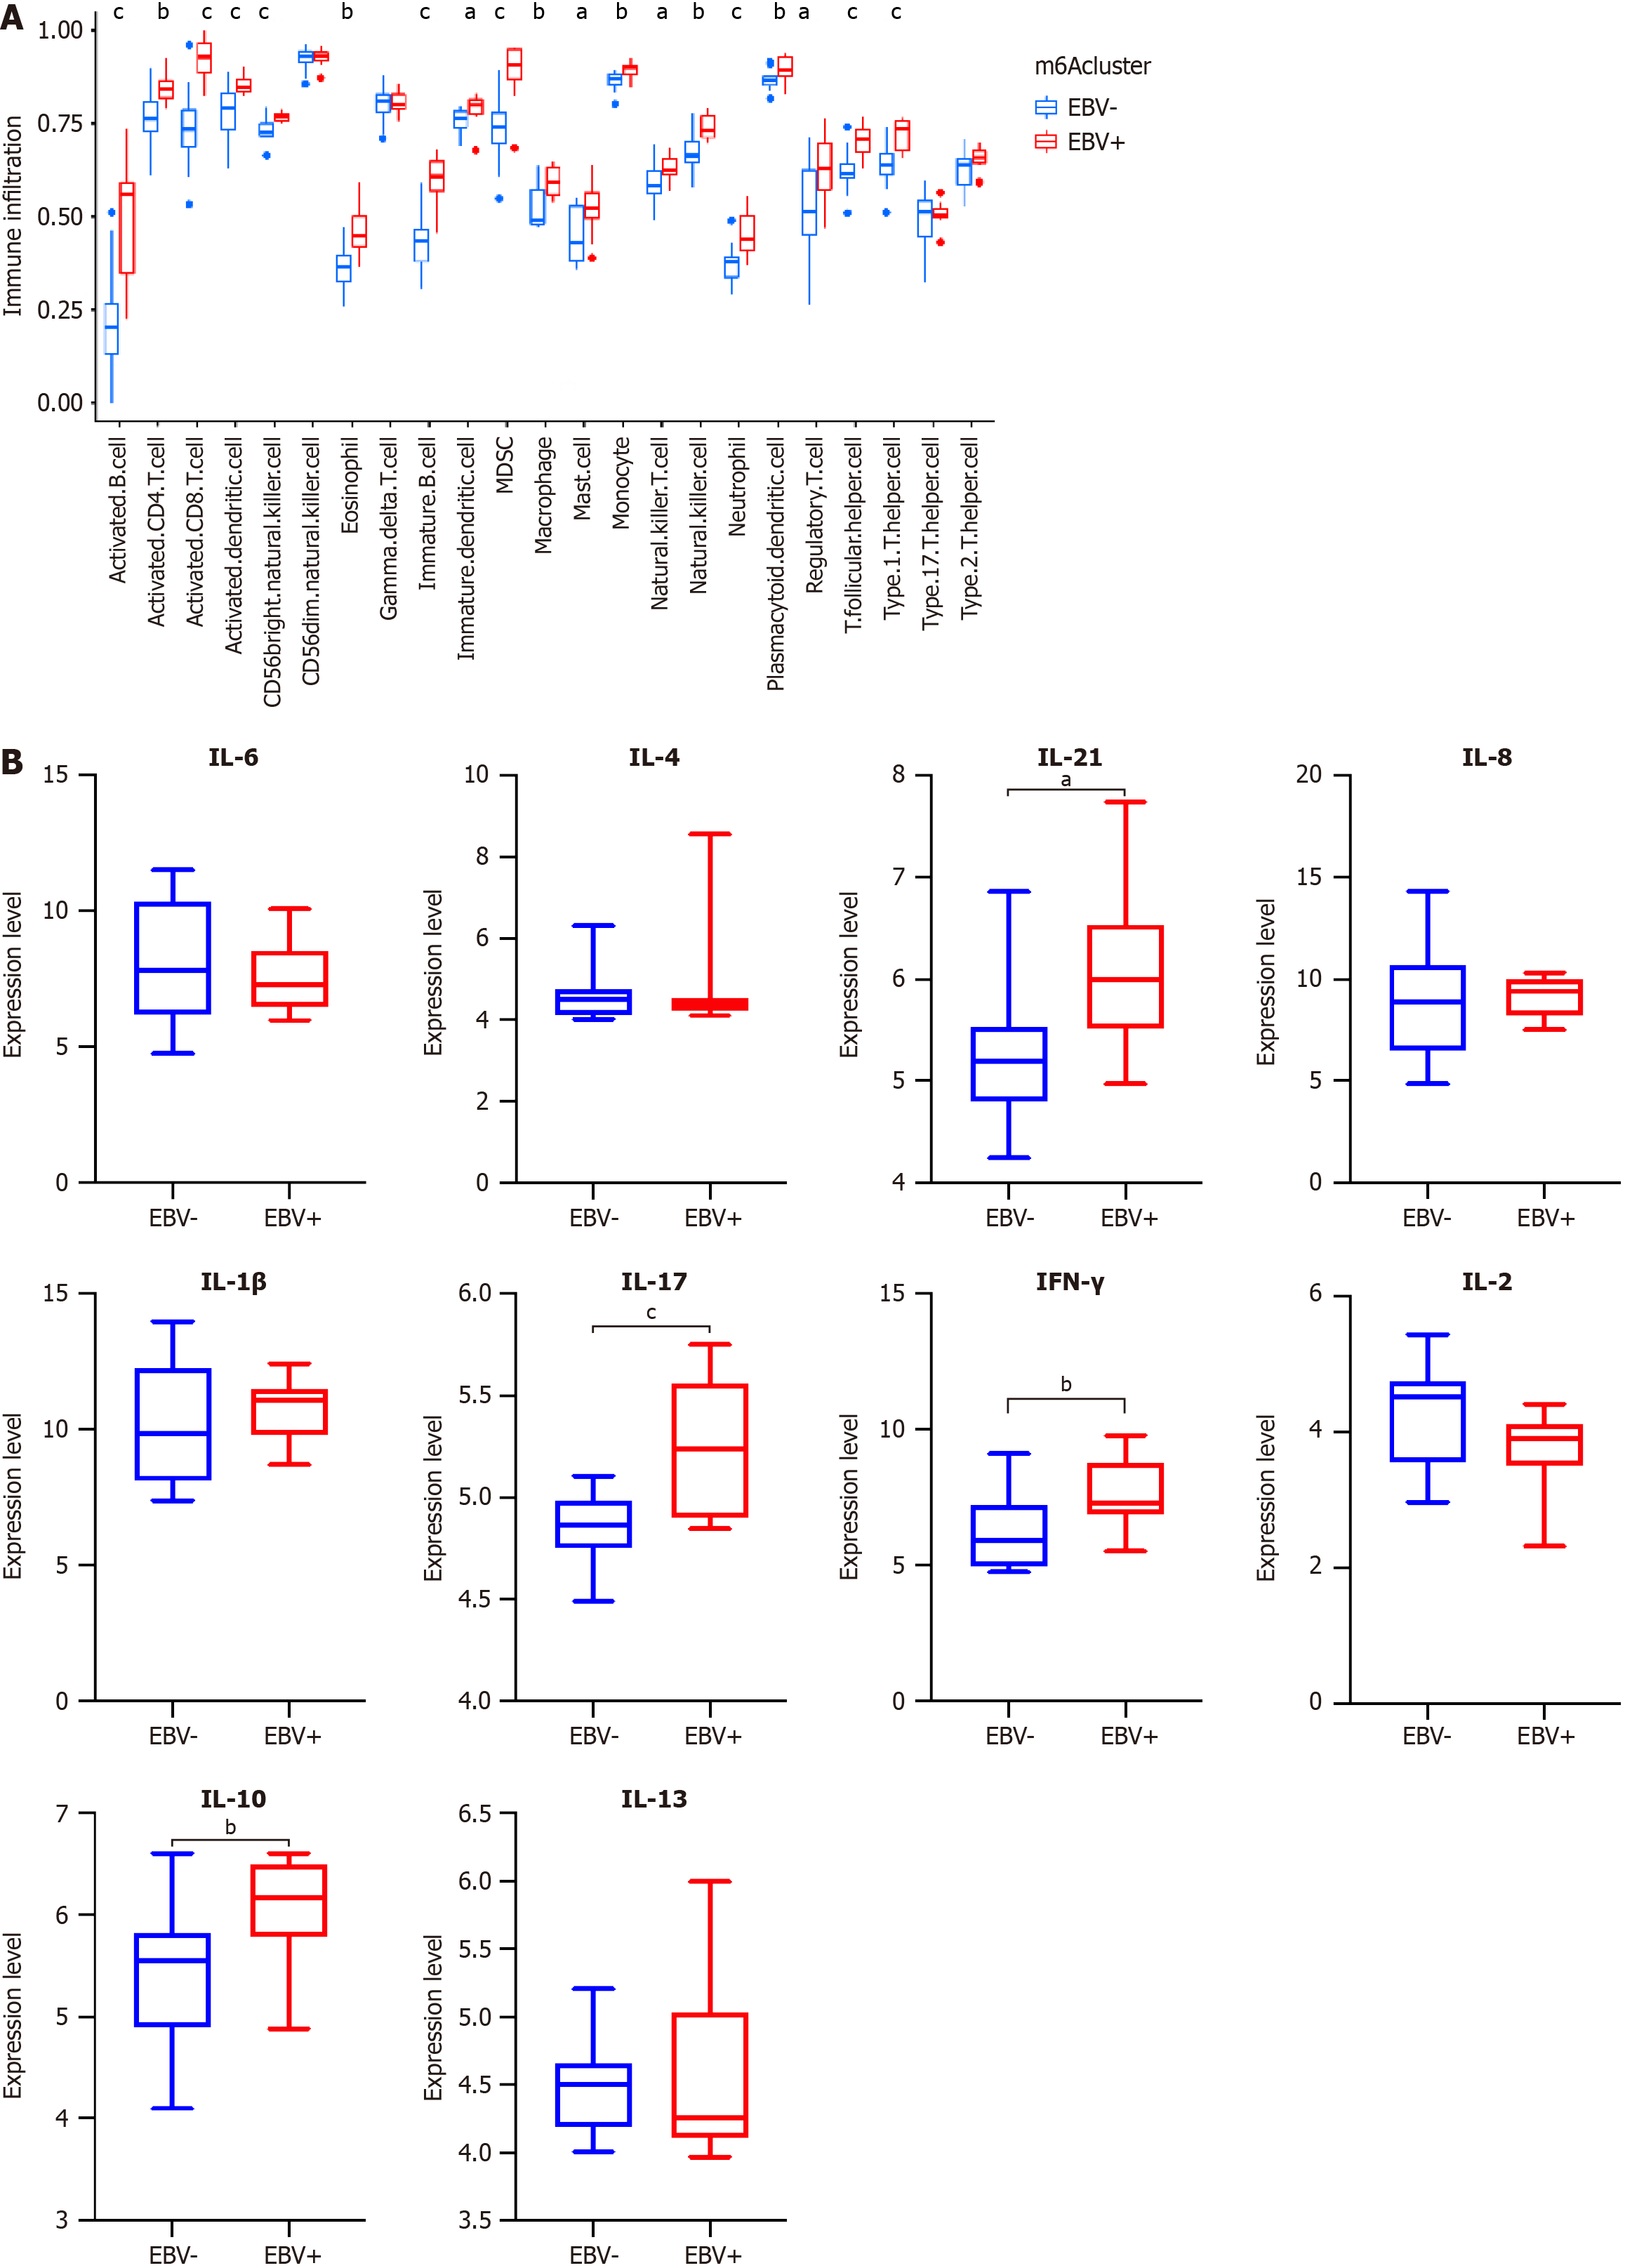
Figure 6 Tumor microenvironment cell infiltration characteristics in Epstein-Barr virus-associated gastric cancer.
A: Single sample gene set enrichment analysis; B: the expression of inflammatory factors between Epstein-Barr virus-associated gastric cancer and Epstein-Barr virus-negative gastric cancer. aP < 0.05, bP < 0.01, cP < 0.001. EBV: Epstein-Barr virus; IL: Interleukin; IFN: Interferon; MDSC: Myeloid-derived suppressor cell.
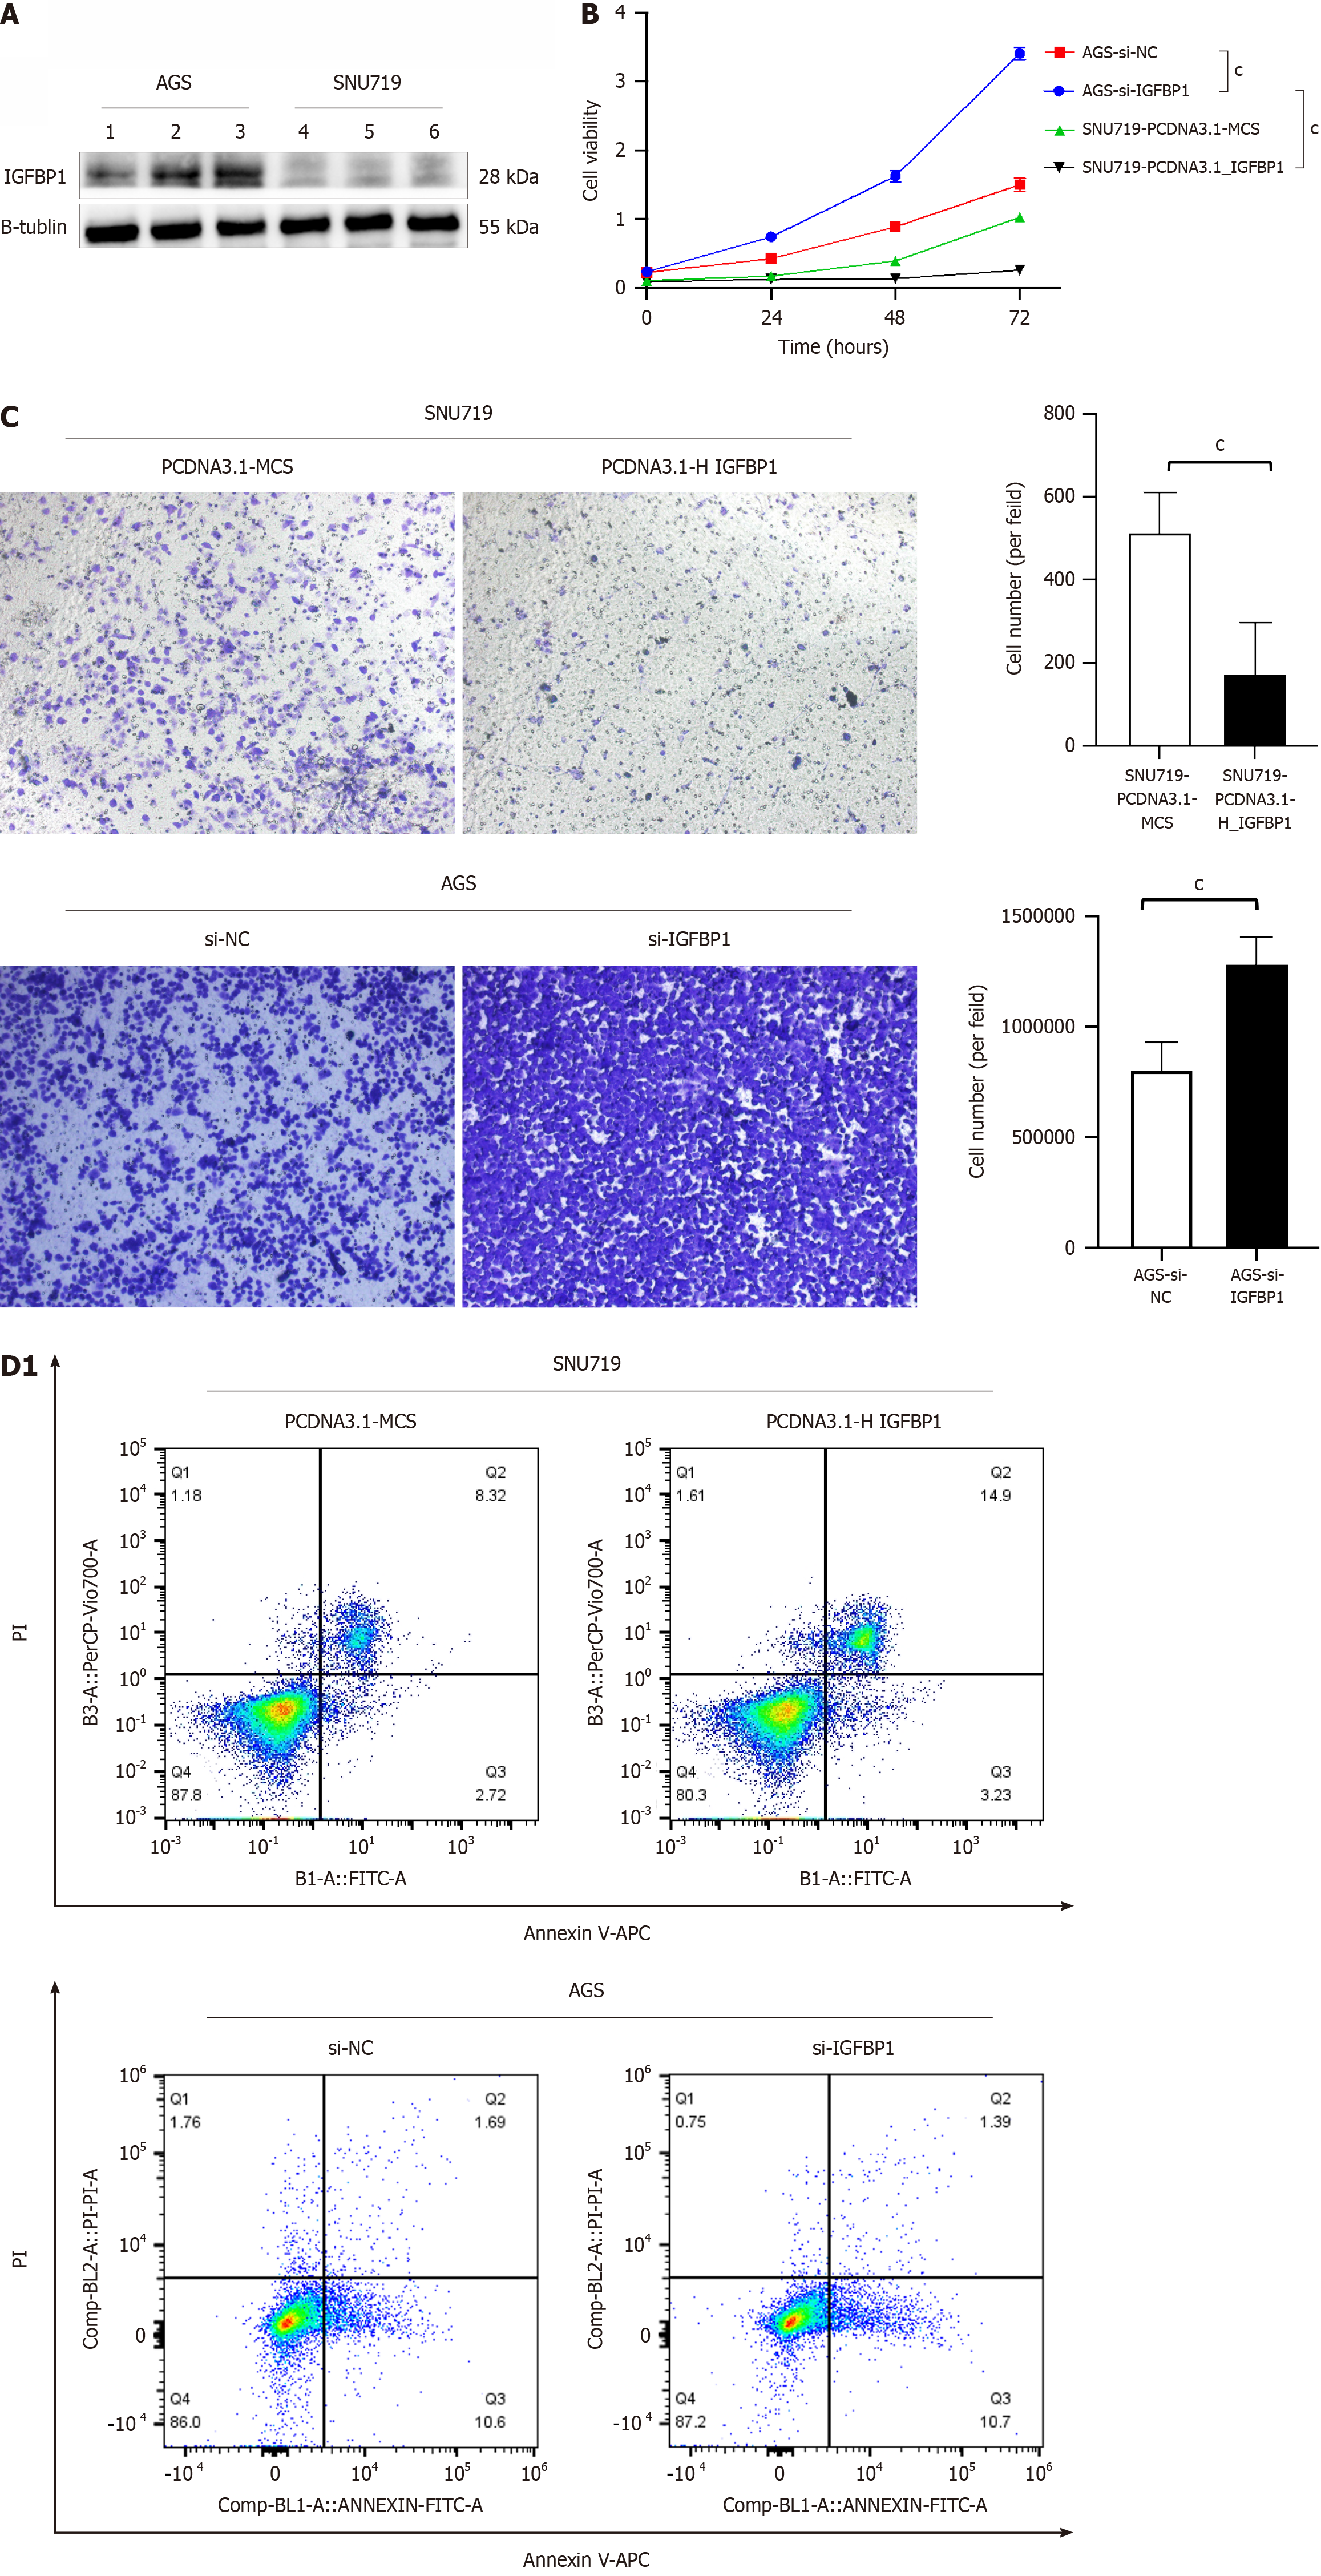
Figure 7 Role of insulin like growth factor binding protein 1 in Epstein-Barr virus-associated gastric cancer and Epstein-Barr virus-negative gastric cancer cell lines.
A: the expression of insulin like growth factor binding protein 1 (IGFBP1) in Epstein-Barr virus-associated gastric cancer (EBVaG) and Epstein-Barr virus-negative gastric cancer (EBVnGC) cell lines; B: Role of IGFBP1 in proliferation in EBVaG and EBVnGC cell lines; C: Role of IGFBP1 in migration in EBVaG and EBVnGC cell lines; D: Role of IGFBP1 in apoptosis in EBVaG and EBVnGC cell lines. aP < 0.05, bP < 0.01, cP < 0.001. IGFBP1: Insulin like growth factor binding protein 1; NC: Normal control; PI: Propidium iodide.
- Citation: Zhang Y, Zhou F, Zhang MY, Feng LN, Guan JL, Dong RN, Huang YJ, Xia SH, Liao JZ, Zhao K. N6-methyladenosine methylation regulates the tumor microenvironment of Epstein-Barr virus-associated gastric cancer. World J Gastrointest Oncol 2024; 16(6): 2555-2570
- URL: https://www.wjgnet.com/1948-5204/full/v16/i6/2555.htm
- DOI: https://dx.doi.org/10.4251/wjgo.v16.i6.2555


