Copyright
©The Author(s) 2024.
World J Gastrointest Oncol. Jun 15, 2024; 16(6): 2520-2530
Published online Jun 15, 2024. doi: 10.4251/wjgo.v16.i6.2520
Published online Jun 15, 2024. doi: 10.4251/wjgo.v16.i6.2520
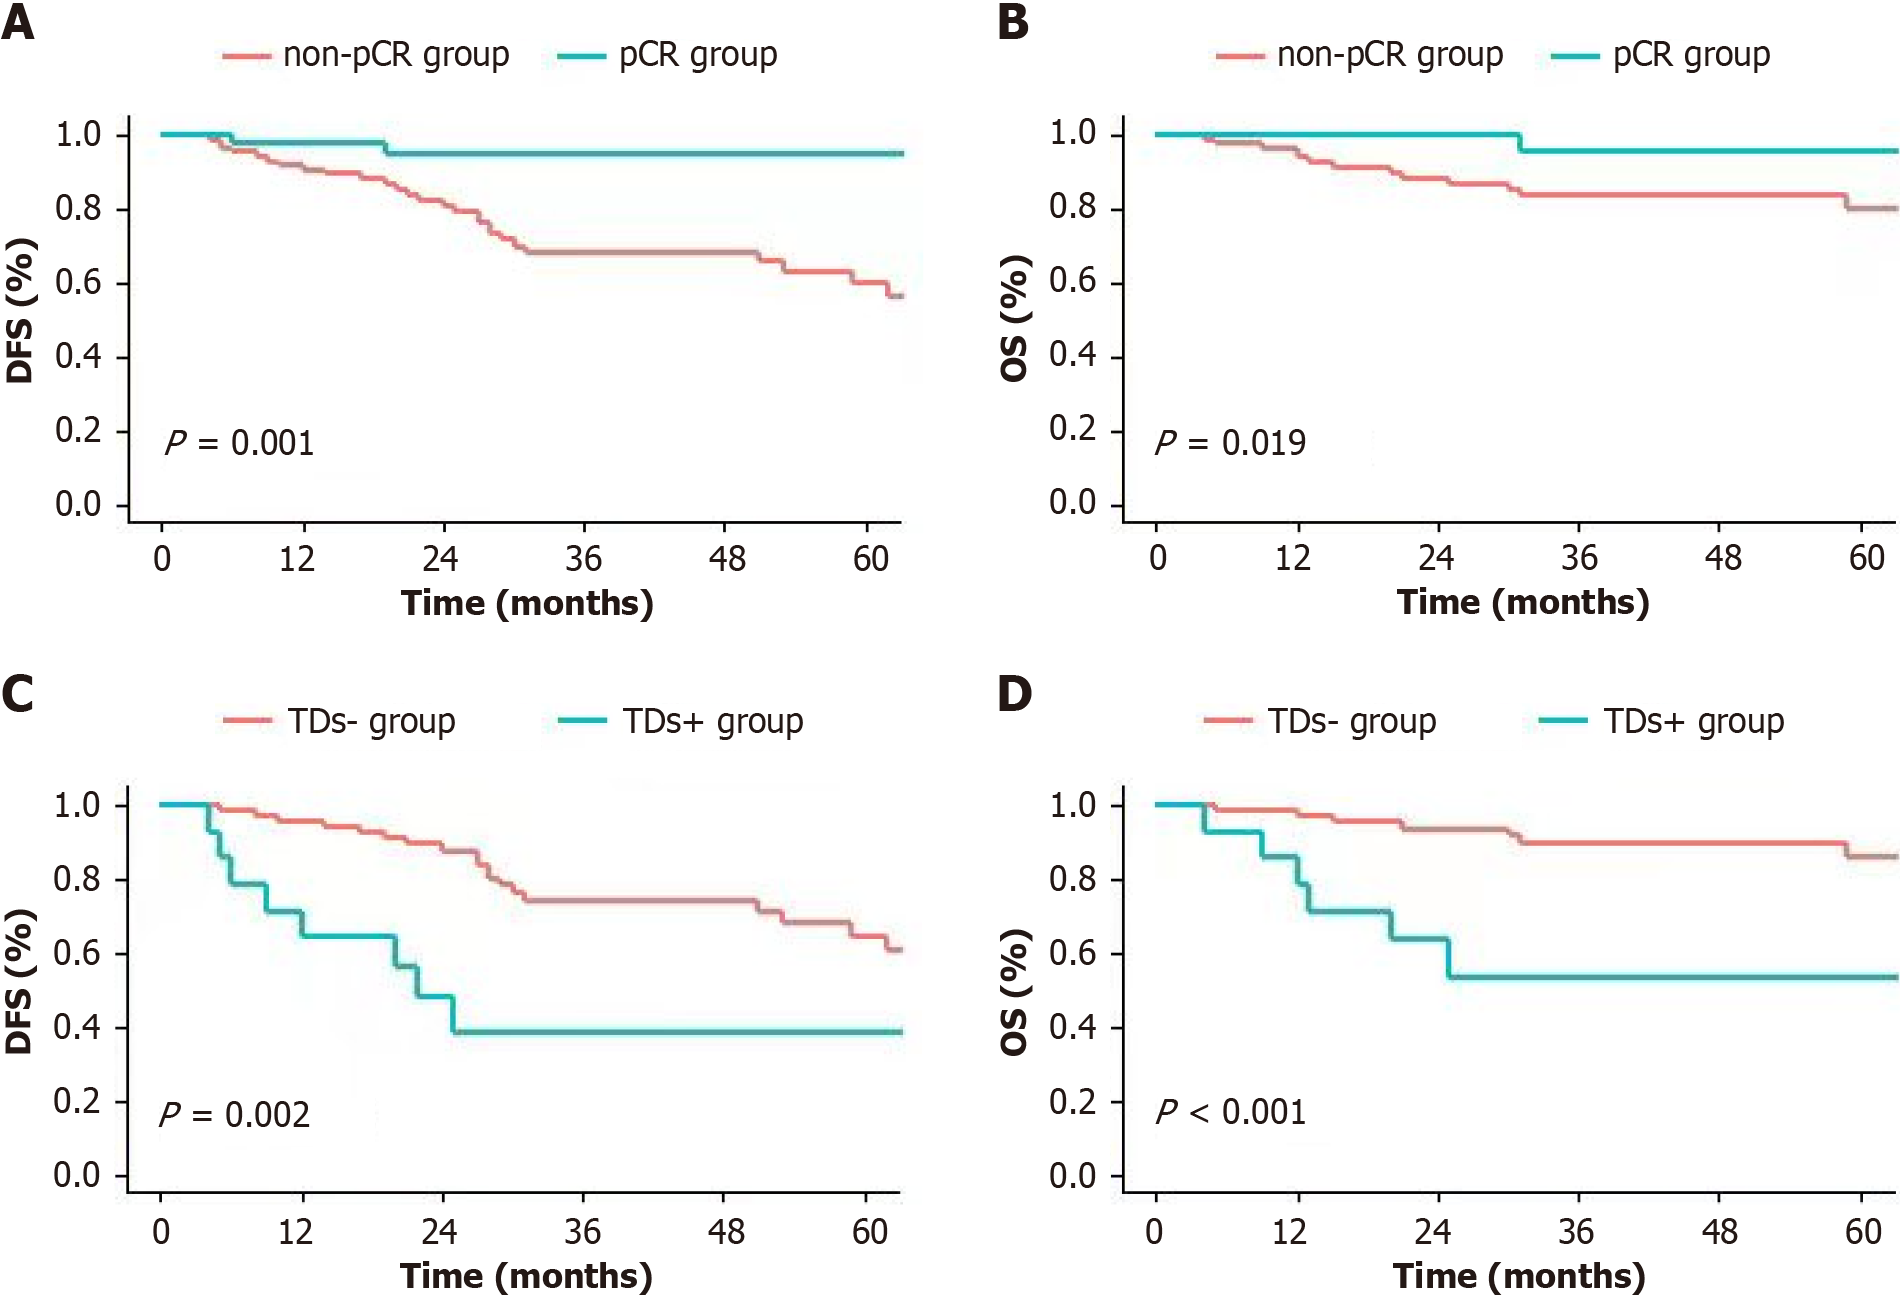
Figure 1 The Kaplan-Meier survival curves of overall survival and disease-free survival in different groups.
A: Disease-free survival of pathological complete response (pCR) group and non-pCR group; B: Overall survival of pCR group and non-pCR group; C: Disease-free survival of tumor deposits (TDs)+ group and TDs- group; D: Overall survival of TDs+ group and TDs- group. pCR: Pathologic complete response; TDs: Tumor deposits; DFS: Disease-free survival; OS: Overall survival.
- Citation: Xu YJ, Tao D, Qin SB, Xu XY, Yang KW, Xing ZX, Zhou JY, Jiao Y, Wang LL. Prediction of pathological complete response and prognosis in locally advanced rectal cancer. World J Gastrointest Oncol 2024; 16(6): 2520-2530
- URL: https://www.wjgnet.com/1948-5204/full/v16/i6/2520.htm
- DOI: https://dx.doi.org/10.4251/wjgo.v16.i6.2520


