Copyright
©The Author(s) 2024.
World J Gastrointest Oncol. Jun 15, 2024; 16(6): 2449-2462
Published online Jun 15, 2024. doi: 10.4251/wjgo.v16.i6.2449
Published online Jun 15, 2024. doi: 10.4251/wjgo.v16.i6.2449
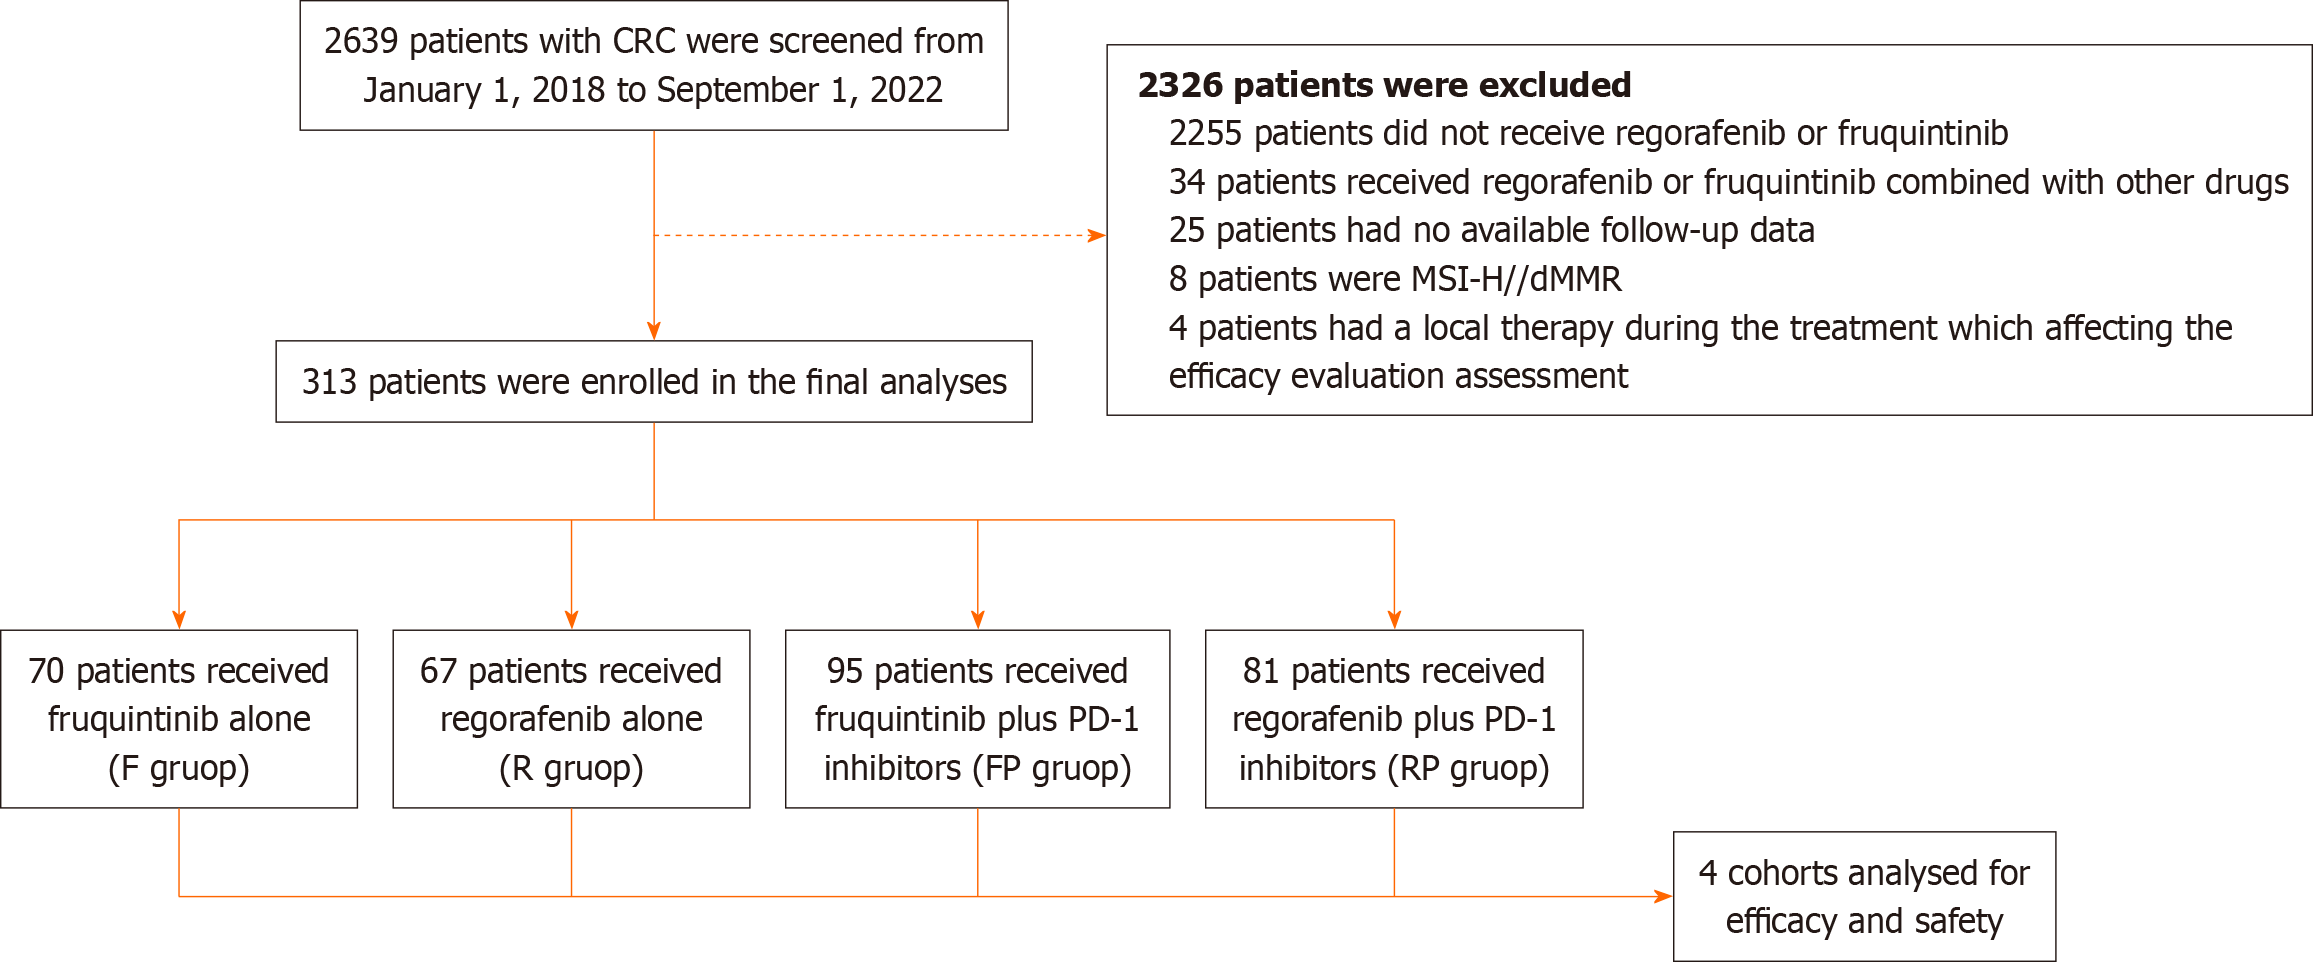
Figure 1 Flowchart of the patient selection.
CRC: Colorectal cancer; PD-1: Programmed death-1; MSI-H: Microsatellite instability-high; dMMR: Mismatch repair deficient; F: Fruquintinib; R: Regorafenib; FP: Fruquintinib plus programmed death-1 inhibitors; RP: Regorafenib plus programmed death-1 inhibitors.
Figure 2 Kaplan-Meier analysis.
A: Kaplan-Meier curves of progression-free survival in patients treated with Regorafenib (R), regorafenib plus programmed death-1 inhibitors (RP), fruquintinib (F), and fruquintinib plus programmed death-1 (FP); B: Kaplan-Meier curves of overall survival in patients treated with R, RP, F, and FP. aP < 0.05, and the difference is statistically significant. F: Fruquintinib; R: Regorafenib; FP: Fruquintinib plus programmed death-1 inhibitors; RP: Regorafenib plus programmed death-1 inhibitors.
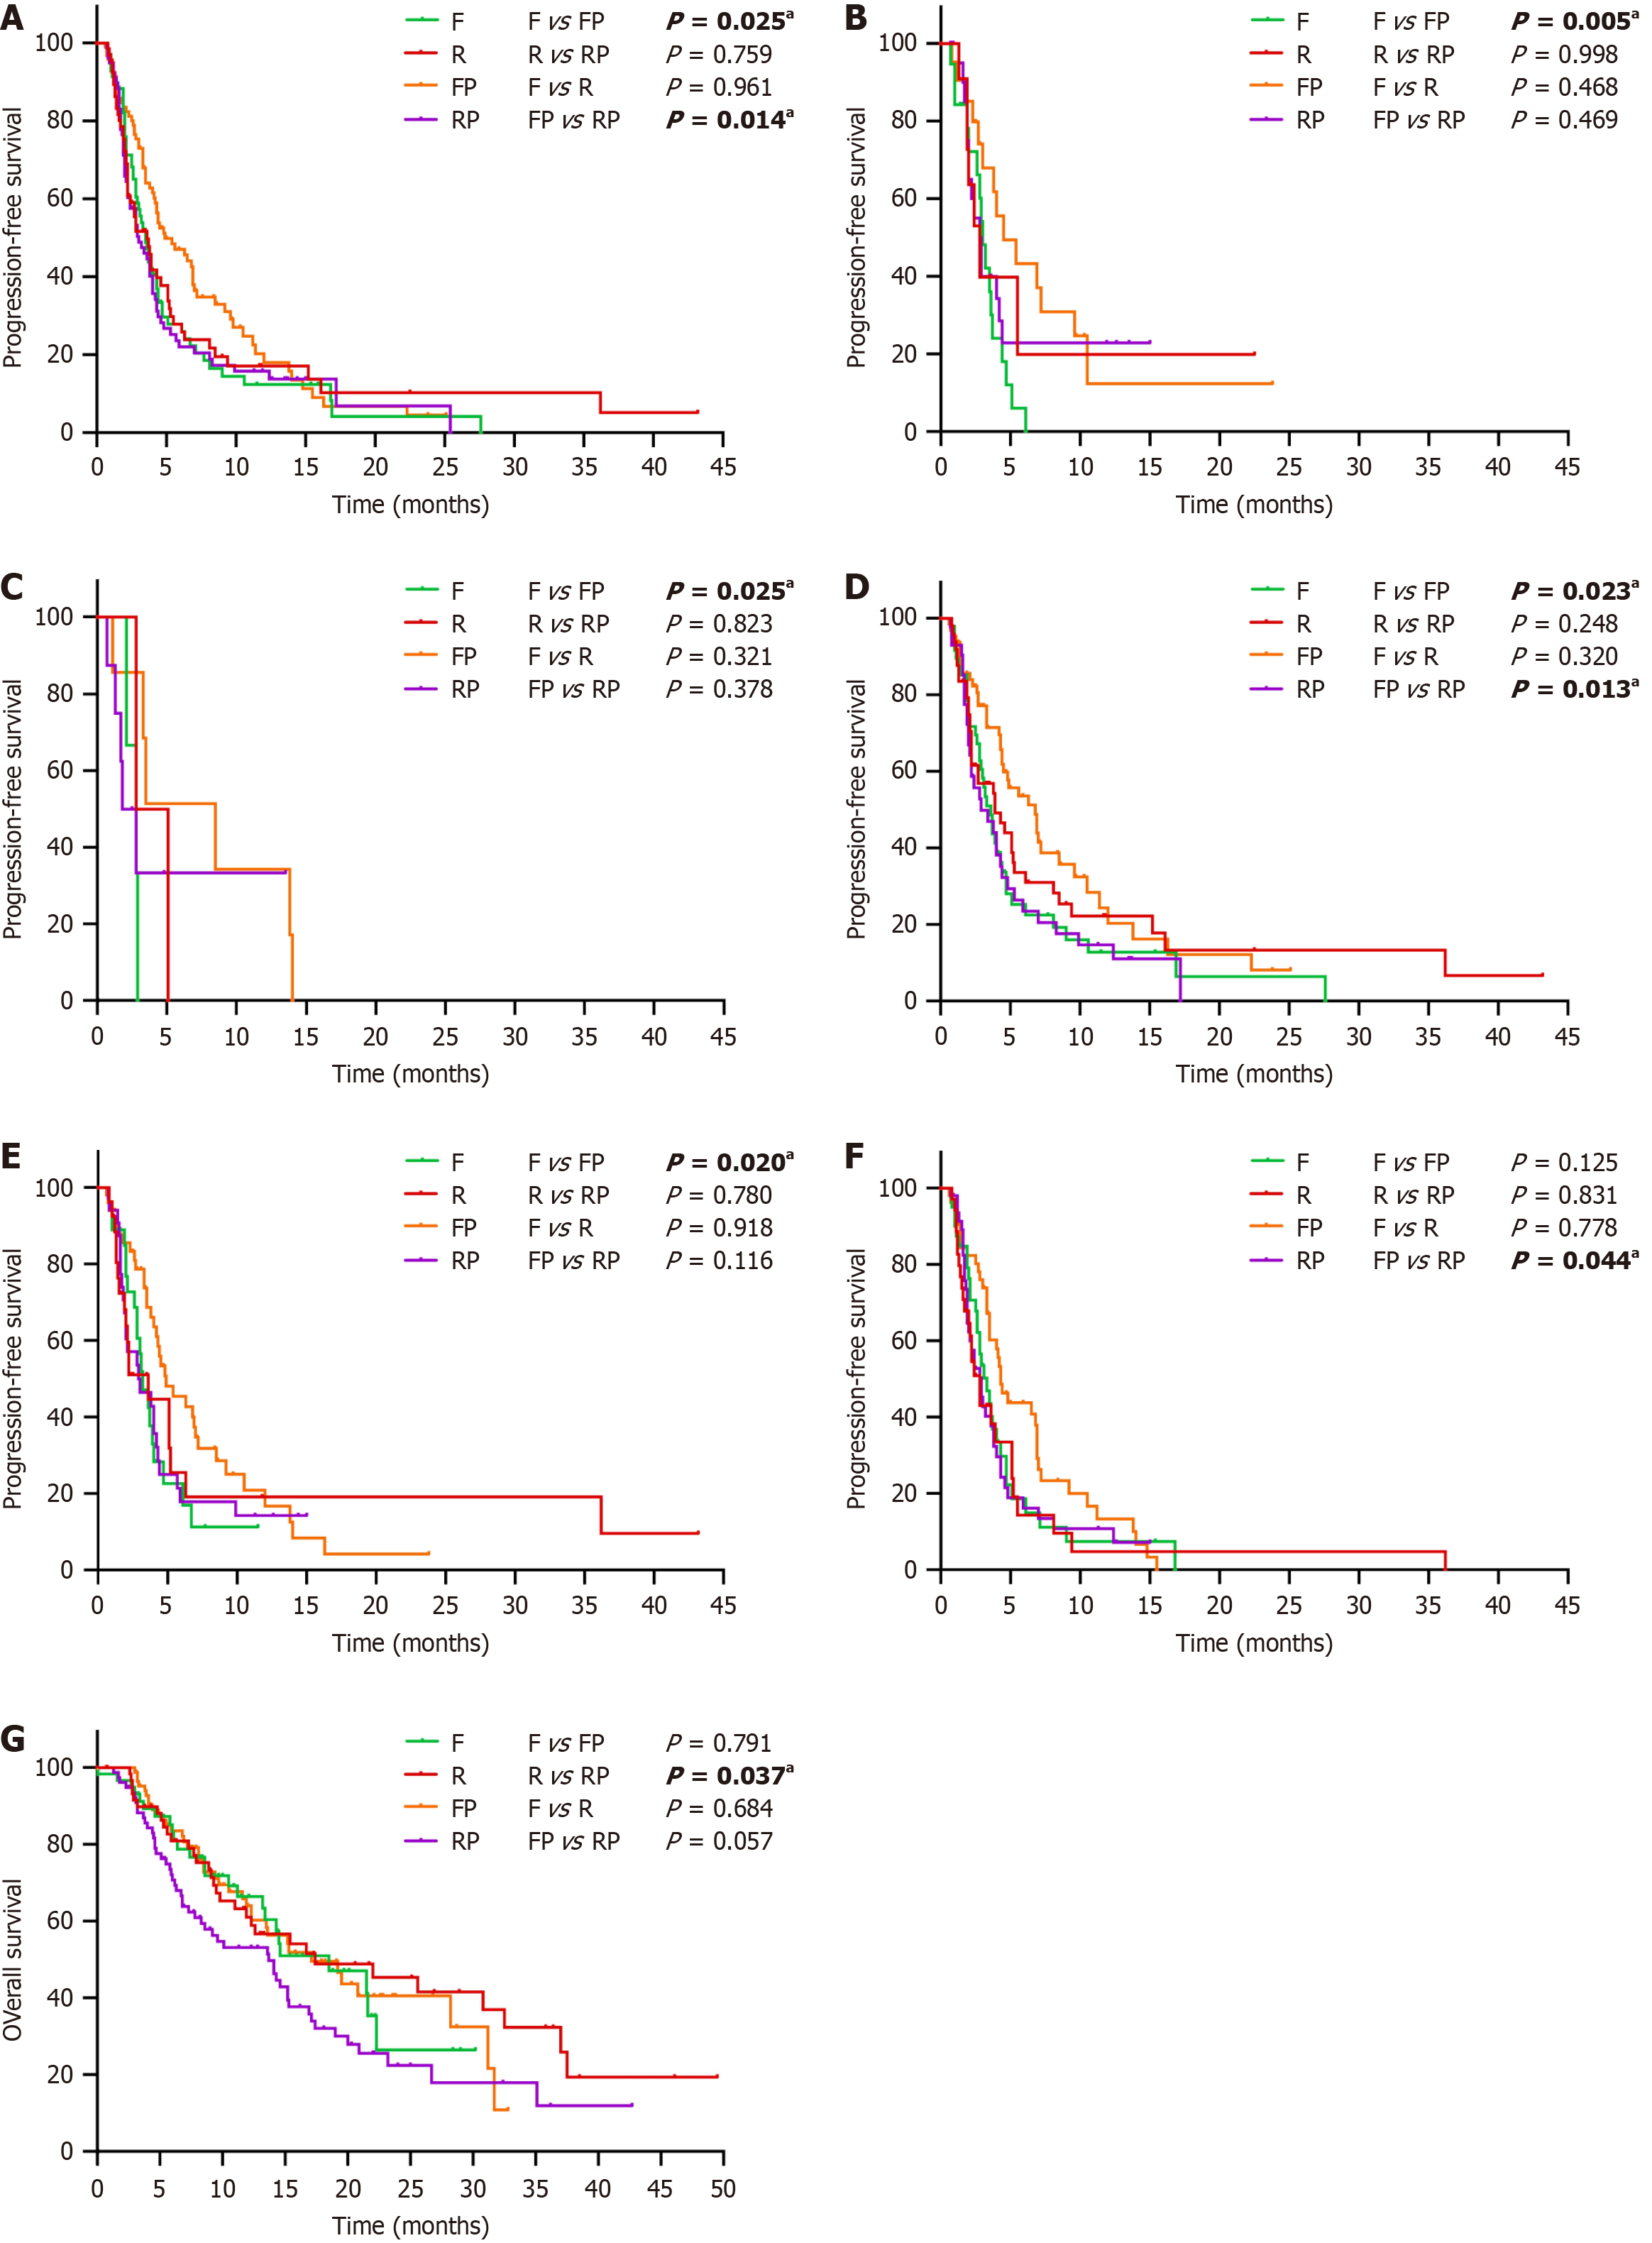
Figure 3 Subgroup analysis of progression-free survival and overall survival stratified by clinical factors.
A: Less than 65 years old; B: Primary lesion of the right-sided colon; C: BRAF mutations; D: Less than three sites of metastatic disease; E: Without lung metastases; F: With liver metastases; G: The Eastern cooperative oncology group score of 0-1. aP<0.05, and the difference is statistically significant. F: Fruquintinib; R: Regorafenib; FP: Fruquintinib plus programmed death-1 inhibitors; RP: Regorafenib plus programmed death-1 inhibitors.
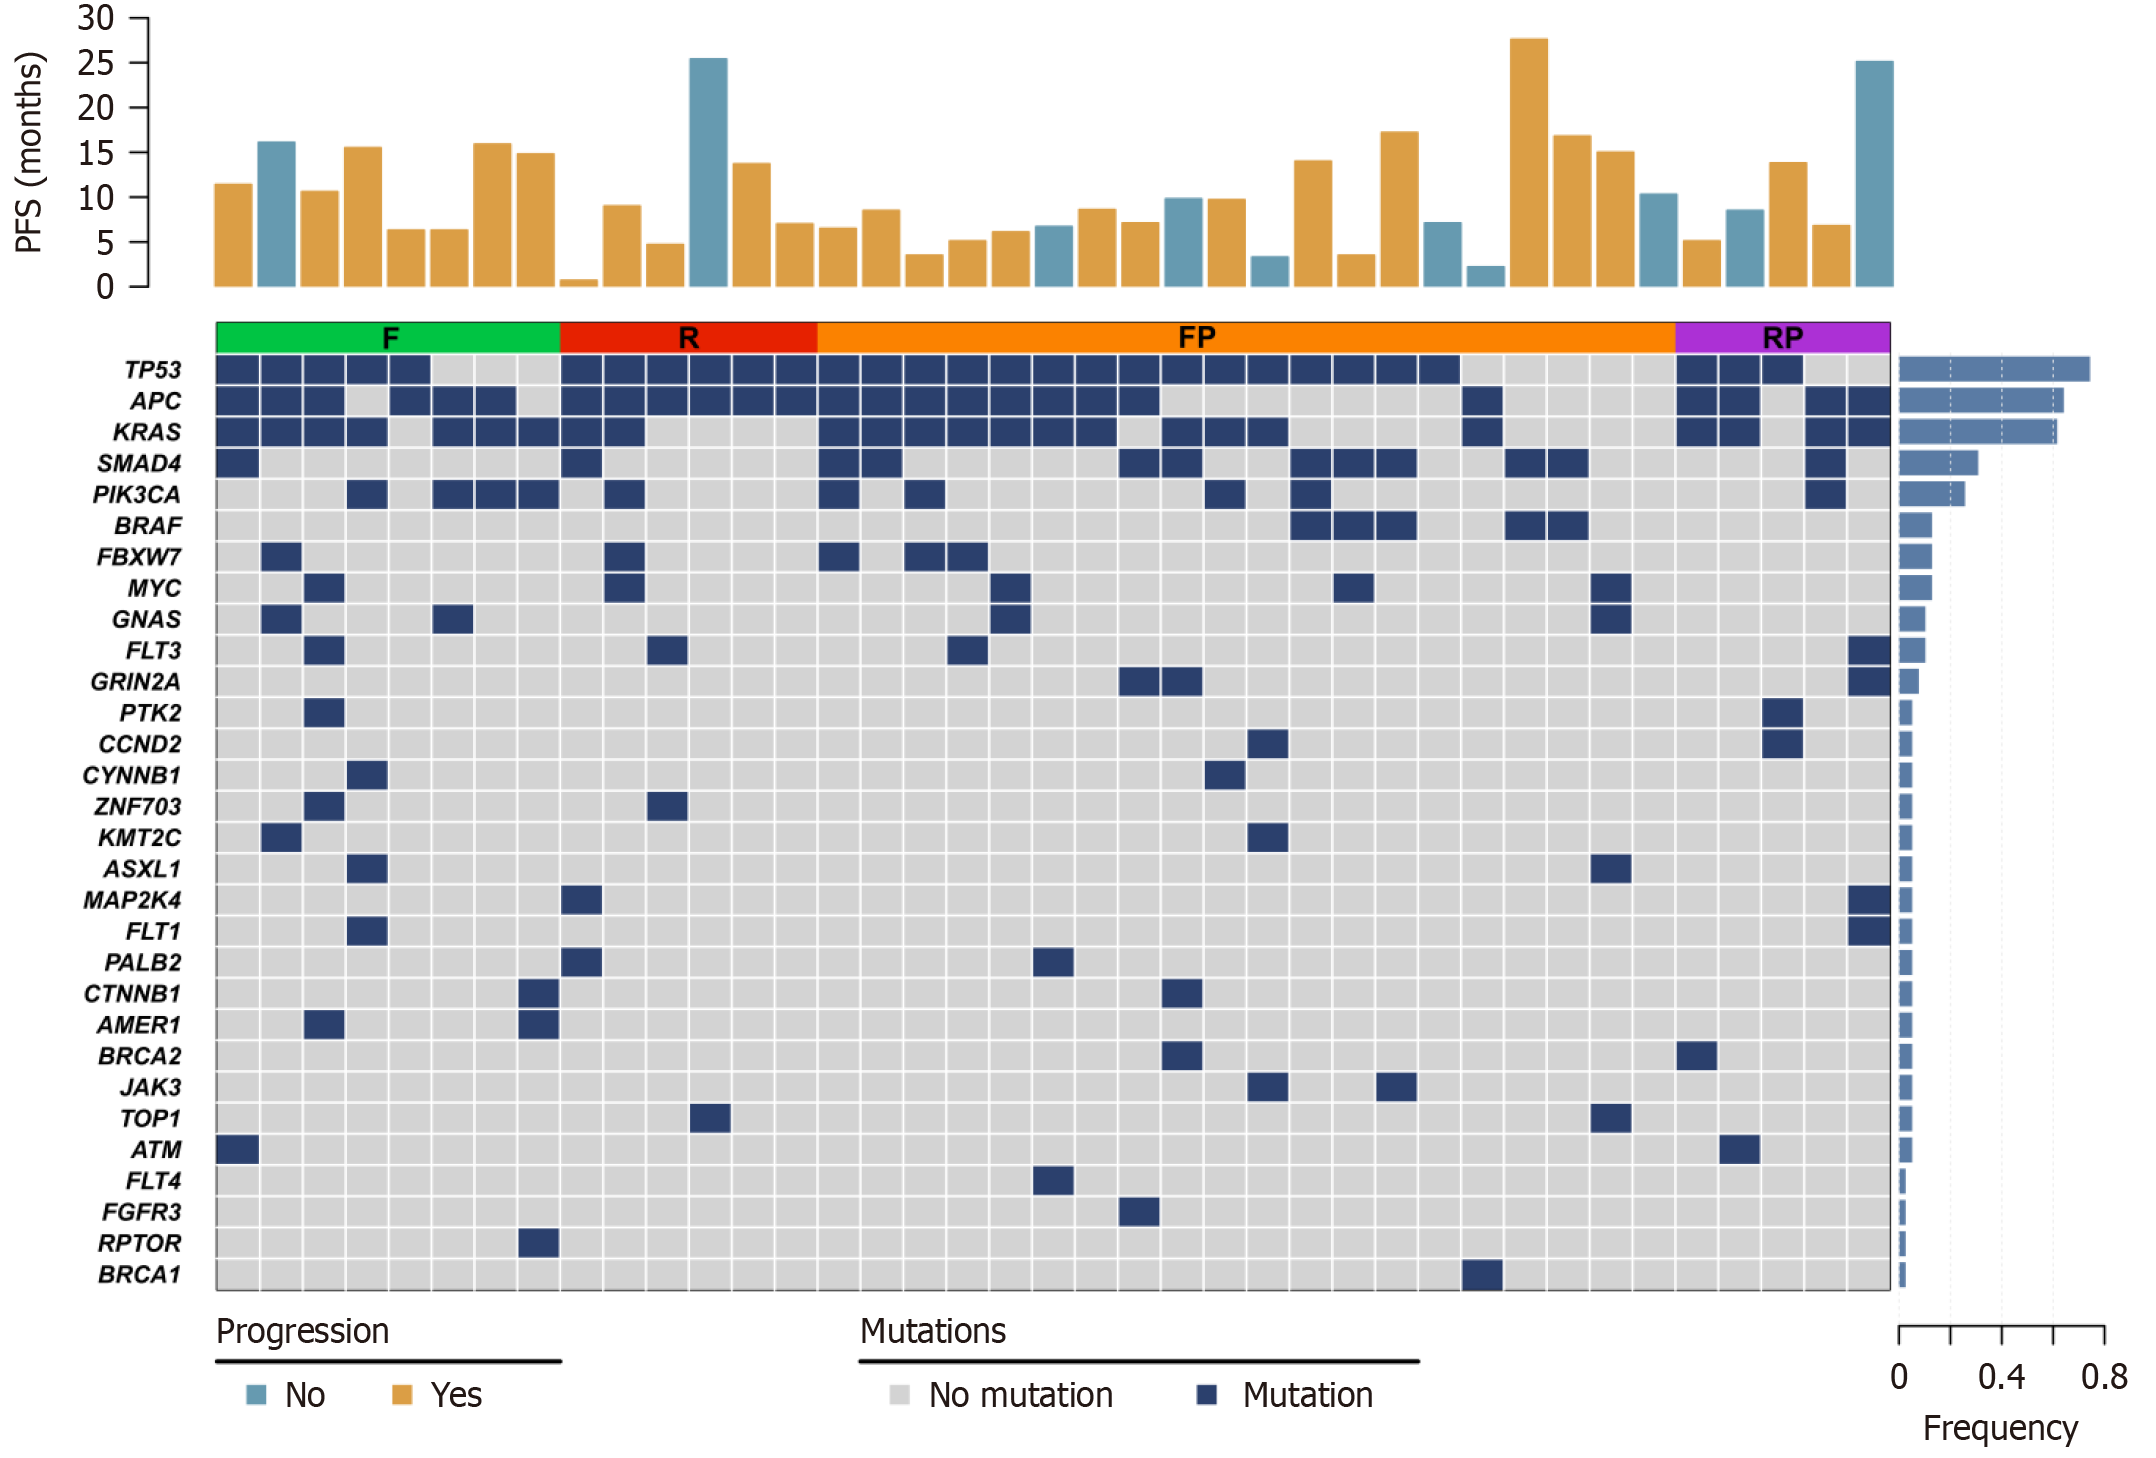
Figure 4 Gene mutation profile of patients who achieved complete response or had progression-free survival greater than 6 months.
F: Fruquintinib; R: Regorafenib; FP: Fruquintinib plus programmed death-1 inhibitors; RP: Regorafenib plus programmed death-1 inhibitors.
- Citation: An TQ, Qiu H, Zhou QB, Zong H, Hu S, Lian YG, Zhao RH. Efficacy comparison of fruquintinib, regorafenib monotherapy or plus programmed death-1 inhibitors for microsatellite stable metastatic colorectal cancer. World J Gastrointest Oncol 2024; 16(6): 2449-2462
- URL: https://www.wjgnet.com/1948-5204/full/v16/i6/2449.htm
- DOI: https://dx.doi.org/10.4251/wjgo.v16.i6.2449


