Copyright
©The Author(s) 2024.
World J Gastrointest Oncol. May 15, 2024; 16(5): 2233-2240
Published online May 15, 2024. doi: 10.4251/wjgo.v16.i5.2233
Published online May 15, 2024. doi: 10.4251/wjgo.v16.i5.2233
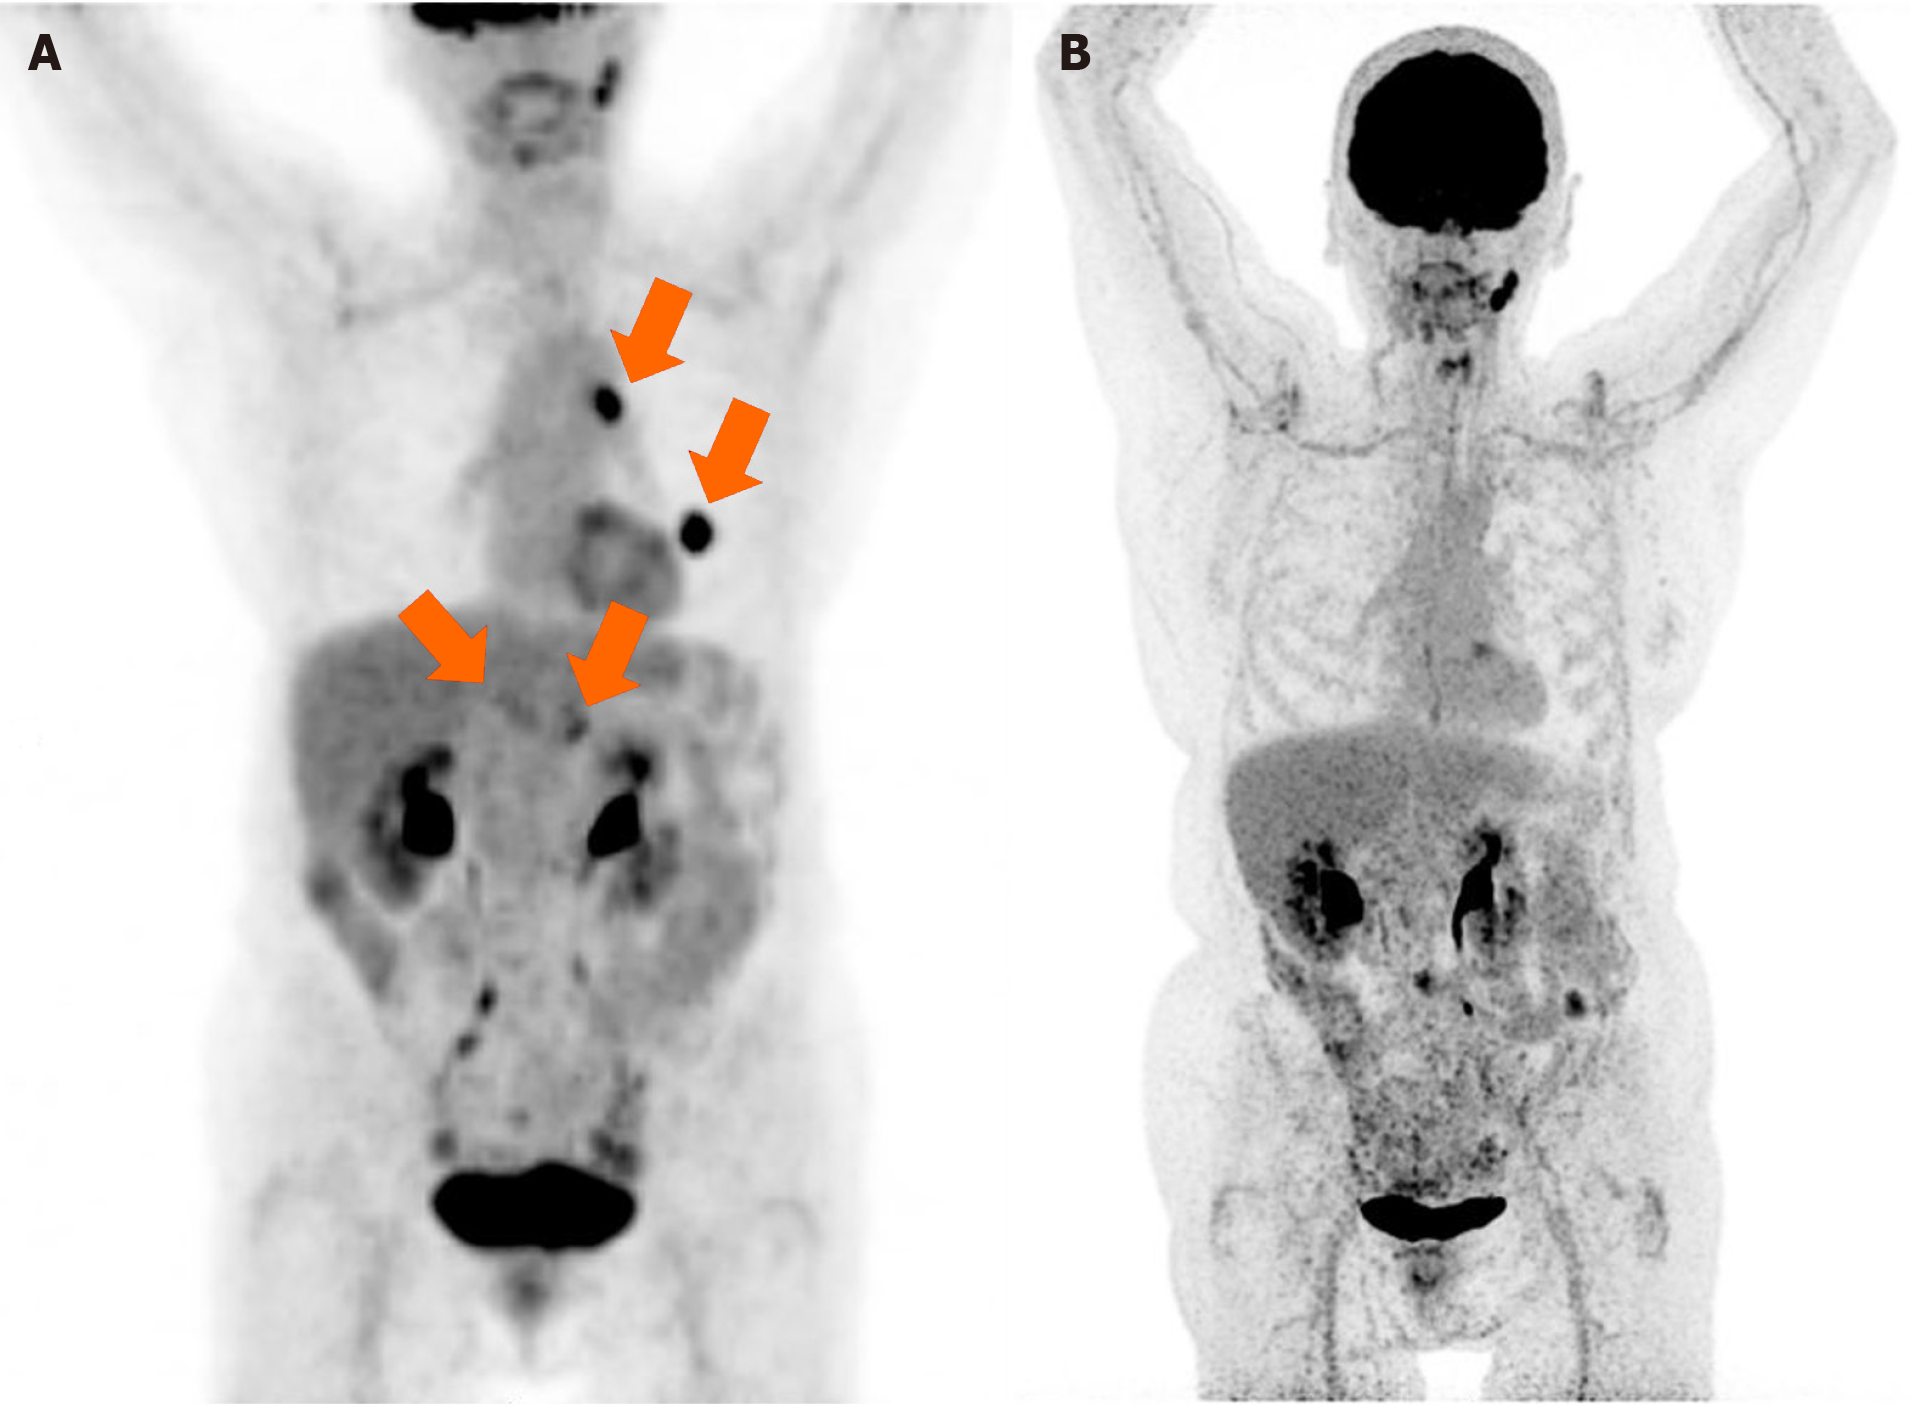
Figure 1 Positron emission tomography-computed tomography study with 18F-fluorodeoxyglucose in two time points, before and after of the pembrolizumab treatment.
A: Macrophage inflammatory protein images in March 2018; B: Macrophage inflammatory protein images in May 2022.
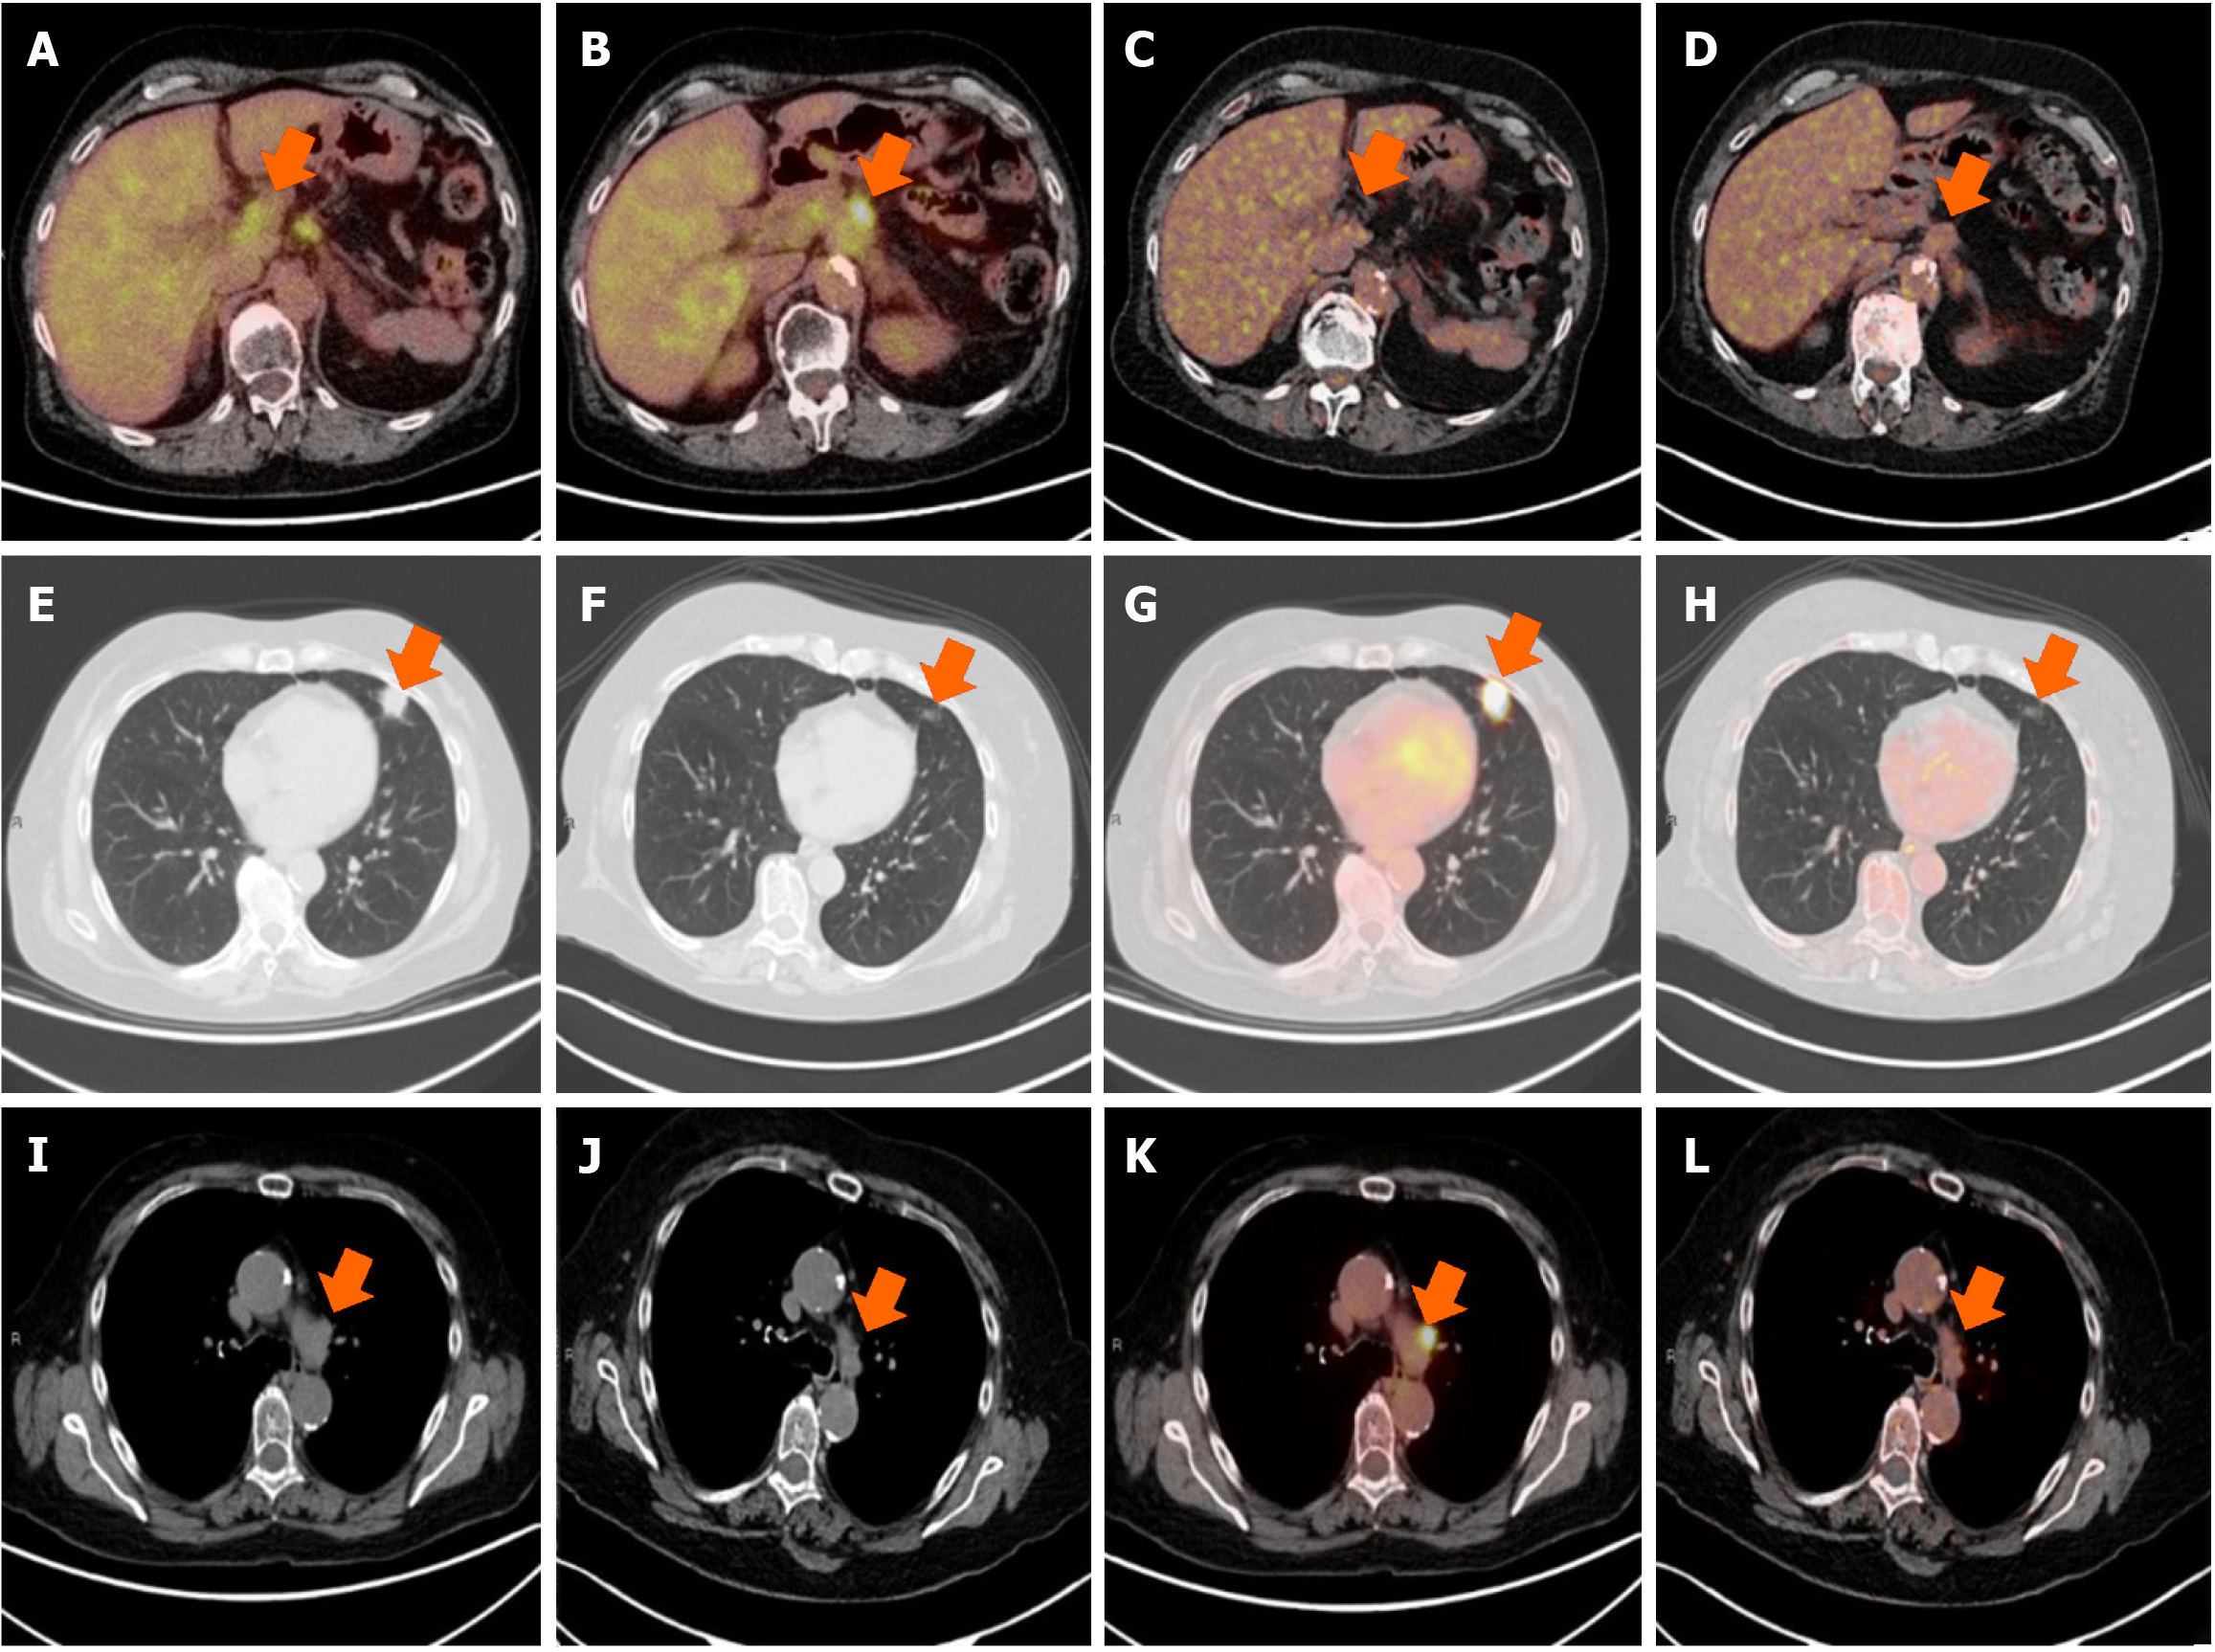
Figure 2 Positron emission tomography-computed tomography study with 18F-fluorodeoxyglucose in two time points, before and after of the pembrolizumab treatment.
A-D: Positron emission tomography (PET)-computed tomography (CT) fusion images with hepatic hilum uptake (arrow in A) and in pancreatic body (arrow in B) that disappear after treatment (arrows in C and D); E-H: CT images with lung parenchyma window (E and F) and fusion (G and H), showing a hypermetabolic pulmonary nodule in the inferior lingula (arrows in E and G) in the baseline study, which disappears in the post-treatment study images (arrows in F and H); I-L: CT images with mediastinal window (I and J) and fusion (K and L), in which a mediastinal lymph node is observed in the G5 space (arrows in I and K) of the baseline study, which disappears in the images of the study after treatment (arrows in J and L).
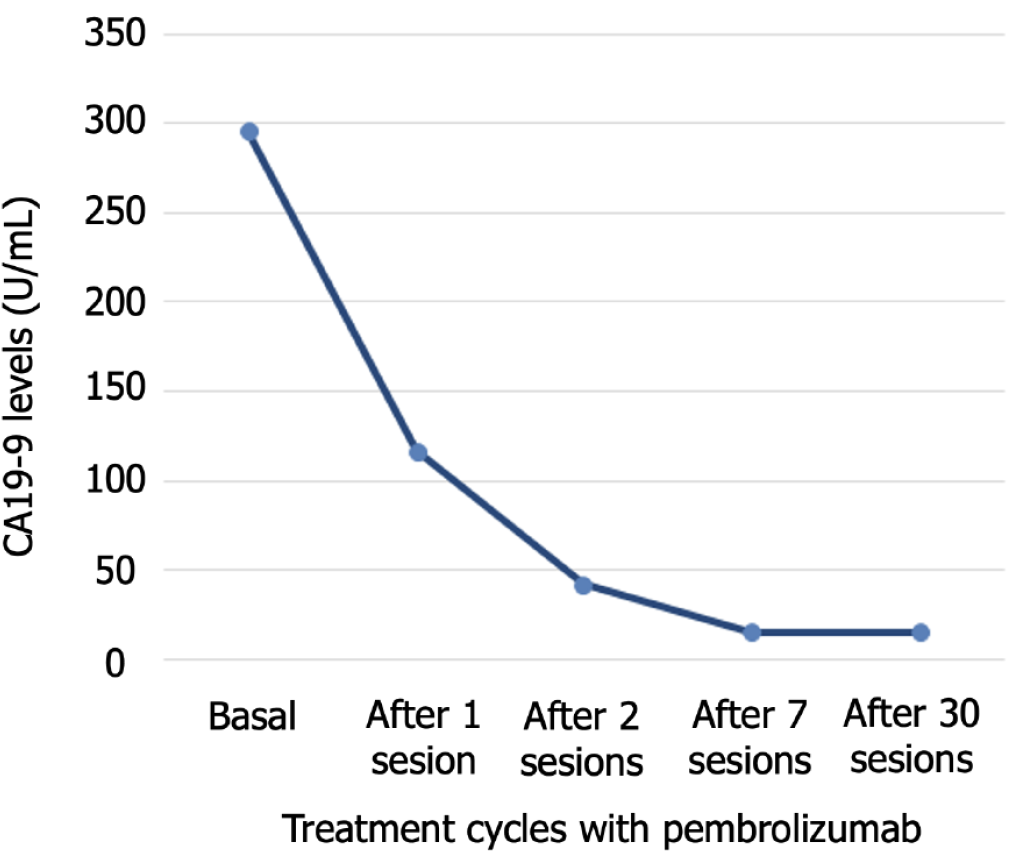
Figure 3 Carbohydrate antigen 19-9 levels throughout treatment with pembrolizumab.
CA19-9: Carbohydrate antigen-19-9.
Figure 4 Timeline of the course of the disease with date and months since diagnosis indicated.
GEM: Gemcitabine; nab-P: Nab-paclitaxel; mPDAC: Metastatic pancreatic ductal adenocarcinoma; mLC: Metastatic lung cancer; CR: Complete response.
- Citation: Martínez-Galán J, Jiménez-Luna C, Rodriguez I, Maza E, García-Collado C, Rodríguez-Fernández A, López-Hidalgo JL, Caba O. Metastatic pancreatic and lung cancer patient in complete remission following immunotherapy: A case report and review of literature. World J Gastrointest Oncol 2024; 16(5): 2233-2240
- URL: https://www.wjgnet.com/1948-5204/full/v16/i5/2233.htm
- DOI: https://dx.doi.org/10.4251/wjgo.v16.i5.2233


