Copyright
©The Author(s) 2024.
World J Gastrointest Oncol. May 15, 2024; 16(5): 2181-2199
Published online May 15, 2024. doi: 10.4251/wjgo.v16.i5.2181
Published online May 15, 2024. doi: 10.4251/wjgo.v16.i5.2181
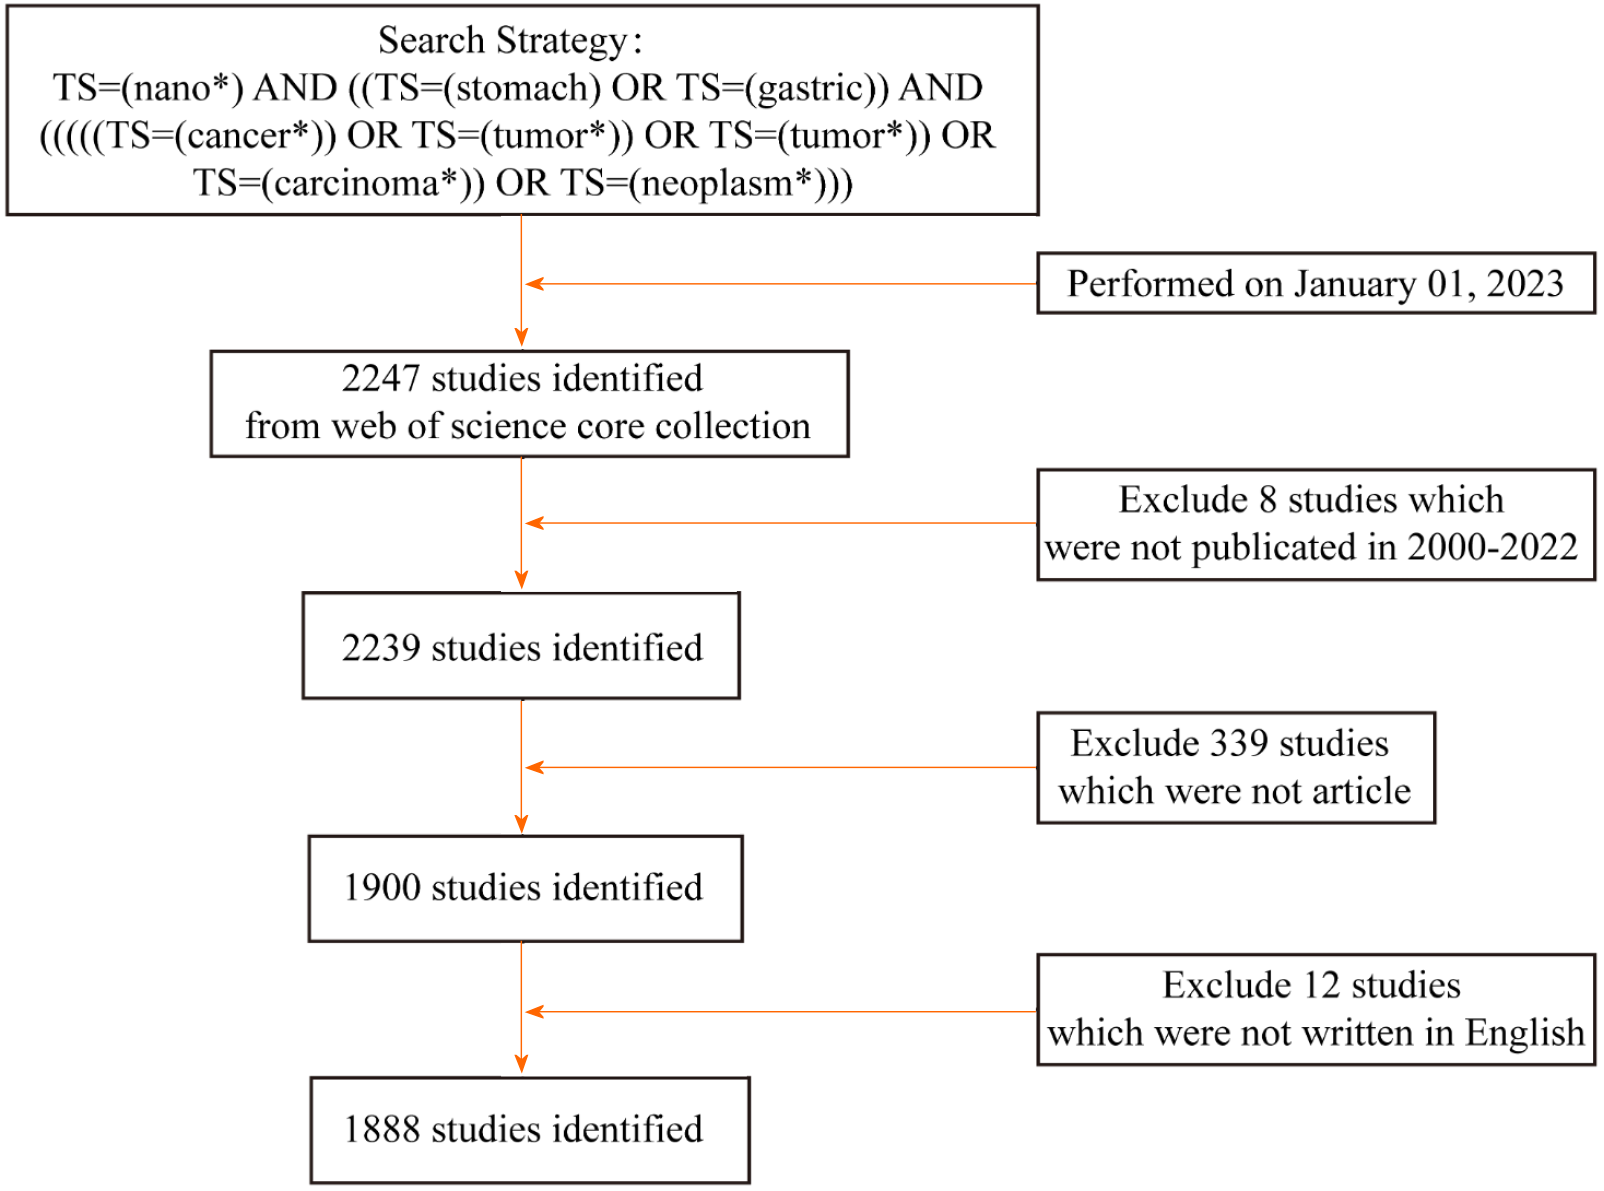
Figure 1 Flow chart of the studies used in the analysis.
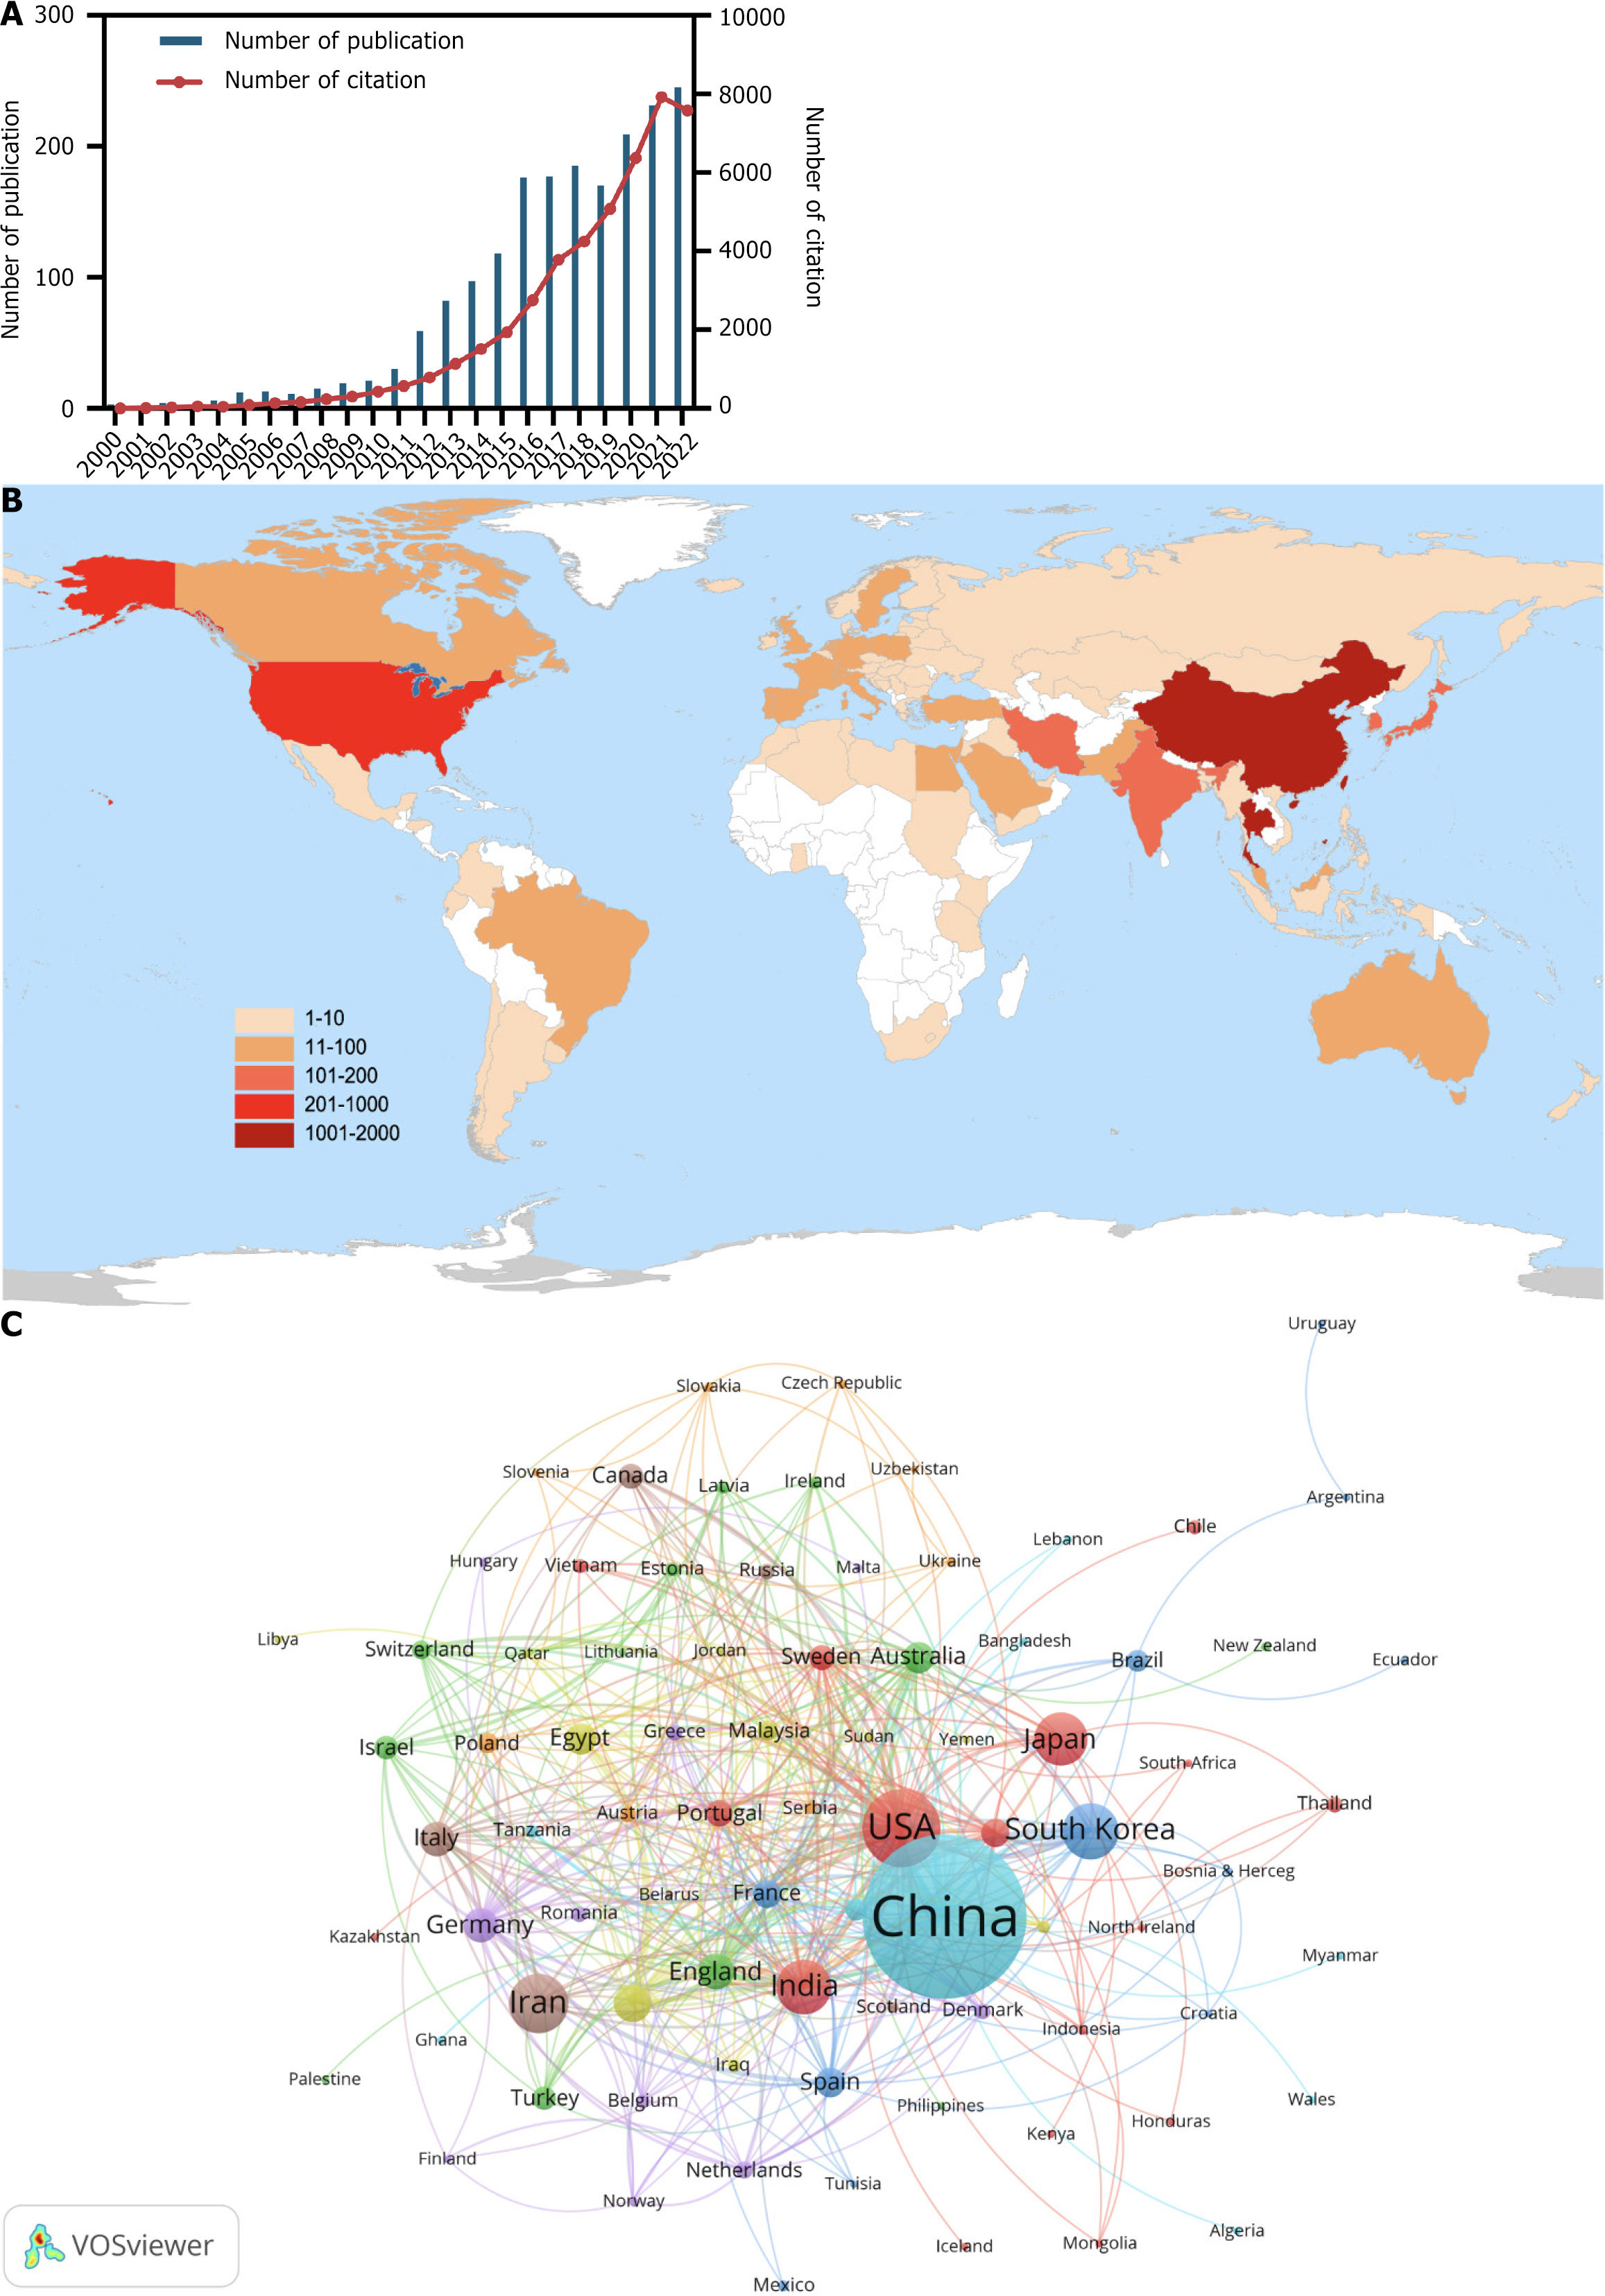
Figure 2 Geographic and temporal distributions of publications.
A: Annual publication and citation values between 2000 and 2022; B: Distribution of countries/regions; C: Co-authorship network of countries/regions.
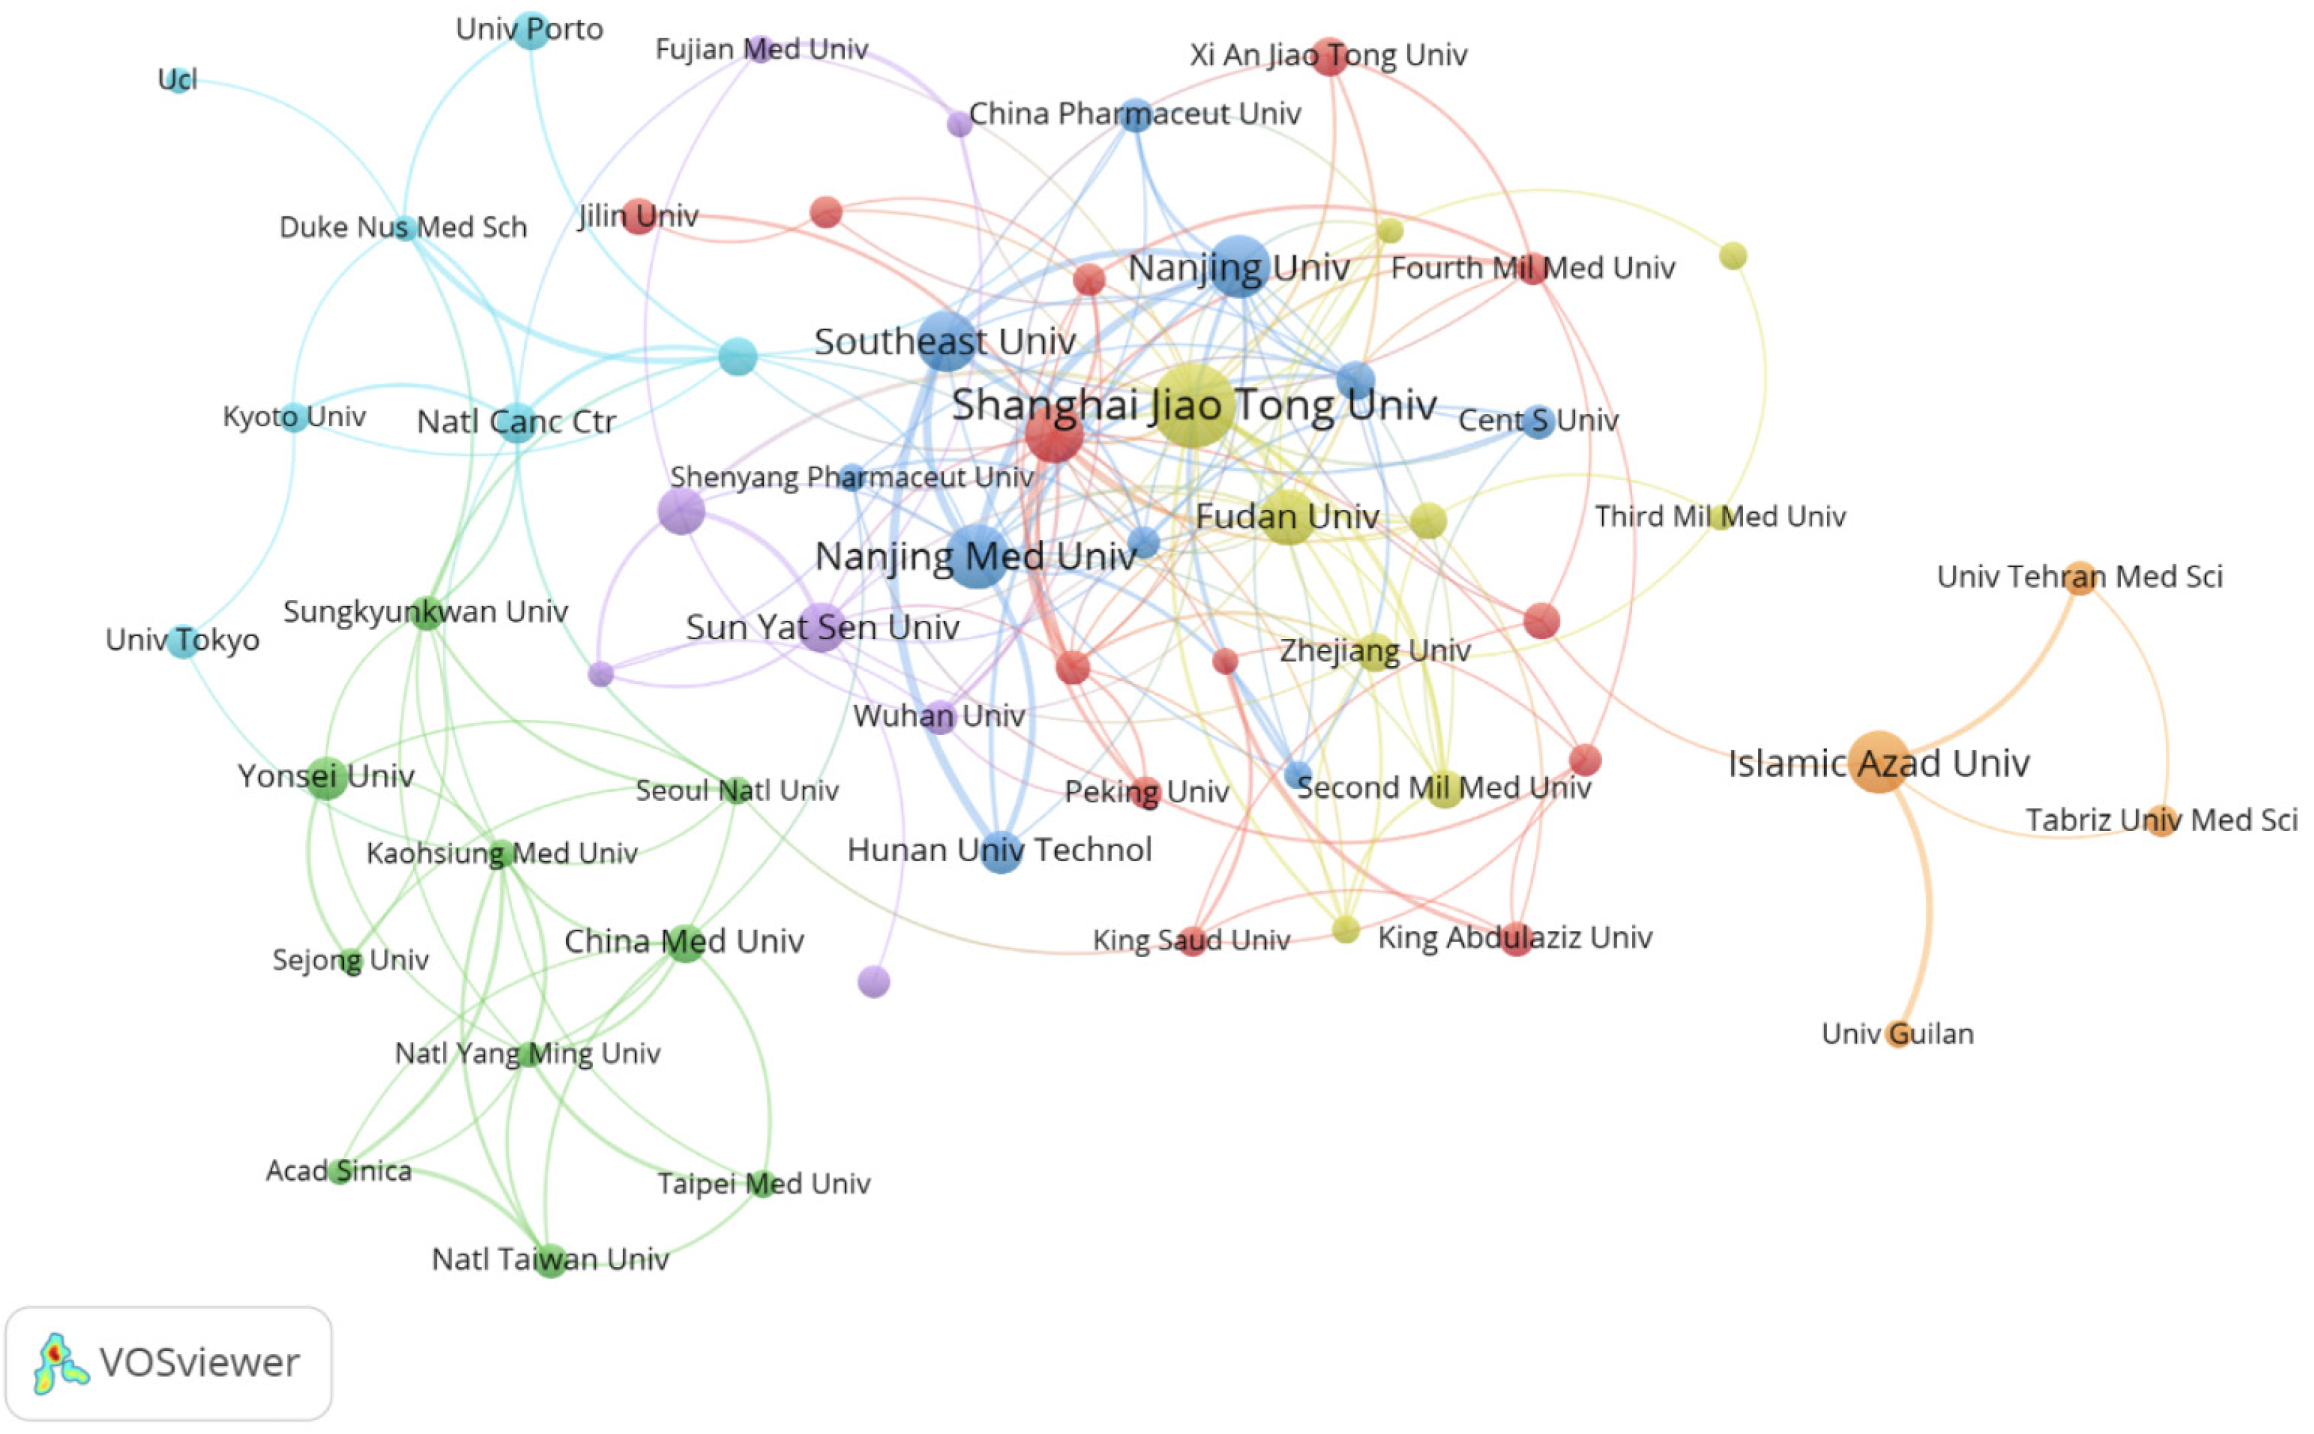
Figure 3 Co-authorship network of institutions.
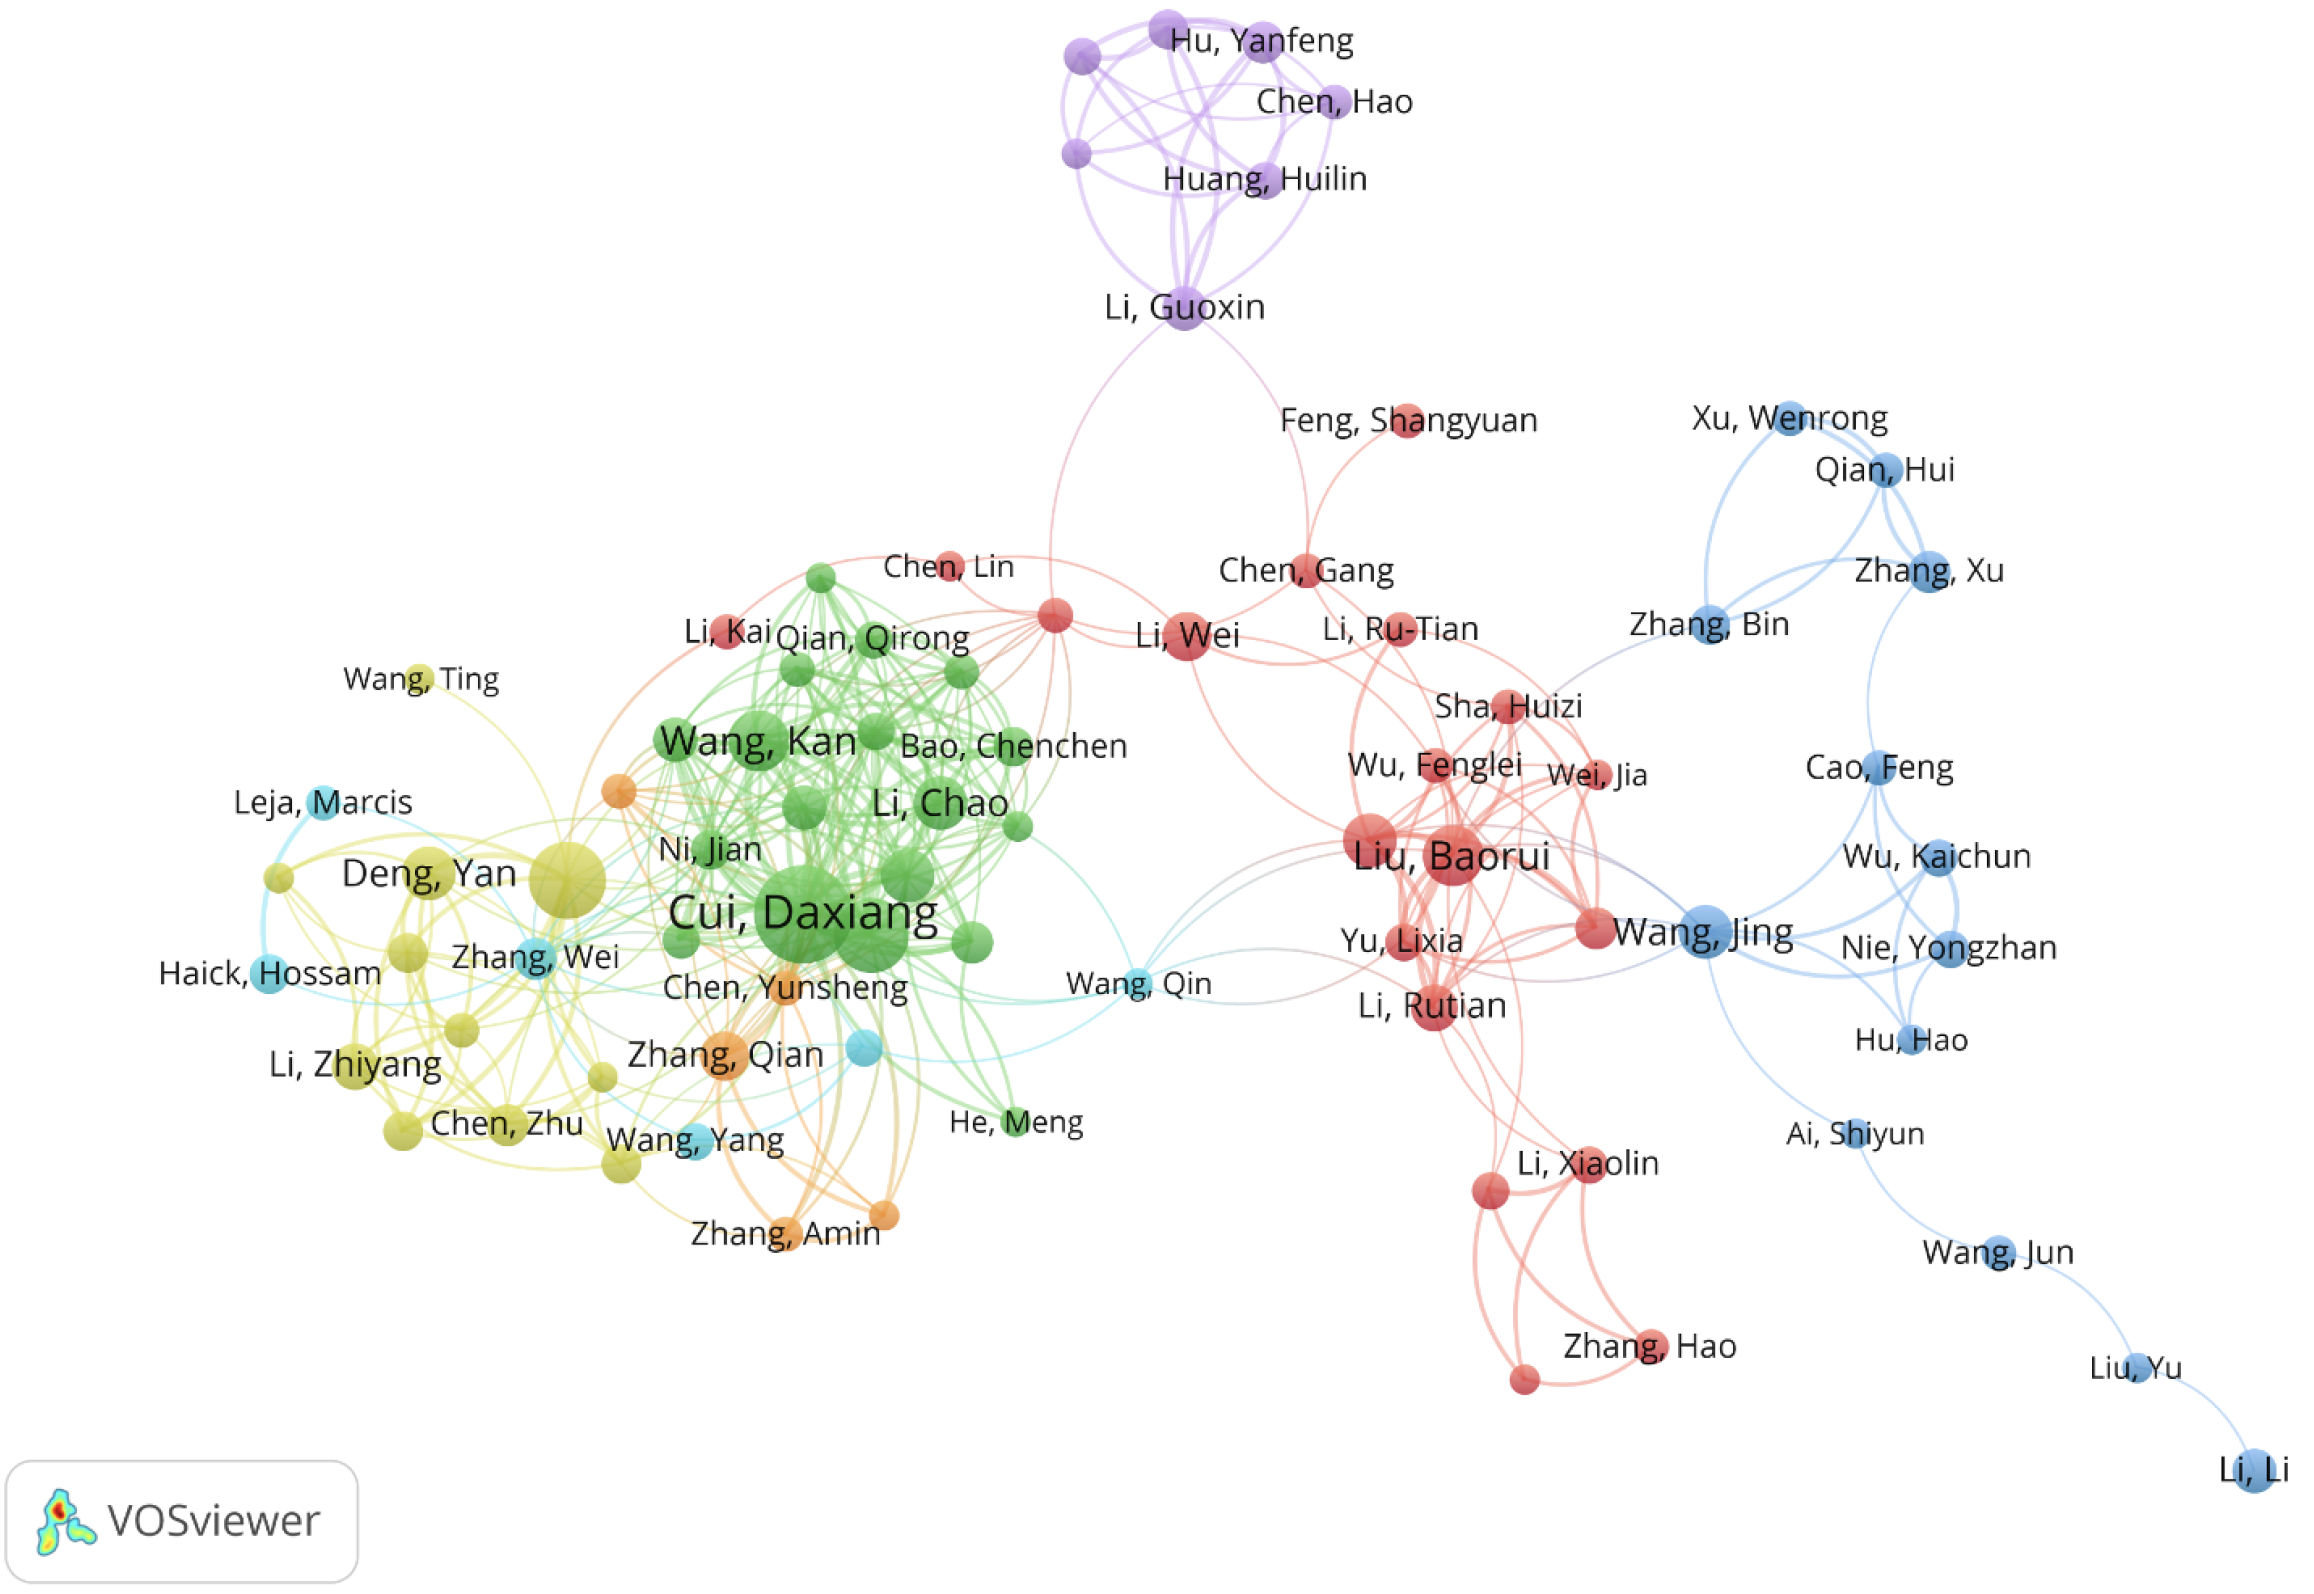
Figure 4 Co-authorship network of authors.
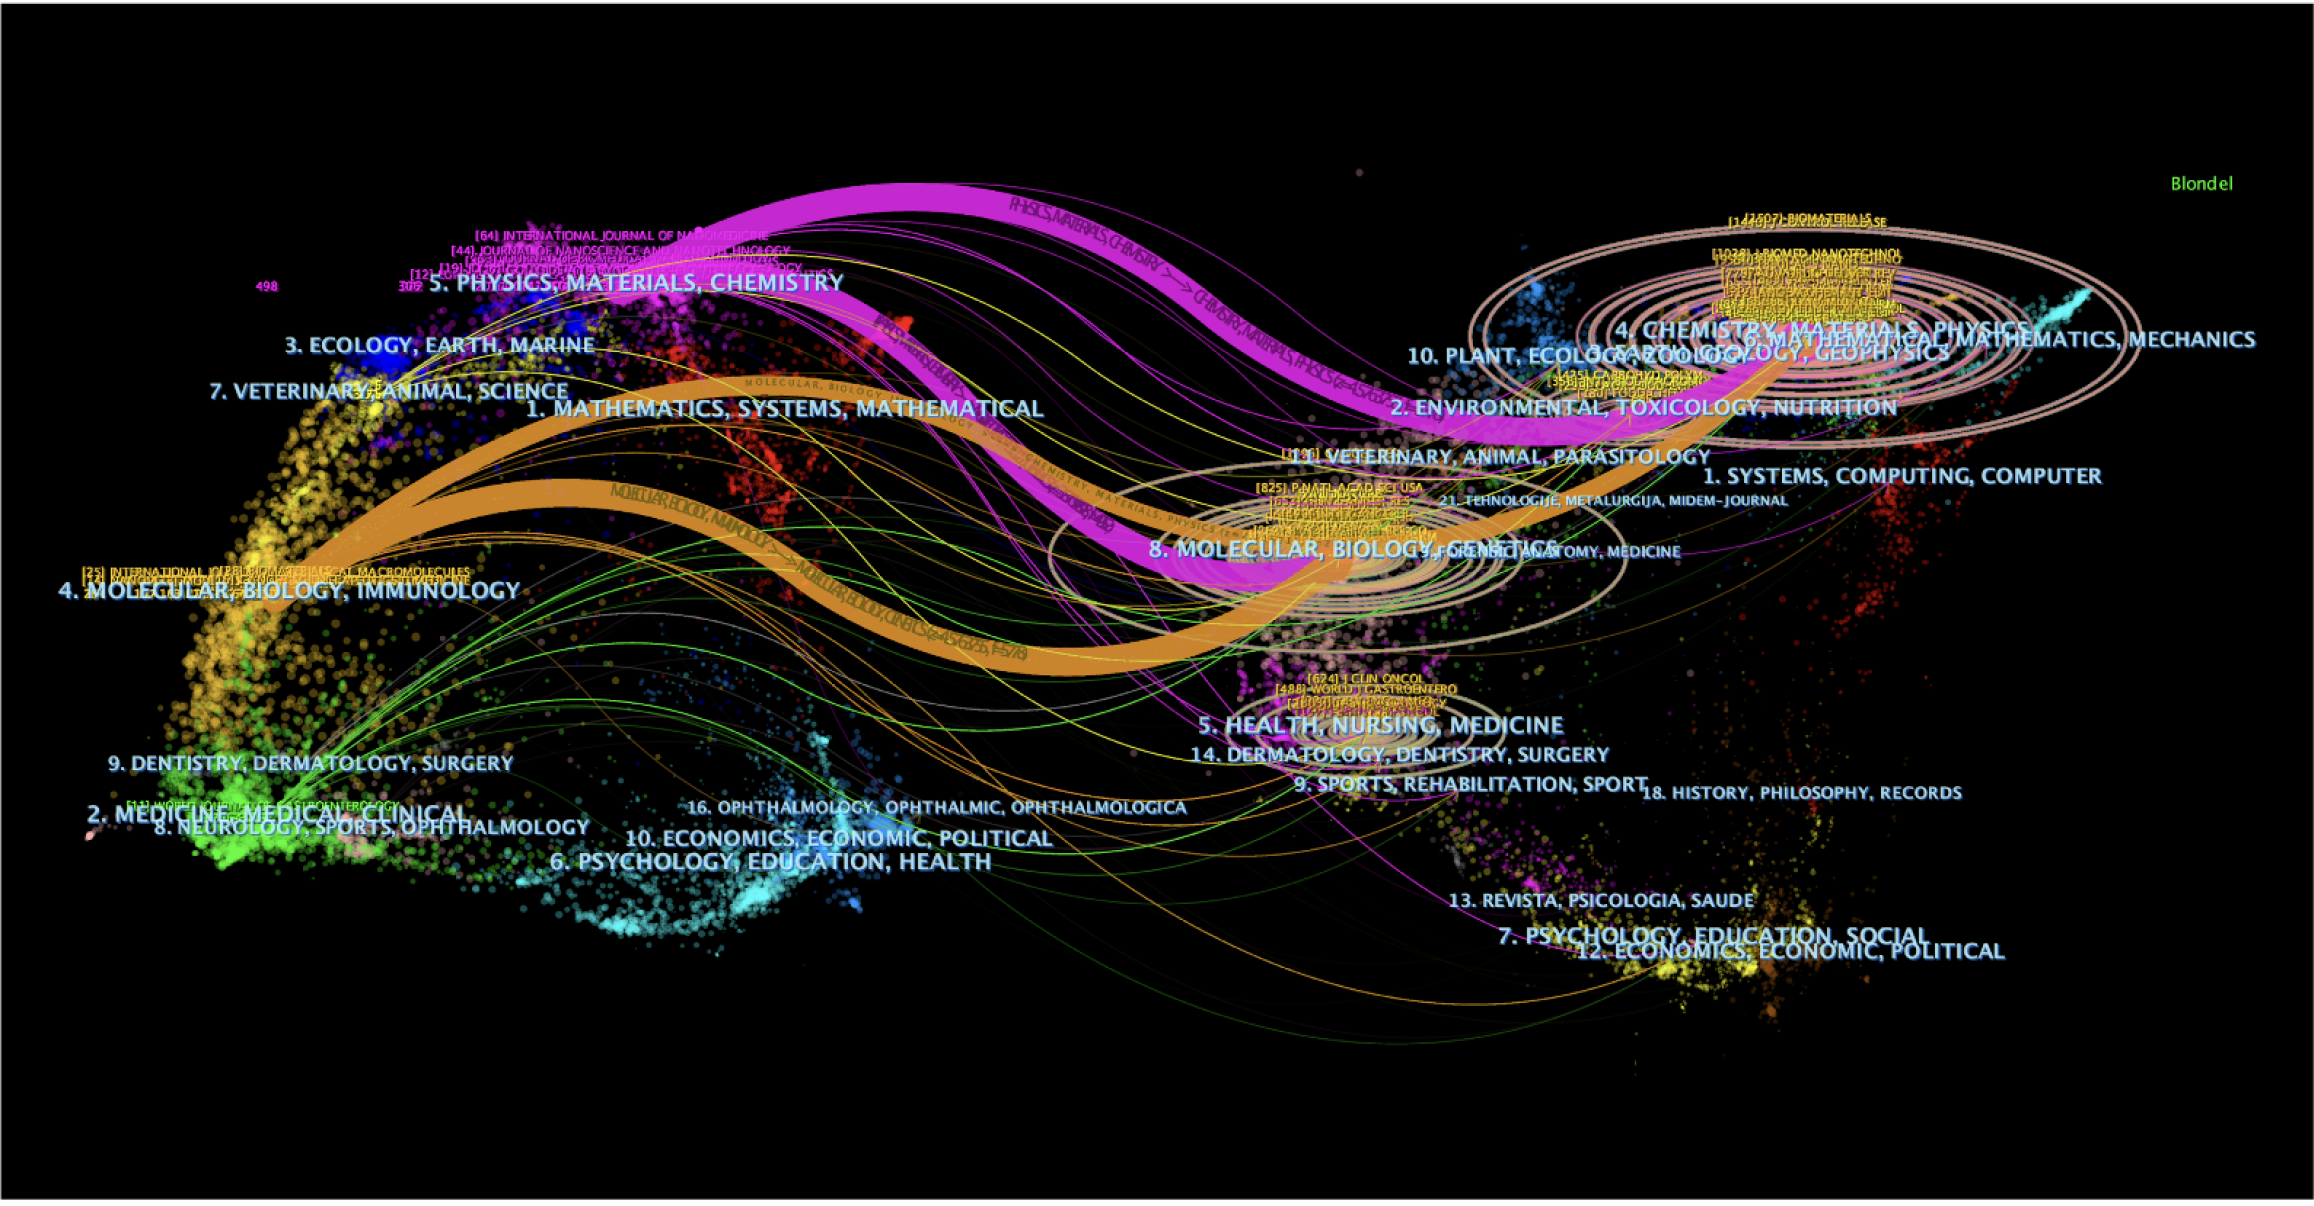
Figure 5 Dual-map overlay of nanomaterials in gastric cancer literature.
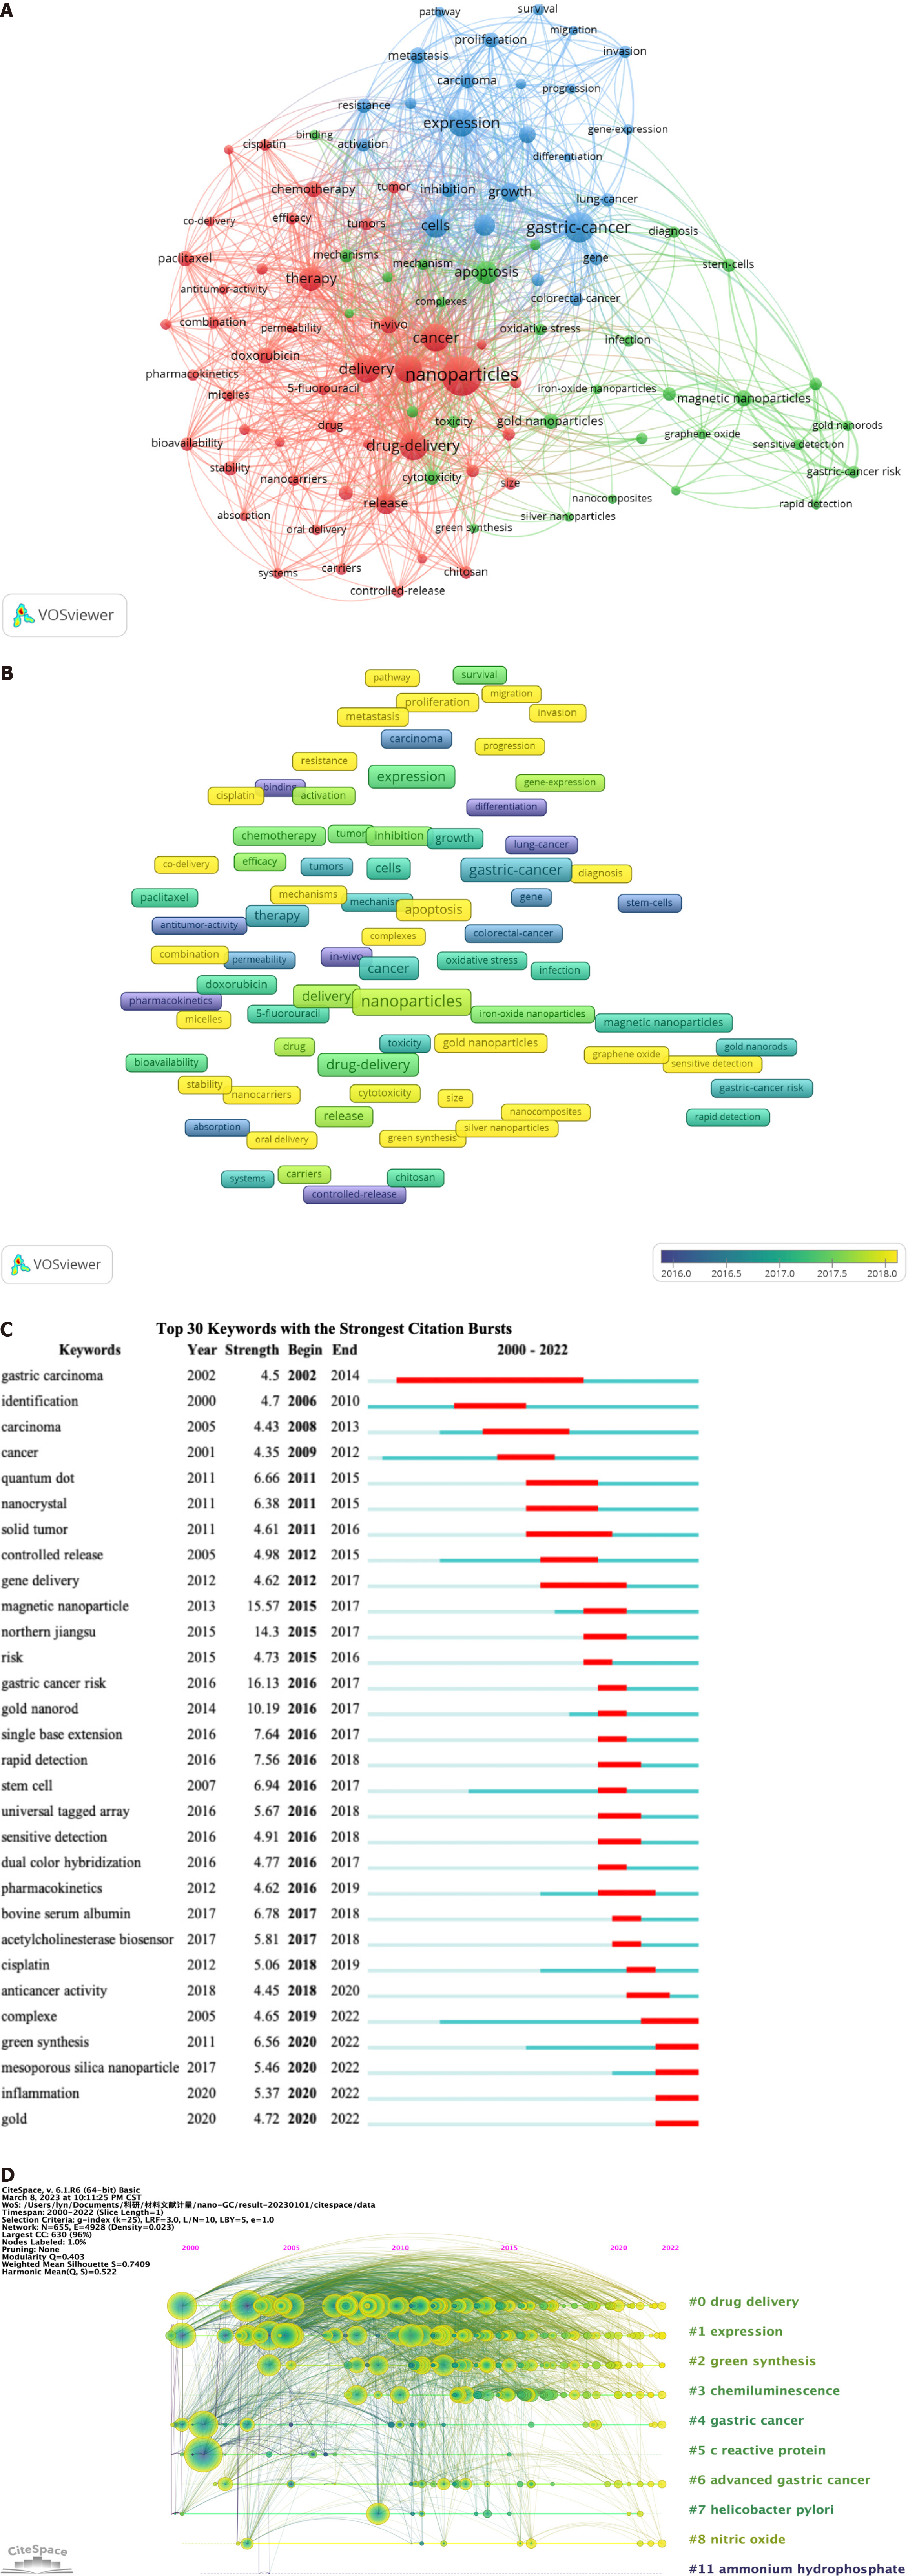
Figure 6 Analysis of dominant keywords.
A: Co-occurrence cluster analysis of the top 100 keywords; B: Overlay map of the top 100 keywords; C: Detection of the top 30 keywords for the citation burst; D: Timeline view for co-word analysis.
- Citation: Liu BN, Gao XL, Piao Y. Mapping the intellectual structure and emerging trends for the application of nanomaterials in gastric cancer: A bibliometric study. World J Gastrointest Oncol 2024; 16(5): 2181-2199
- URL: https://www.wjgnet.com/1948-5204/full/v16/i5/2181.htm
- DOI: https://dx.doi.org/10.4251/wjgo.v16.i5.2181


