Copyright
©The Author(s) 2024.
World J Gastrointest Oncol. May 15, 2024; 16(5): 2123-2140
Published online May 15, 2024. doi: 10.4251/wjgo.v16.i5.2123
Published online May 15, 2024. doi: 10.4251/wjgo.v16.i5.2123
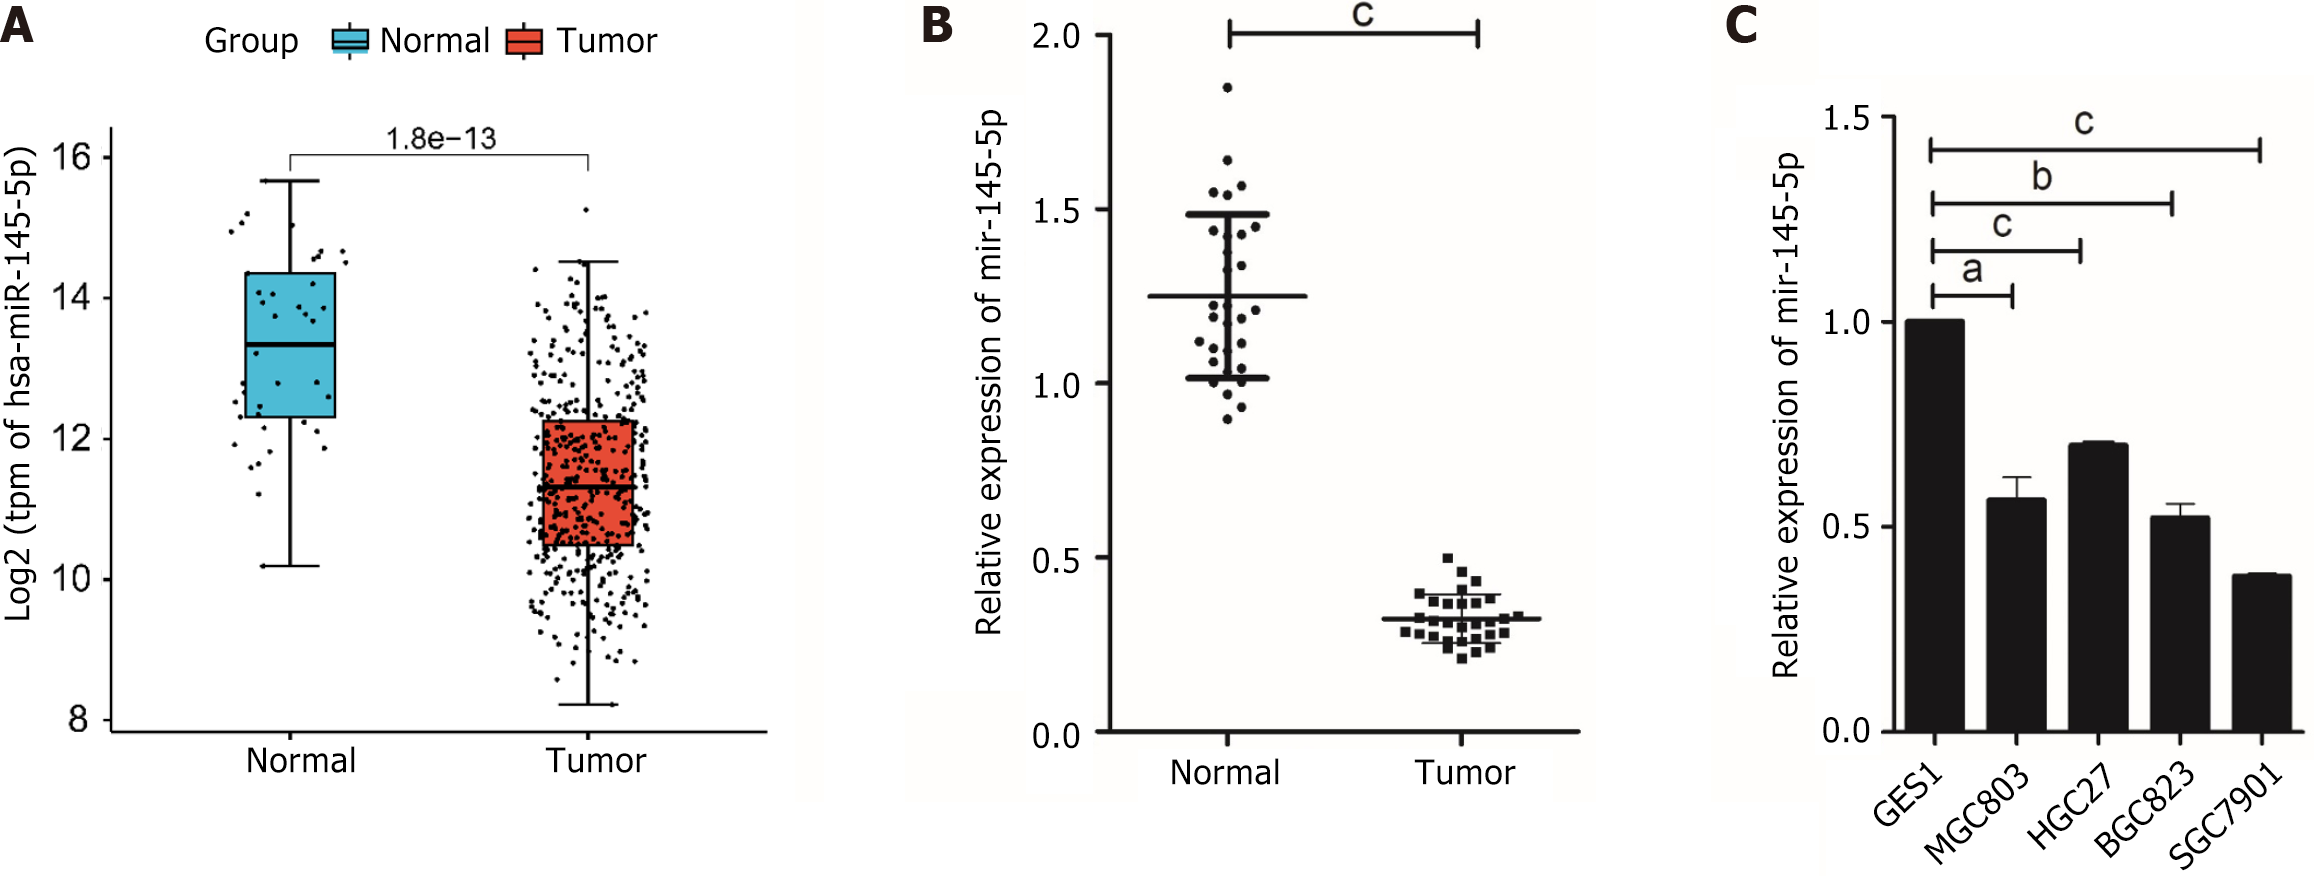
Figure 1 MicroRNA-145-5p is poorly expressed in gastric cancer tissues and cells.
A: Box diagram showing the differential expression of microRNA-145-5p (miR-145-5p) in normal and tumor data from The Cancer Genome Atlas-STAD; B: Differentially expressed miR-145-5p in the normal and tumor groups; C: MiR-145-5p expression in four gastric cancer (GC) cell lines, MGC803, HGC27, BGC823, SGC7901, and the normal GC line, GES-1. aP < 0.05; bP < 0.01; cP < 0.001.
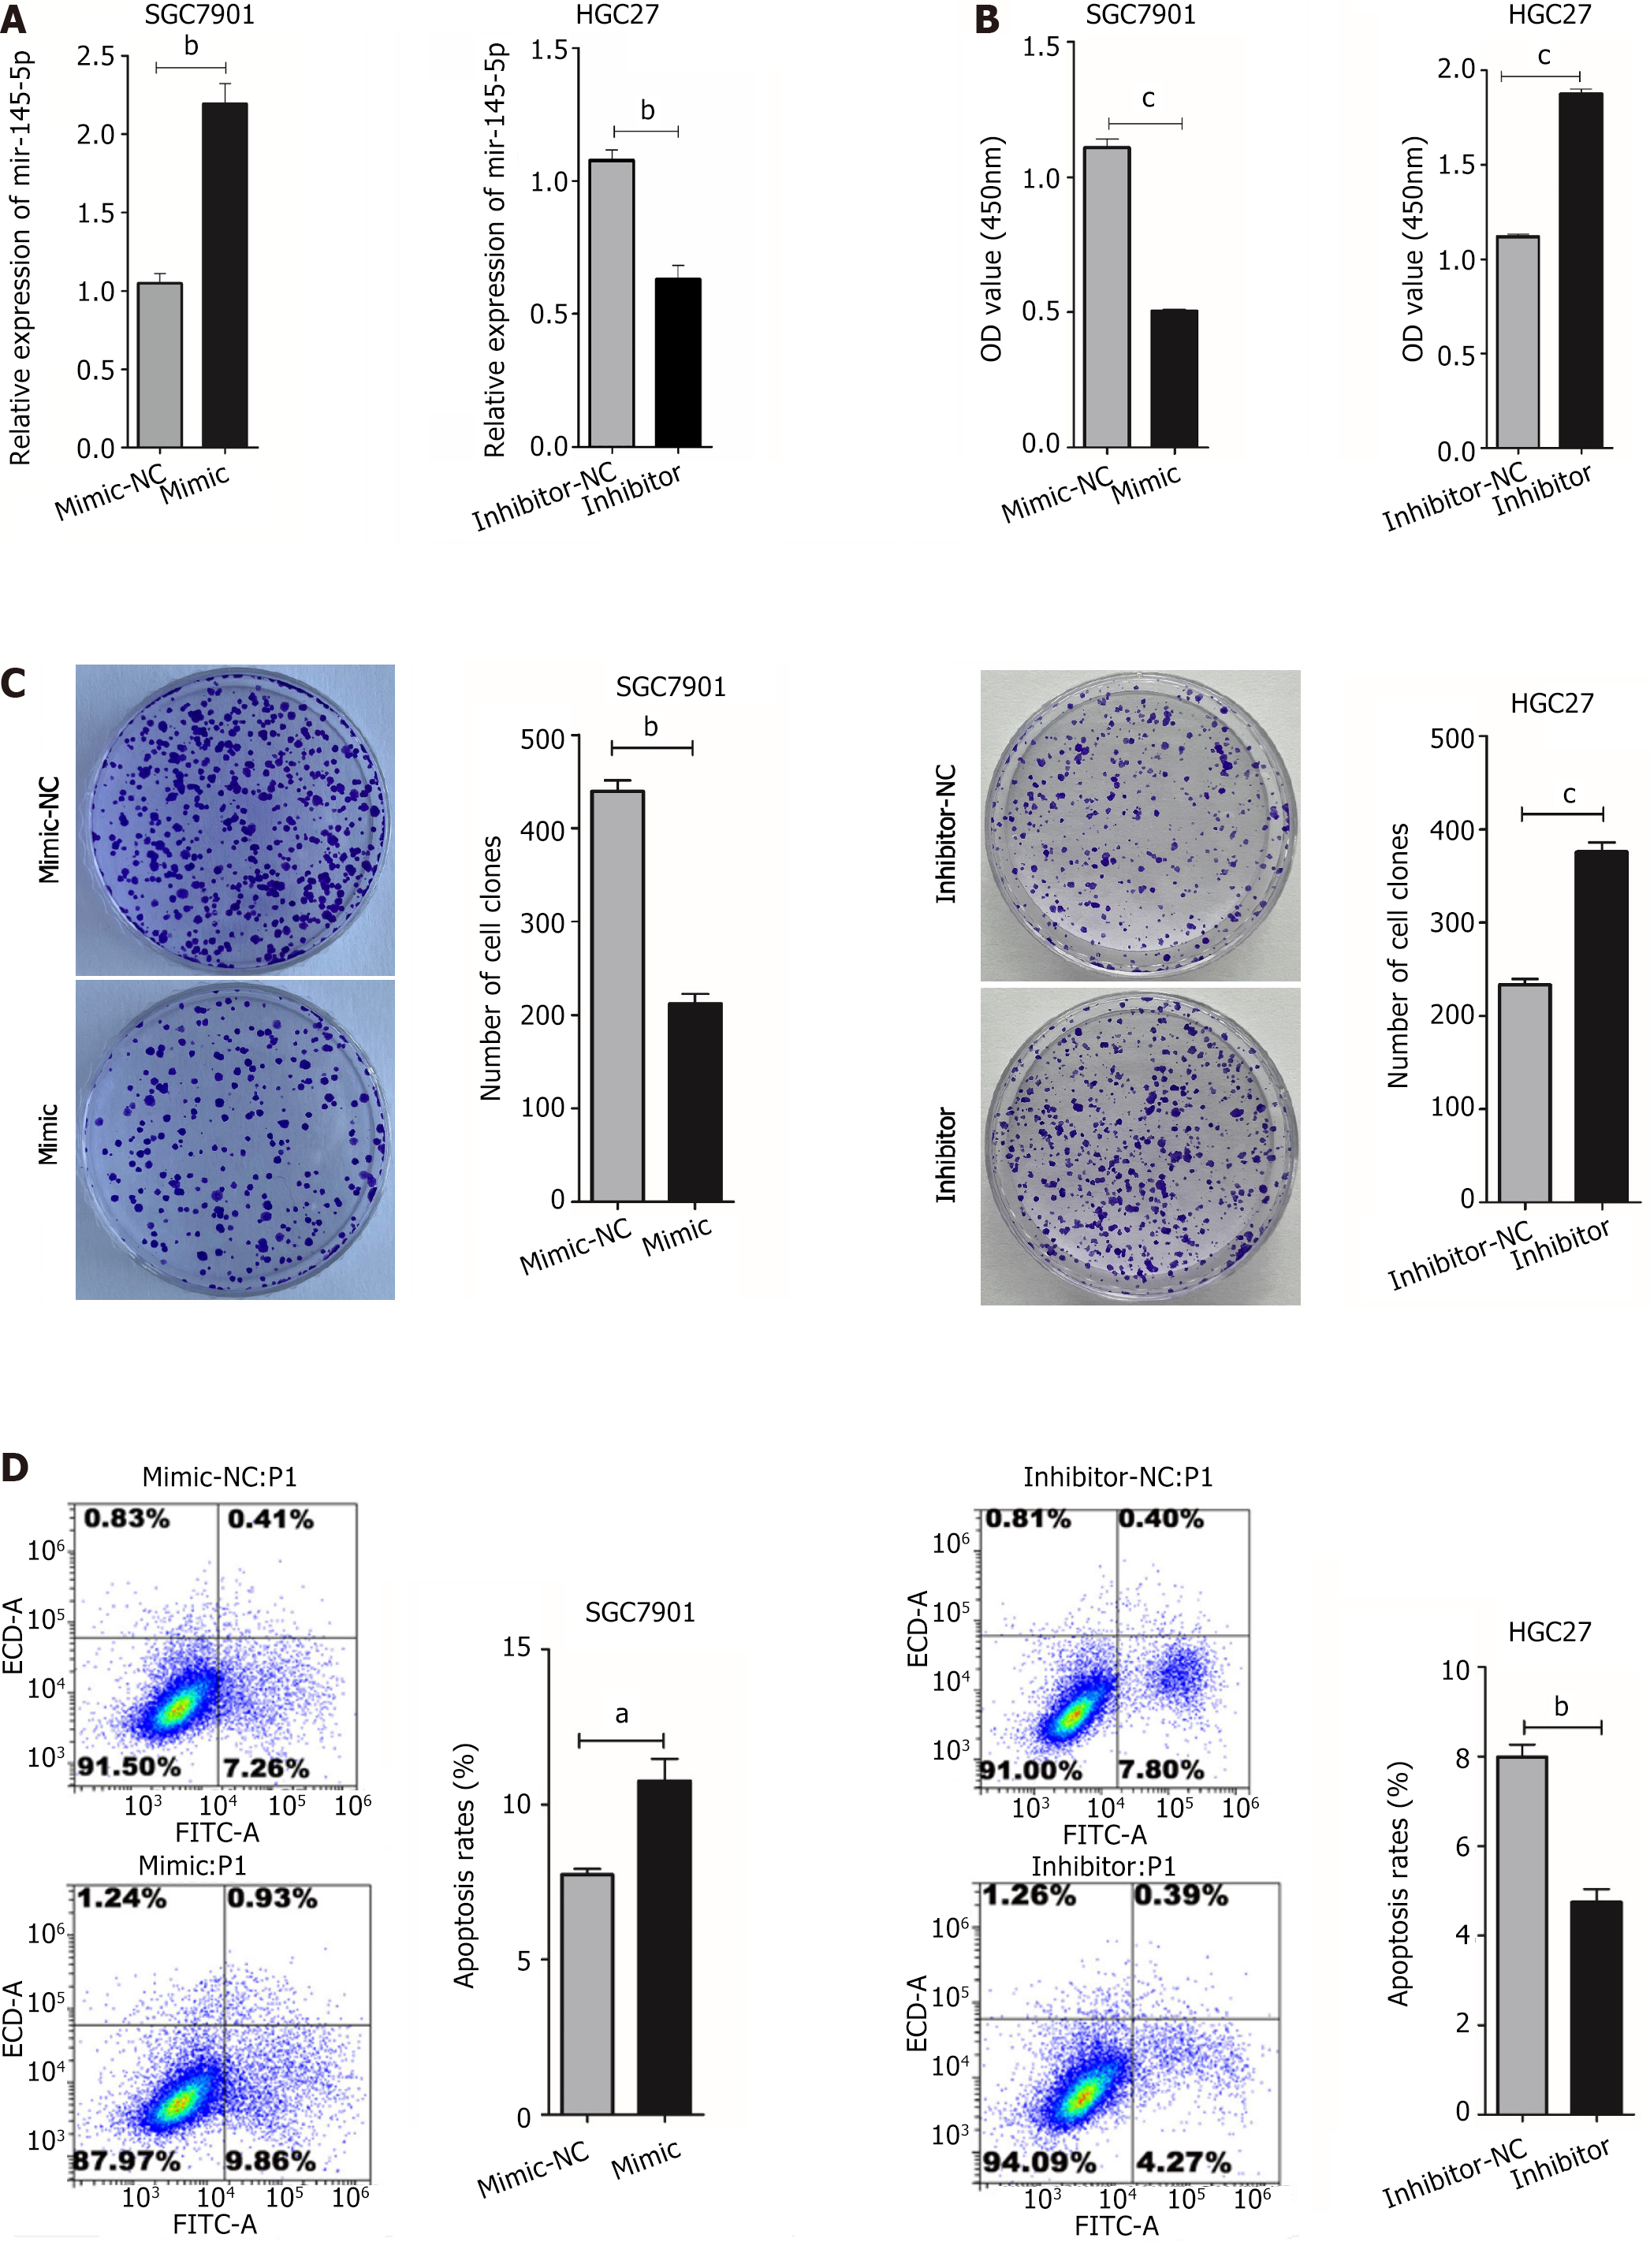
Figure 2 MicroRNA-145-5p inhibits gastric cancer cell proliferation and promotes apoptosis.
A: MicroRNA-145-5p expression in transfected gastric cancer cells; B: HGC27 and SGC7901 cell proliferation was evaluated using a cell counting kit-8; C: Colony formation assay; D: HGC27 and SGC7901 cell apoptosis. aP < 0.05; bP < 0.01; cP < 0.001.
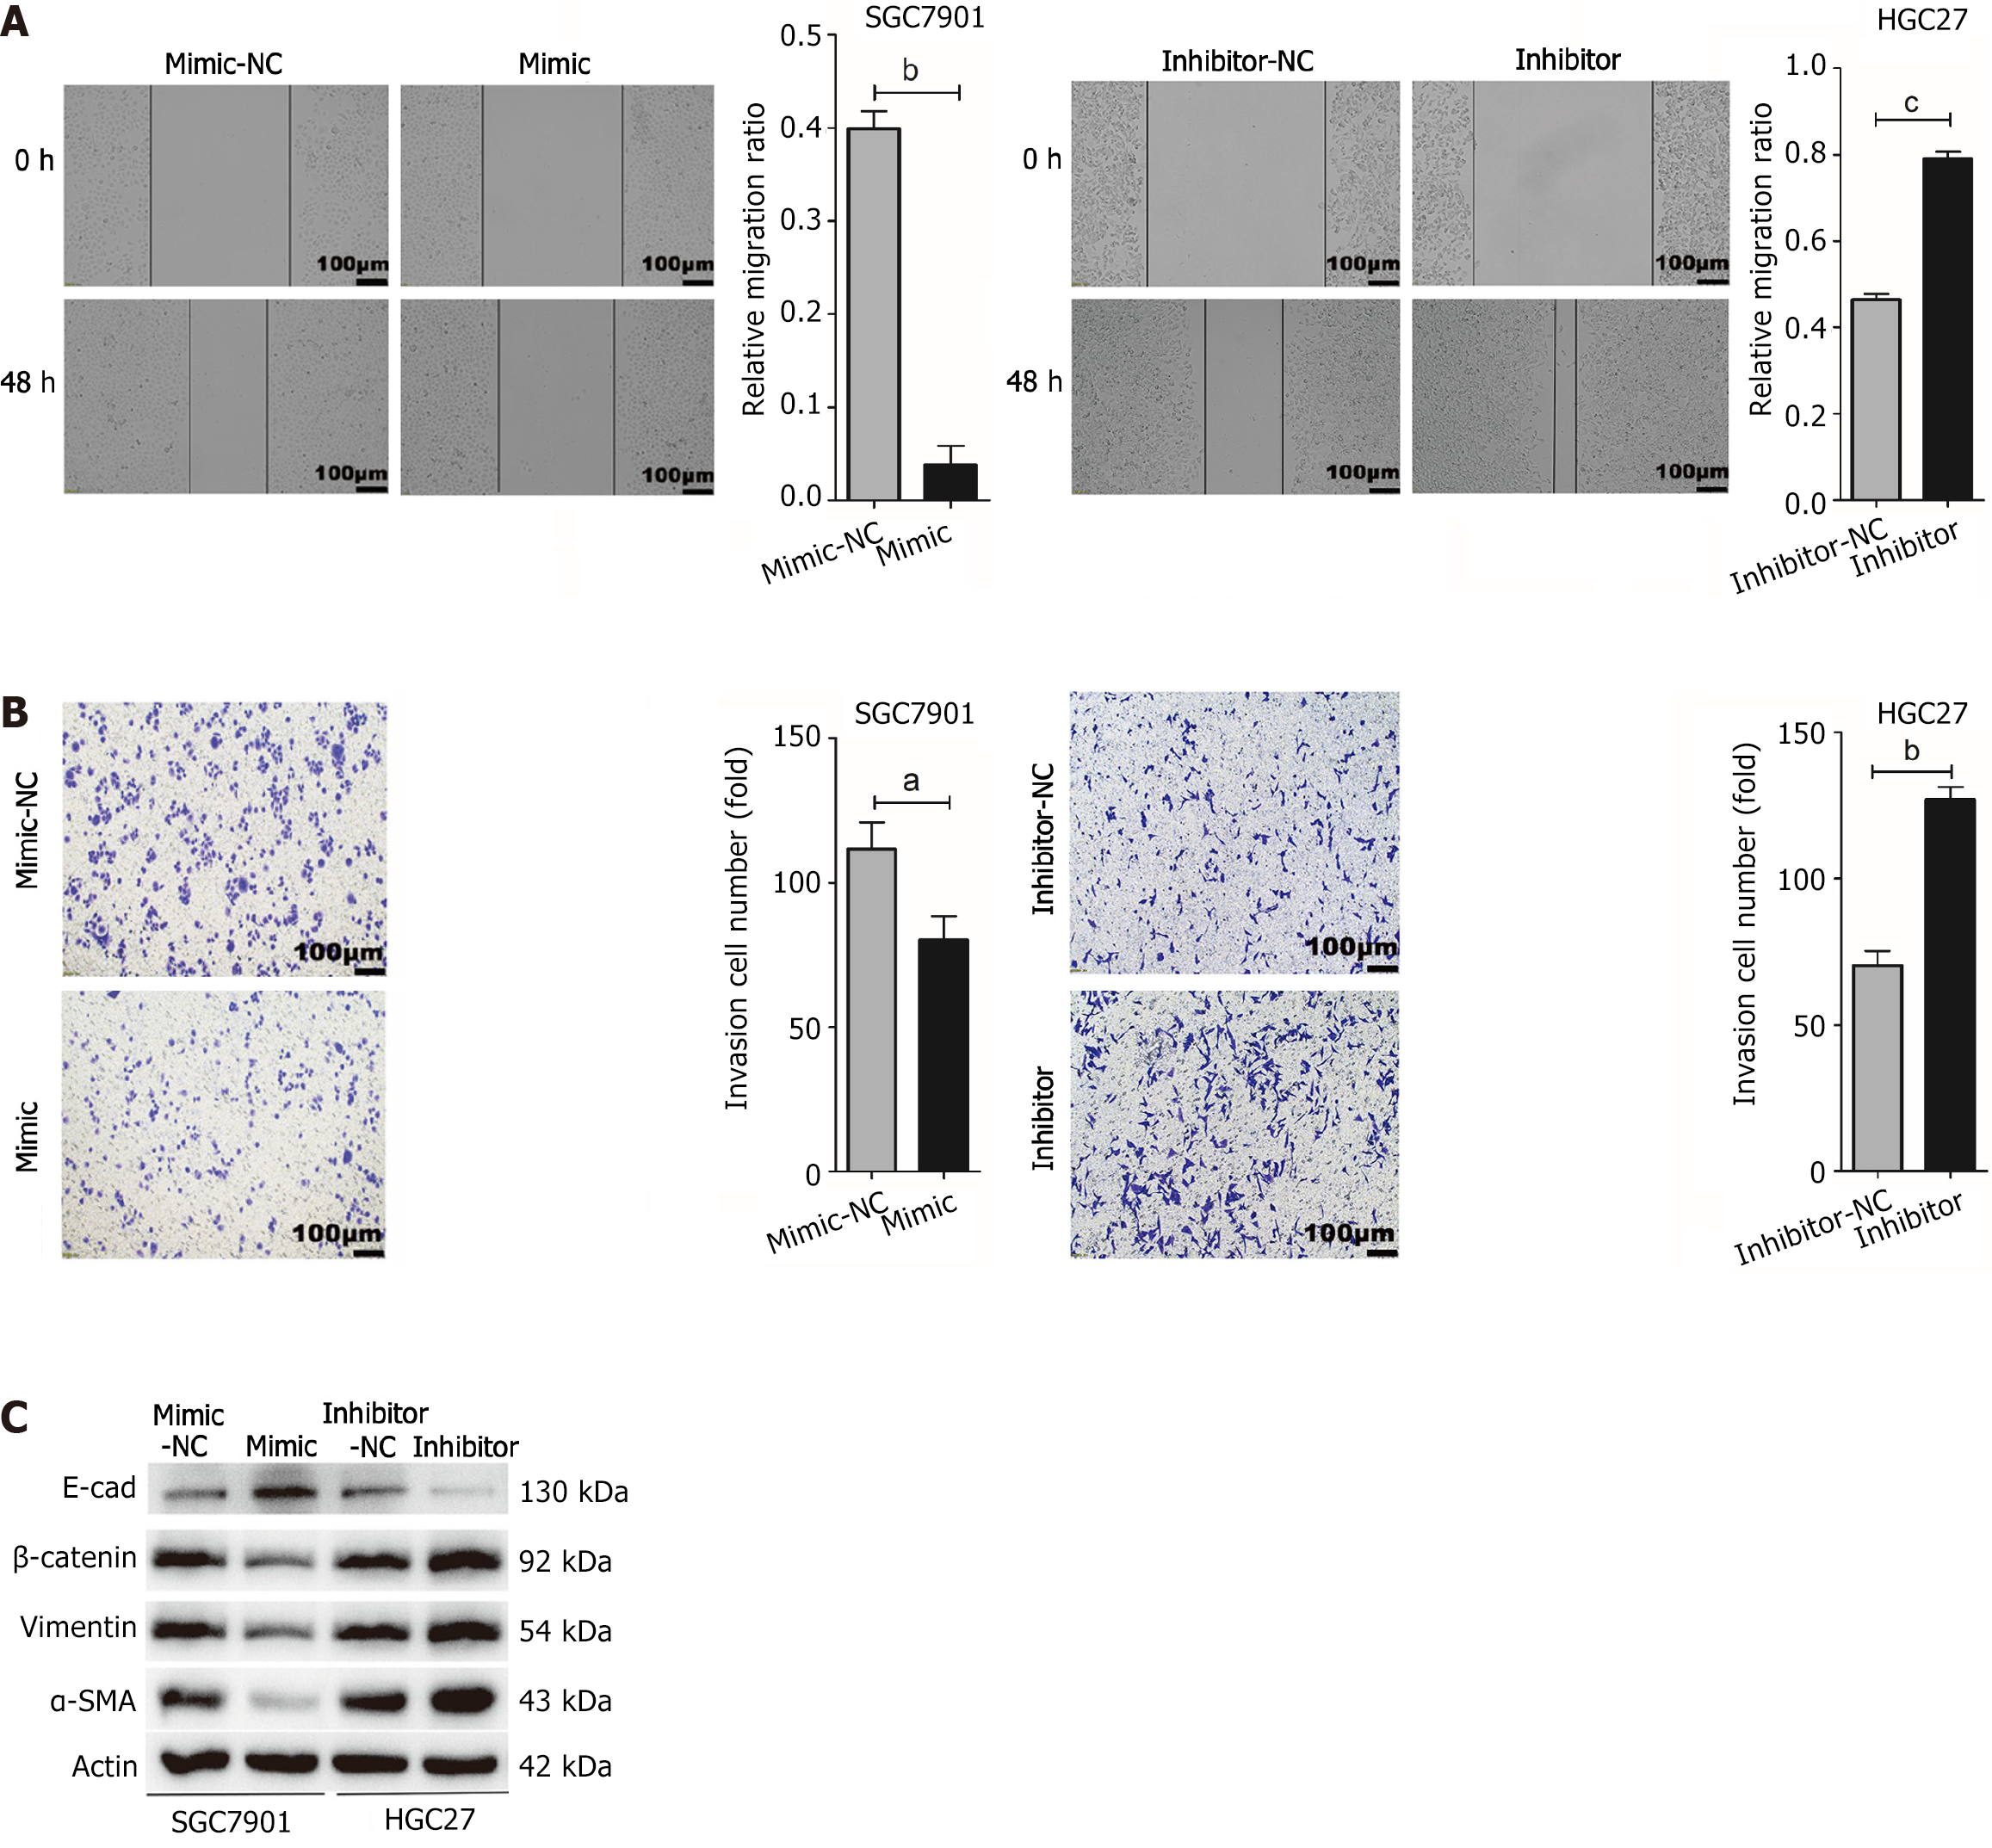
Figure 3 MicroRNA-145-5p inhibits gastric cancer cell migration, invasion, and epithelial-mesenchymal transition.
A: HGC27 and SGC7901 cell migration; scale bar = 100 μm; B: HGC27 and SGC7901 cell invasion; scale bar = 100 μm; C: Epithelial-mesenchymal transition-related marker protein (E-cadherin, β-catenin, vimentin, and α-smooth muscle actin) expression in HGC27 and SGC7901 cells. aP < 0.05; bP < 0.01; cP < 0.001.
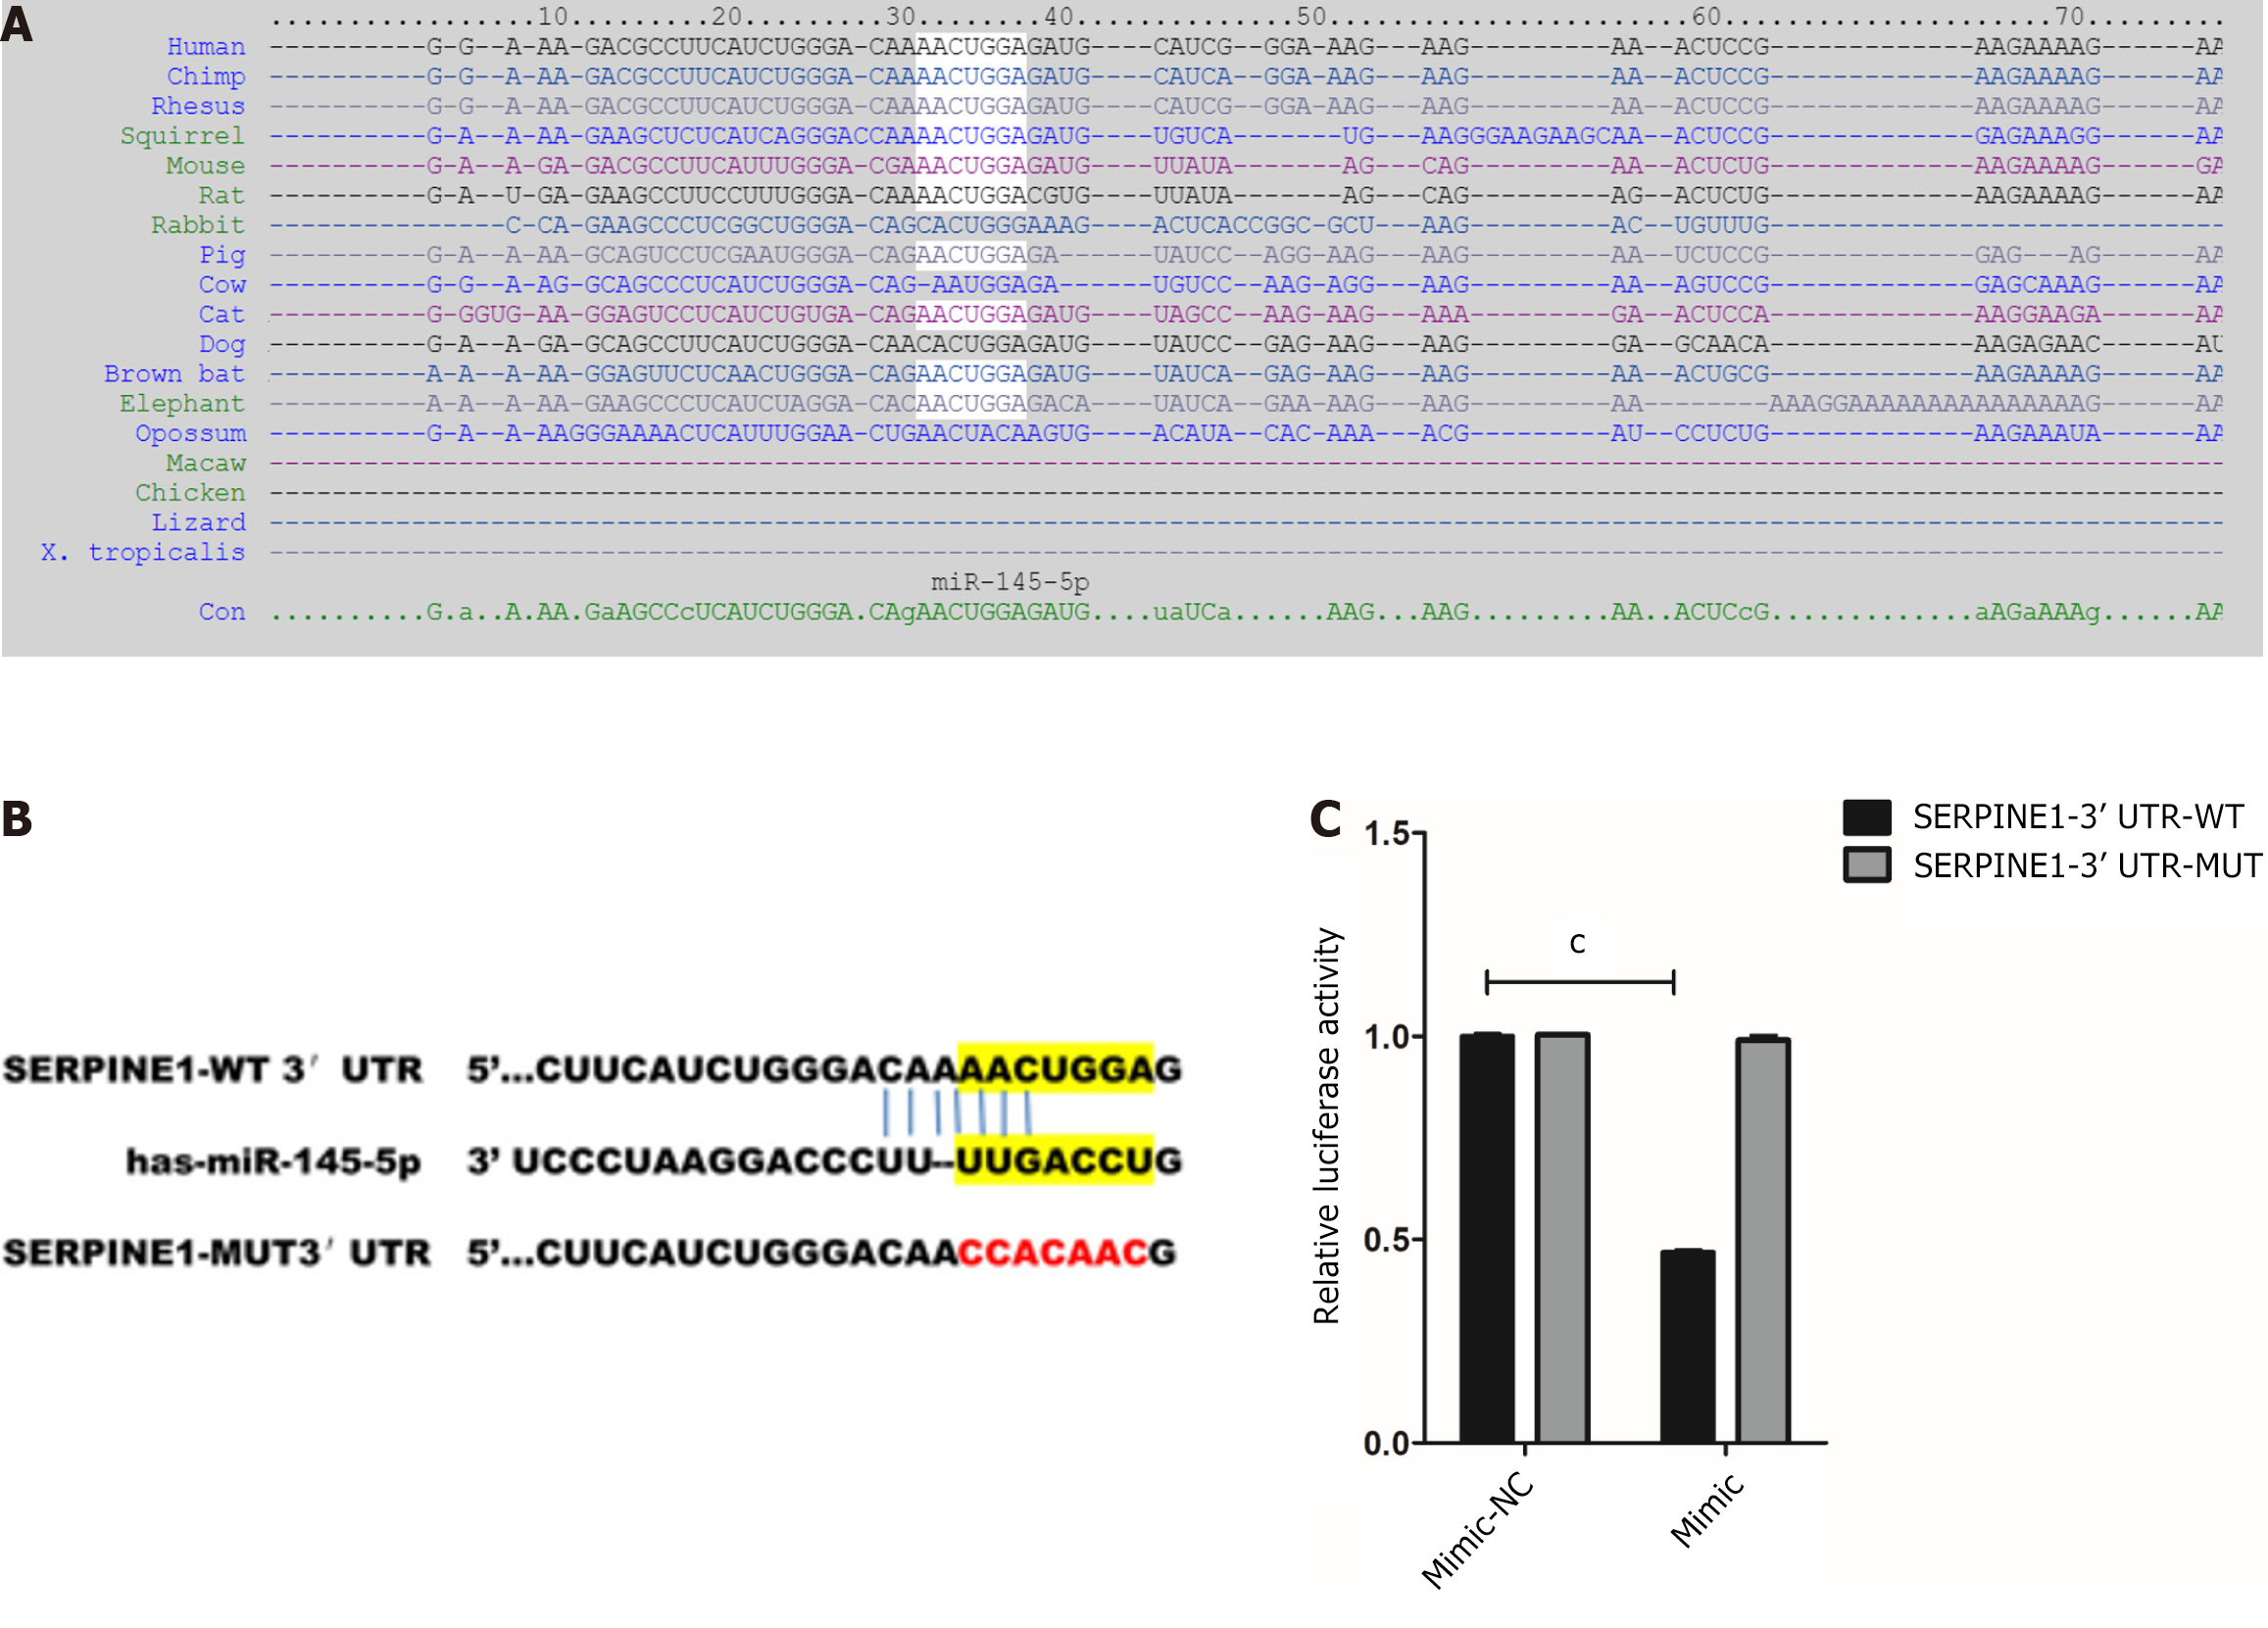
Figure 4 Serpin family E member 1 is a target of microRNA-145-5p.
A: miRNA-145-5p and serpin family E member 1 (SERPINE1) 3'- UTR binding sites were predicted using TargetScan; B: WT-SERPINE1 and MUT-SERPINE1 sequences; C: Relative luciferase activity of 293T cells transfected with either WT-SERPINE1 or MUT-SERPINE1. cP < 0.001.
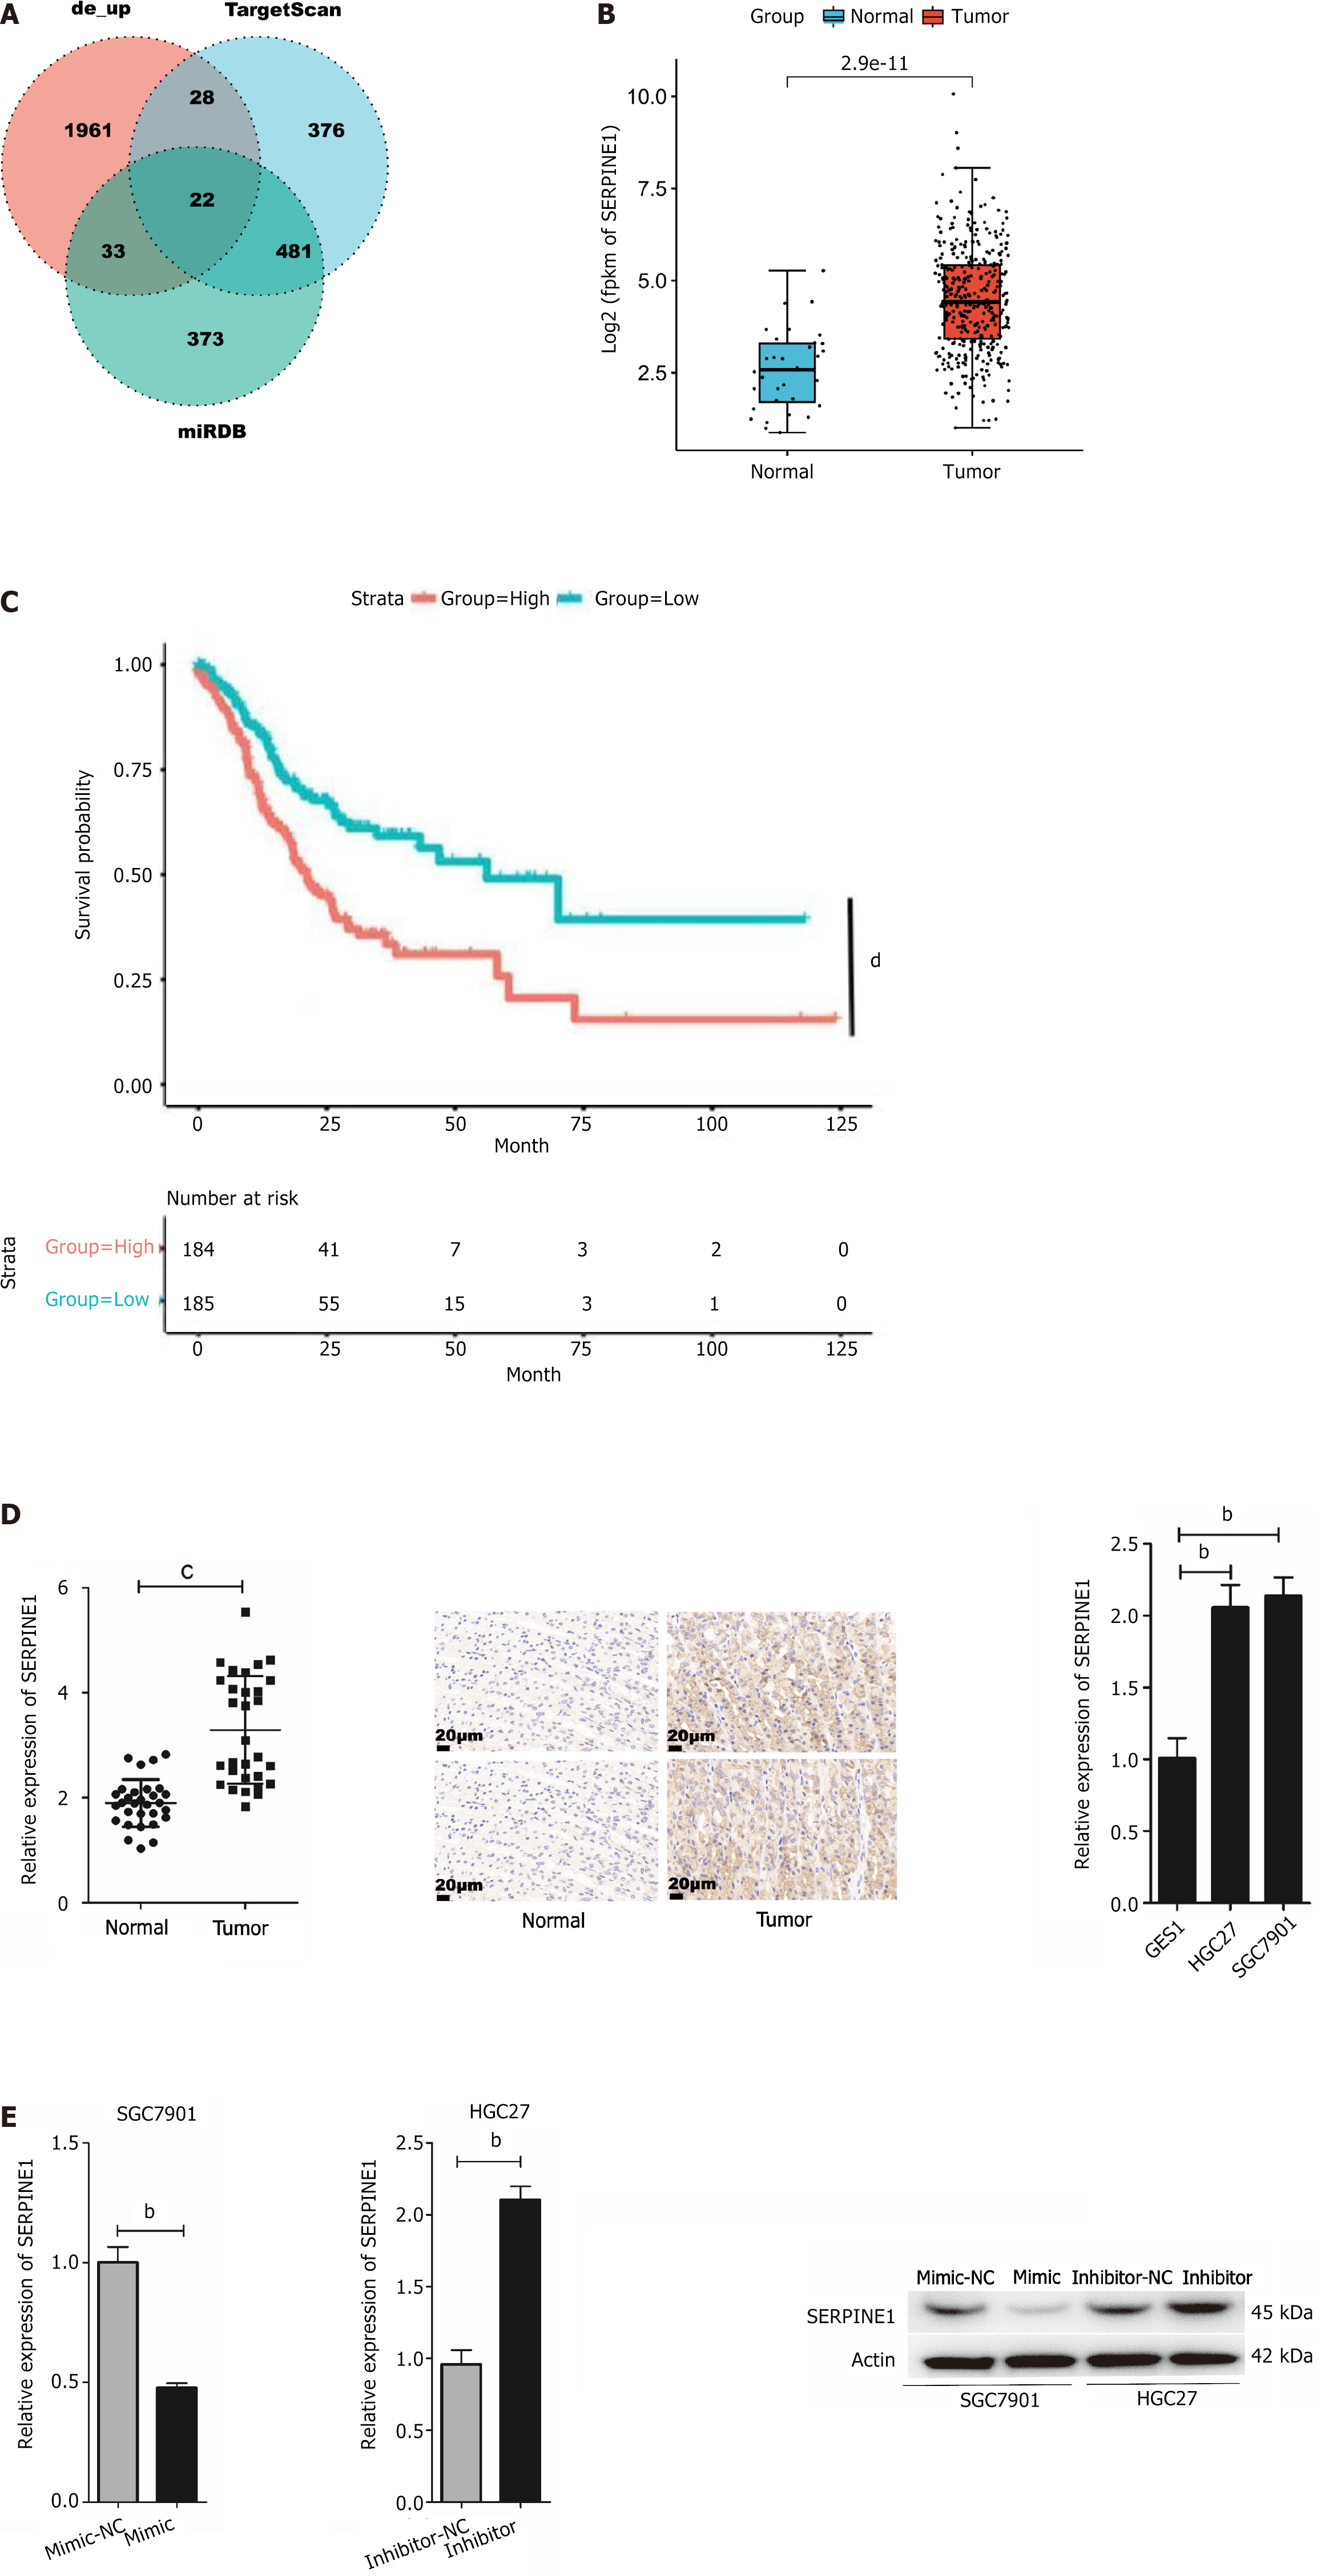
Figure 5 Serpin family E member 1 is a potential target gene of microRNA-145-5p and is highly expressed in gastric cancer tissues and cells.
A: A Venn diagram of overlapping mRNAs from the differentially expressed mRNAs in The Cancer Genome Atlas (TCGA)-STAD data and miRNA-145-5p (miR-145-5p) target genes predicted from the two bioinformatics databases; B: Box diagram showing the differential expression of serpin family E member 1 (SERPINE1) in the normal and tumor data in TCGA-STAD; C: Overall survival curves of patients in the high (red) and low (blue) SERPINE1 expression groups; D: Differential expression of SERPINE1 mRNA (left panel) and protein (middle panel) in gastric cancer (GC) tissue and SERPINE1 mRNA (right panel) in the HGC27 and SGC7901 GC cell lines; scale bar = 20 μm; E: SERPINE1 mRNA and protein expression in the miR-145-5p mimic group in SGC7901 cells and the inhibitor group in HGC27 cells. bP < 0.01; cP < 0.001; dP < 0.0001.
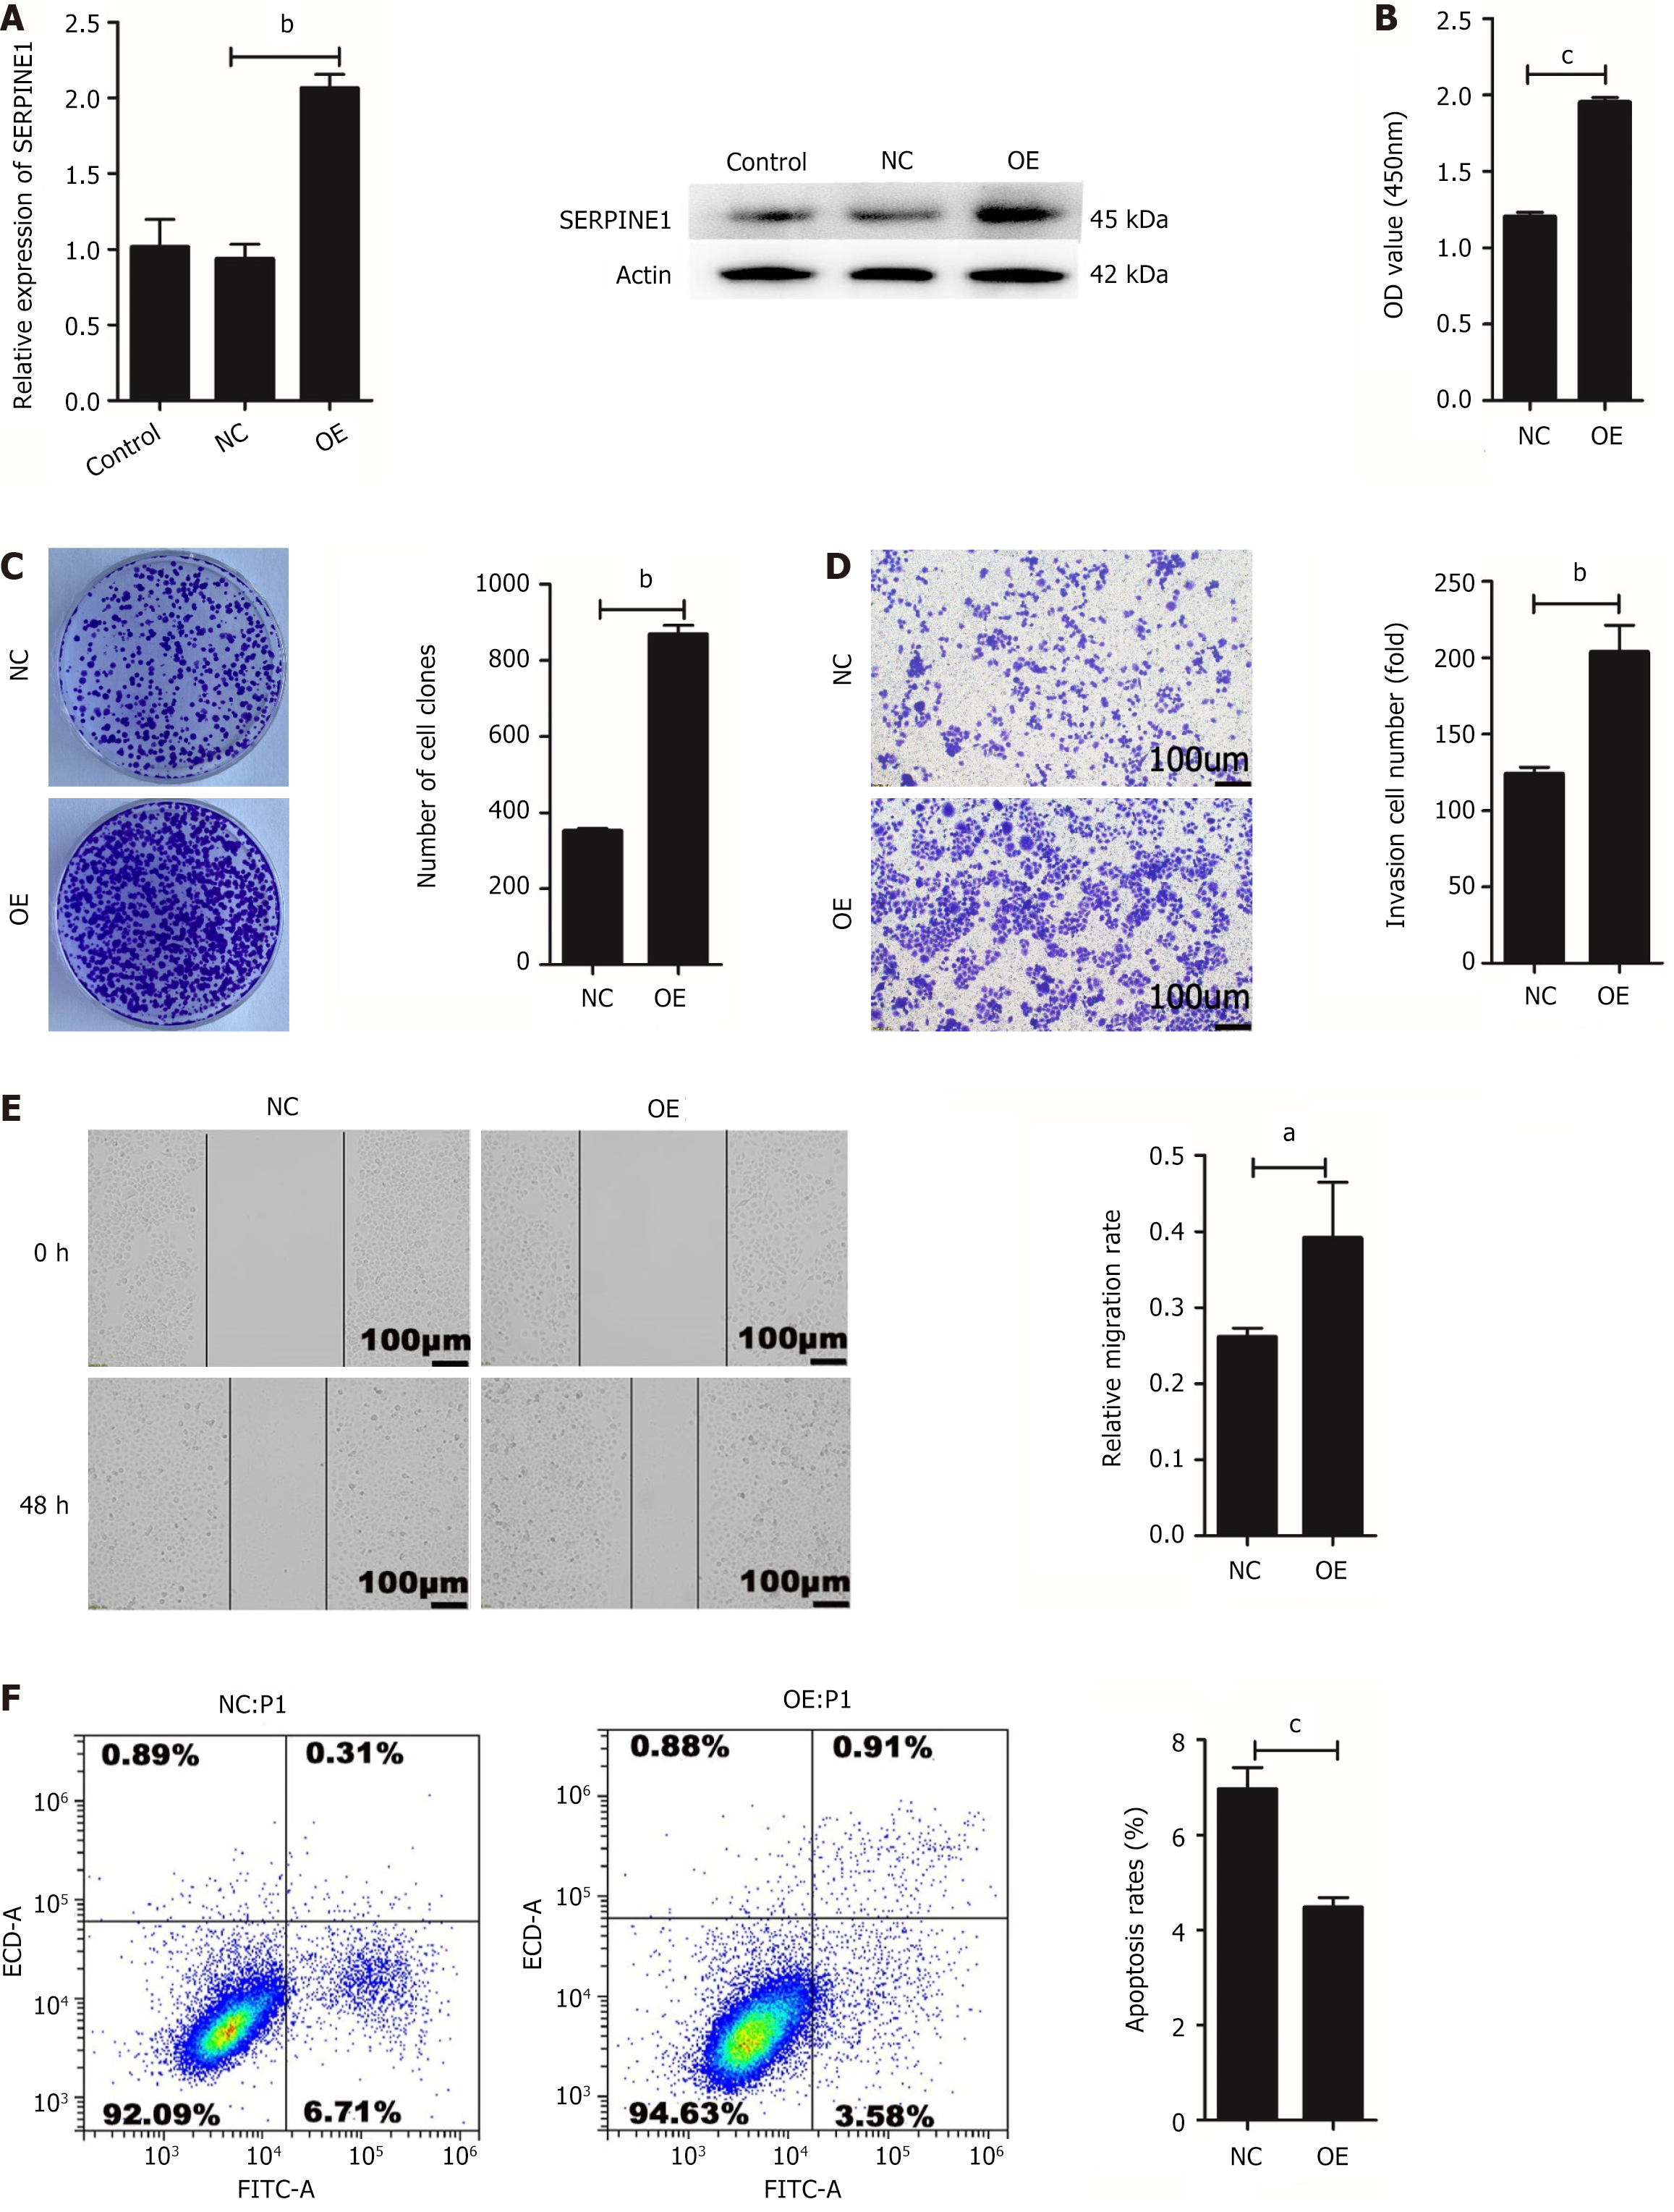
Figure 6 Effects of serpin family E member 1 overexpression on gastric cancer cell proliferation, invasion, migration, and apoptosis.
A: Serpin family E member 1 (SERPINE1) mRNA and protein expression in lentivirus transfected SGC7901 cells; B: SERPINE1 overexpression promotes SGC7901 cell proliferation; C: SERPINE1 overexpression promotes SGC7901 cell colony formation; D: SERPINE1 promotes SGC7901 cell invasion; scale bar = 100 μm; E: SERPINE1 promotes SGC7901 cell migration; scale bar = 100 μm; F: SERPINE1 overexpression reduces SGC7901 cell apoposis. aP < 0.05; bP < 0.01; cP < 0.001.
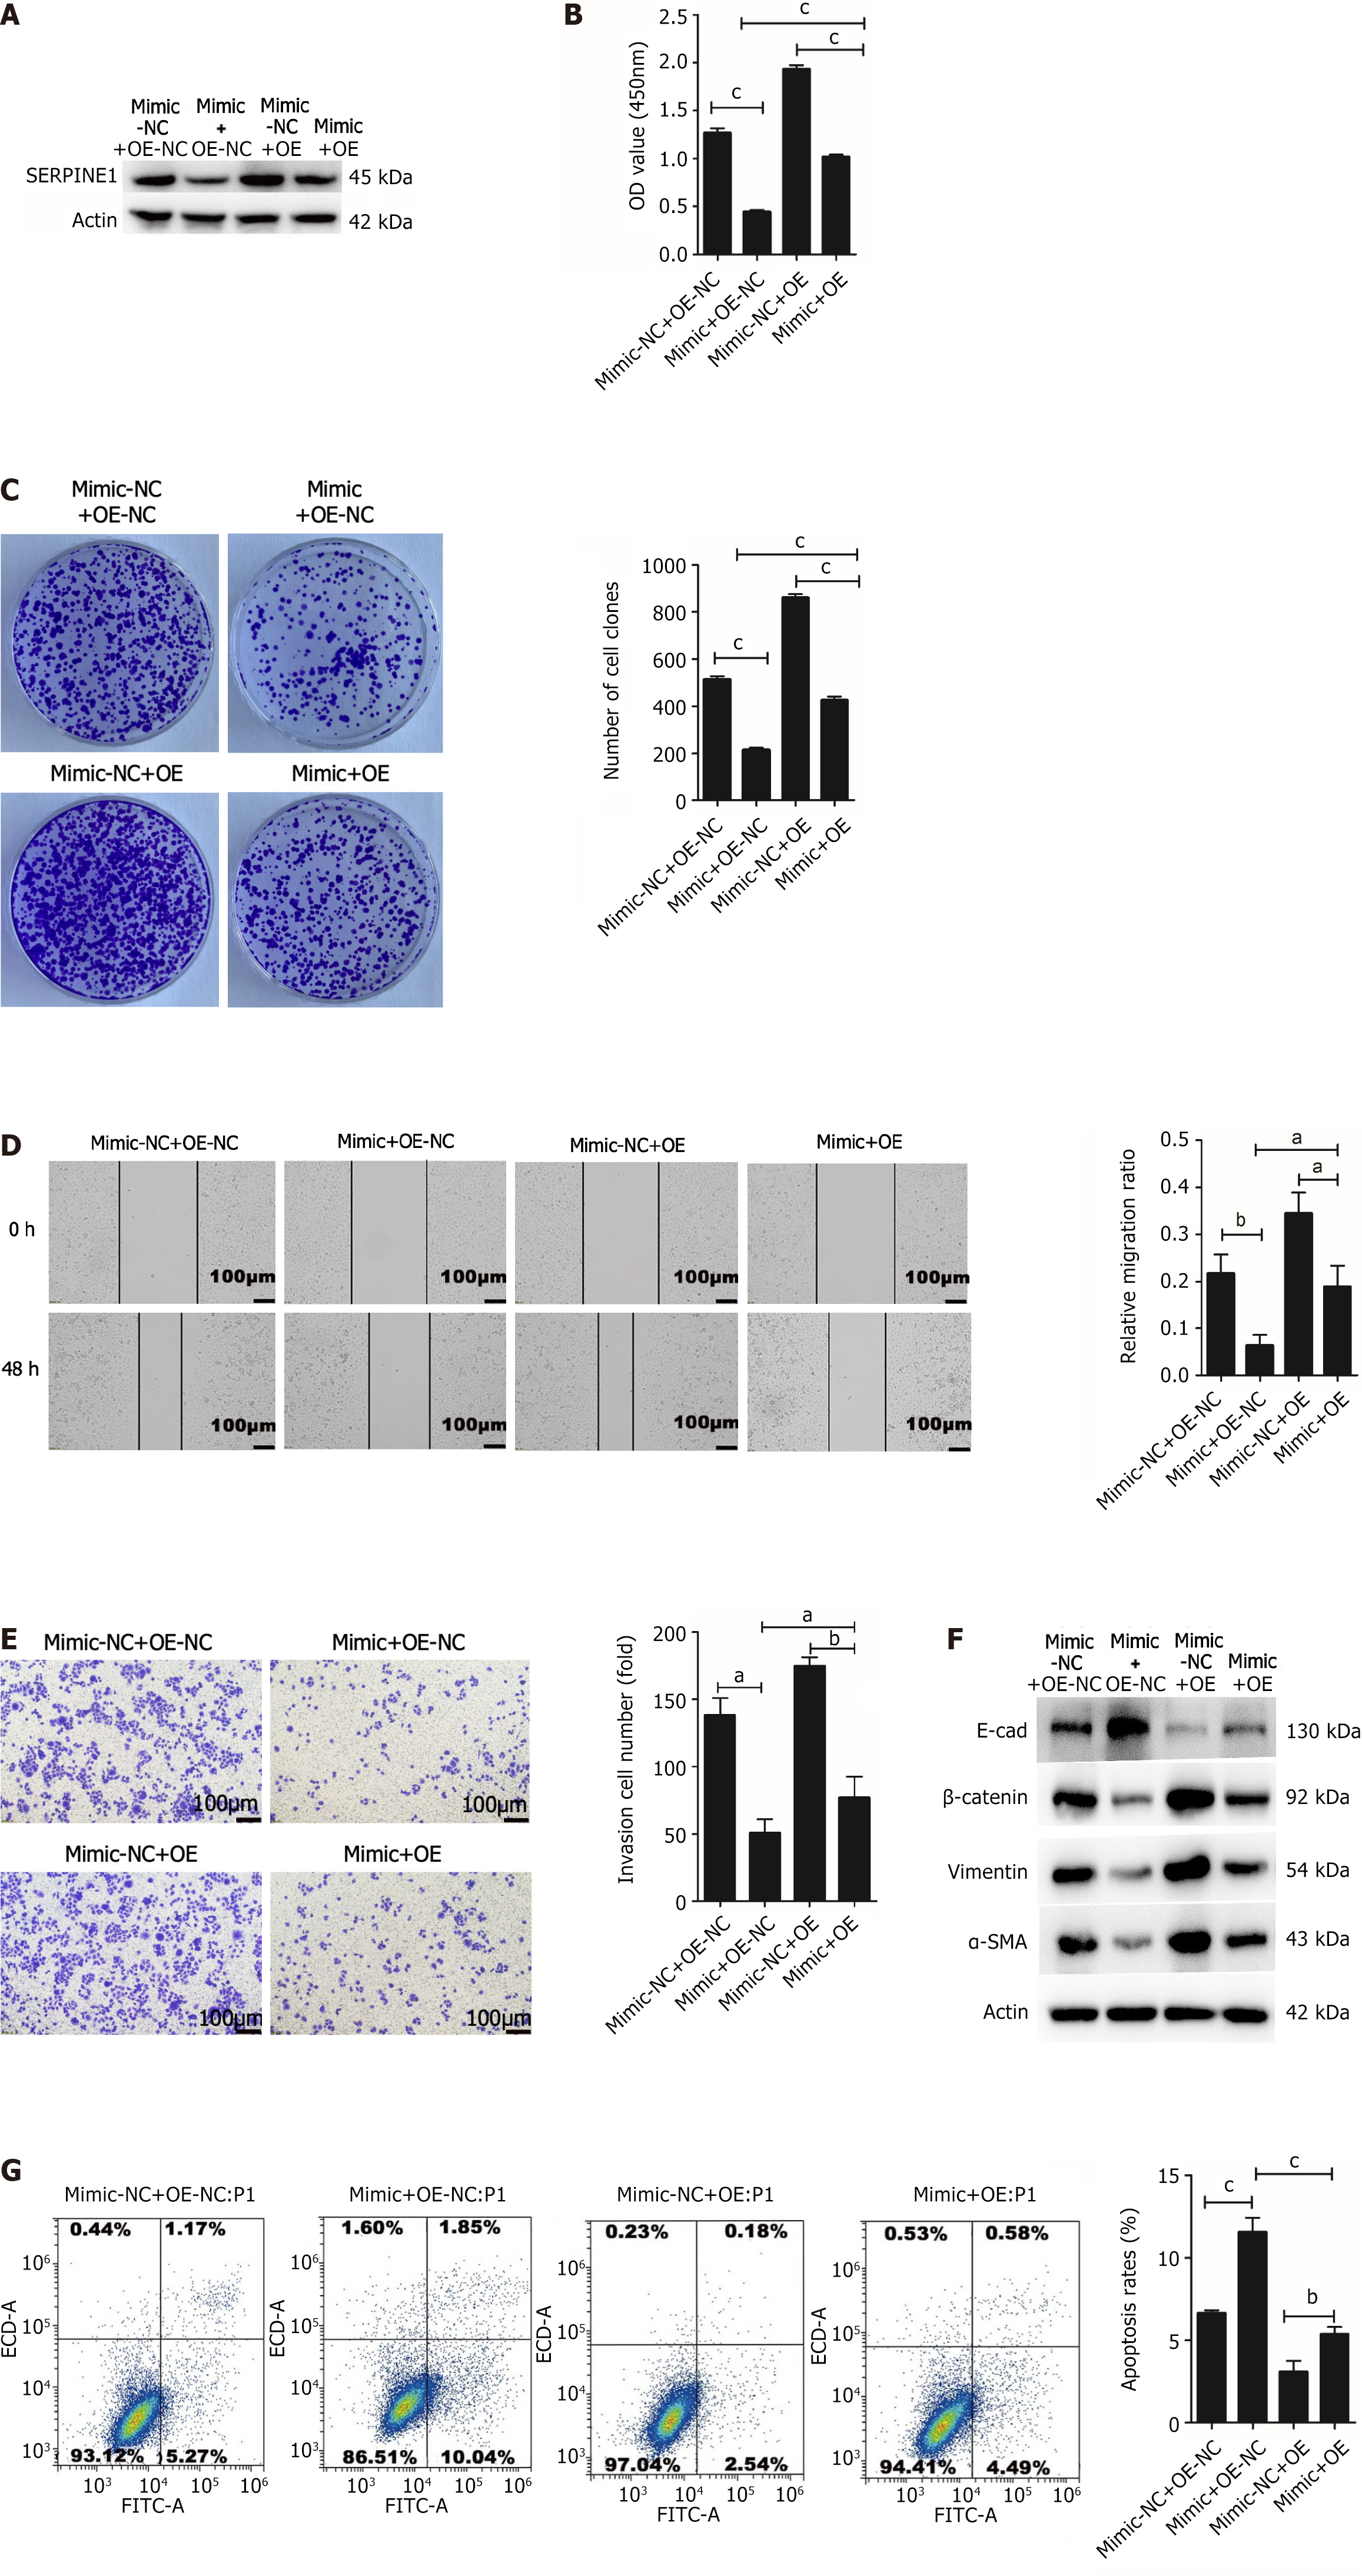
Figure 7 Serpin family E member 1 reverses microRNA-145-5p-mediated gastric cancer cell proliferation, invasion, metastasis, epithelial-mesenchymal transition, and apoptosis.
A: Serpin family E member 1 protein expression in co-transfected cells; B: Co-transfected cell proliferation; C: Co-transfected cell colony formation; D: Co-transfected cell migration; scale bar = 100 μm; E: Co-transfected cell invasion; scale bar = 100 μm; F: Epithelial-mesenchymal transition-related marker protein (E-cadherin, β-catenin, Vimentin, and α-smooth muscle actin) expression in co-transfected cells; G: Apoptosis of co-transfected cells. aP < 0.05; bP < 0.01; cP < 0.001.
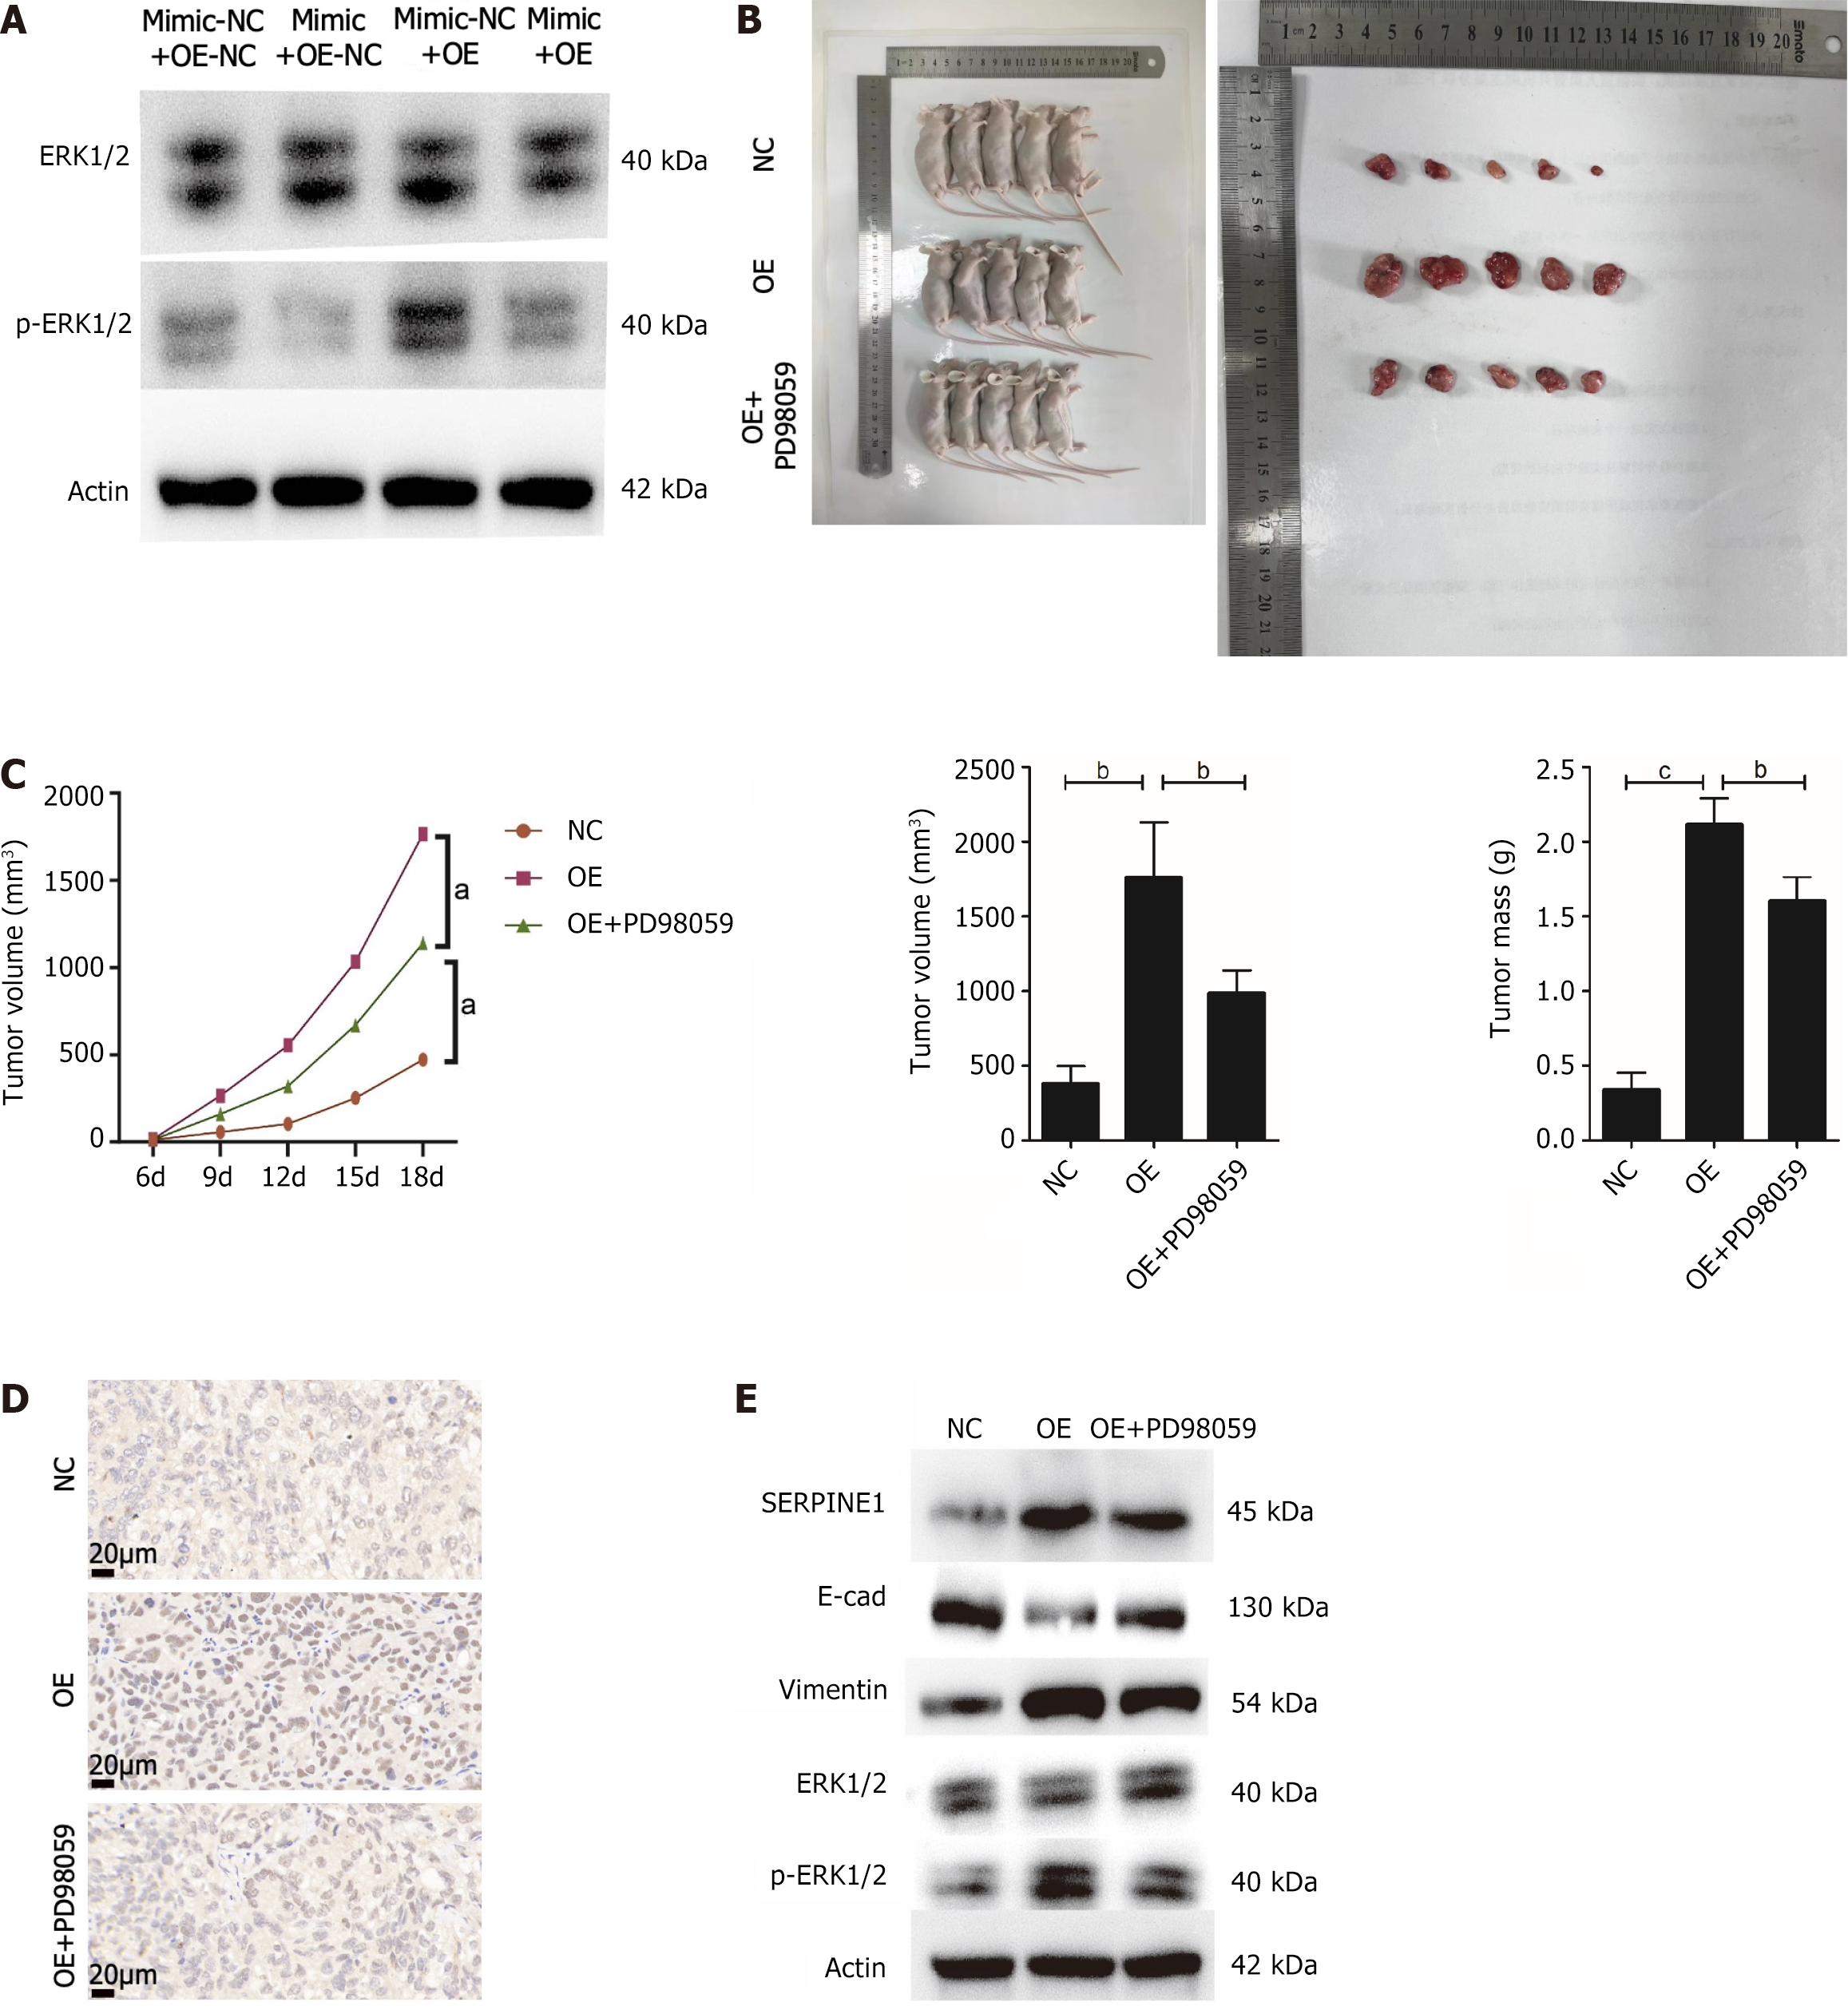
Figure 8 Effect of serpin family E member 1 overexpression on gastric cancer cell proliferation and the signal-regulated kinase-1/2 pathway invitro and invivo.
A: Expression of signal-regulated kinase-1/2 (ERK1/2) and p-ERK1/2 in SGC7901 co-transfected cells; B: Image of xenograft tumors at day 18 post-inoculation; C: Xenograft tumor growth, volume, and mass at day-18 post-inoculation. n = 5 mice per group; D: Ki67 expression in xenograft tumor tissue; Scale bar = 20 μm; E: E-cadherin, vimentin, serpin family E member 1, ERK1/2, and p-ERK1/2 expression in xenograft tumor tissues. aP < 0.05; bP < 0.01; cP < 0.001. SERPINE1: Serpin family E member 1; ERK1/2: Signal-regulated kinase-1/2.
- Citation: Bai HX, Qiu XM, Xu CH, Guo JQ. MiRNA-145-5p inhibits gastric cancer progression via the serpin family E member 1- extracellular signal-regulated kinase-1/2 axis. World J Gastrointest Oncol 2024; 16(5): 2123-2140
- URL: https://www.wjgnet.com/1948-5204/full/v16/i5/2123.htm
- DOI: https://dx.doi.org/10.4251/wjgo.v16.i5.2123


