Copyright
©The Author(s) 2024.
World J Gastrointest Oncol. May 15, 2024; 16(5): 2091-2112
Published online May 15, 2024. doi: 10.4251/wjgo.v16.i5.2091
Published online May 15, 2024. doi: 10.4251/wjgo.v16.i5.2091
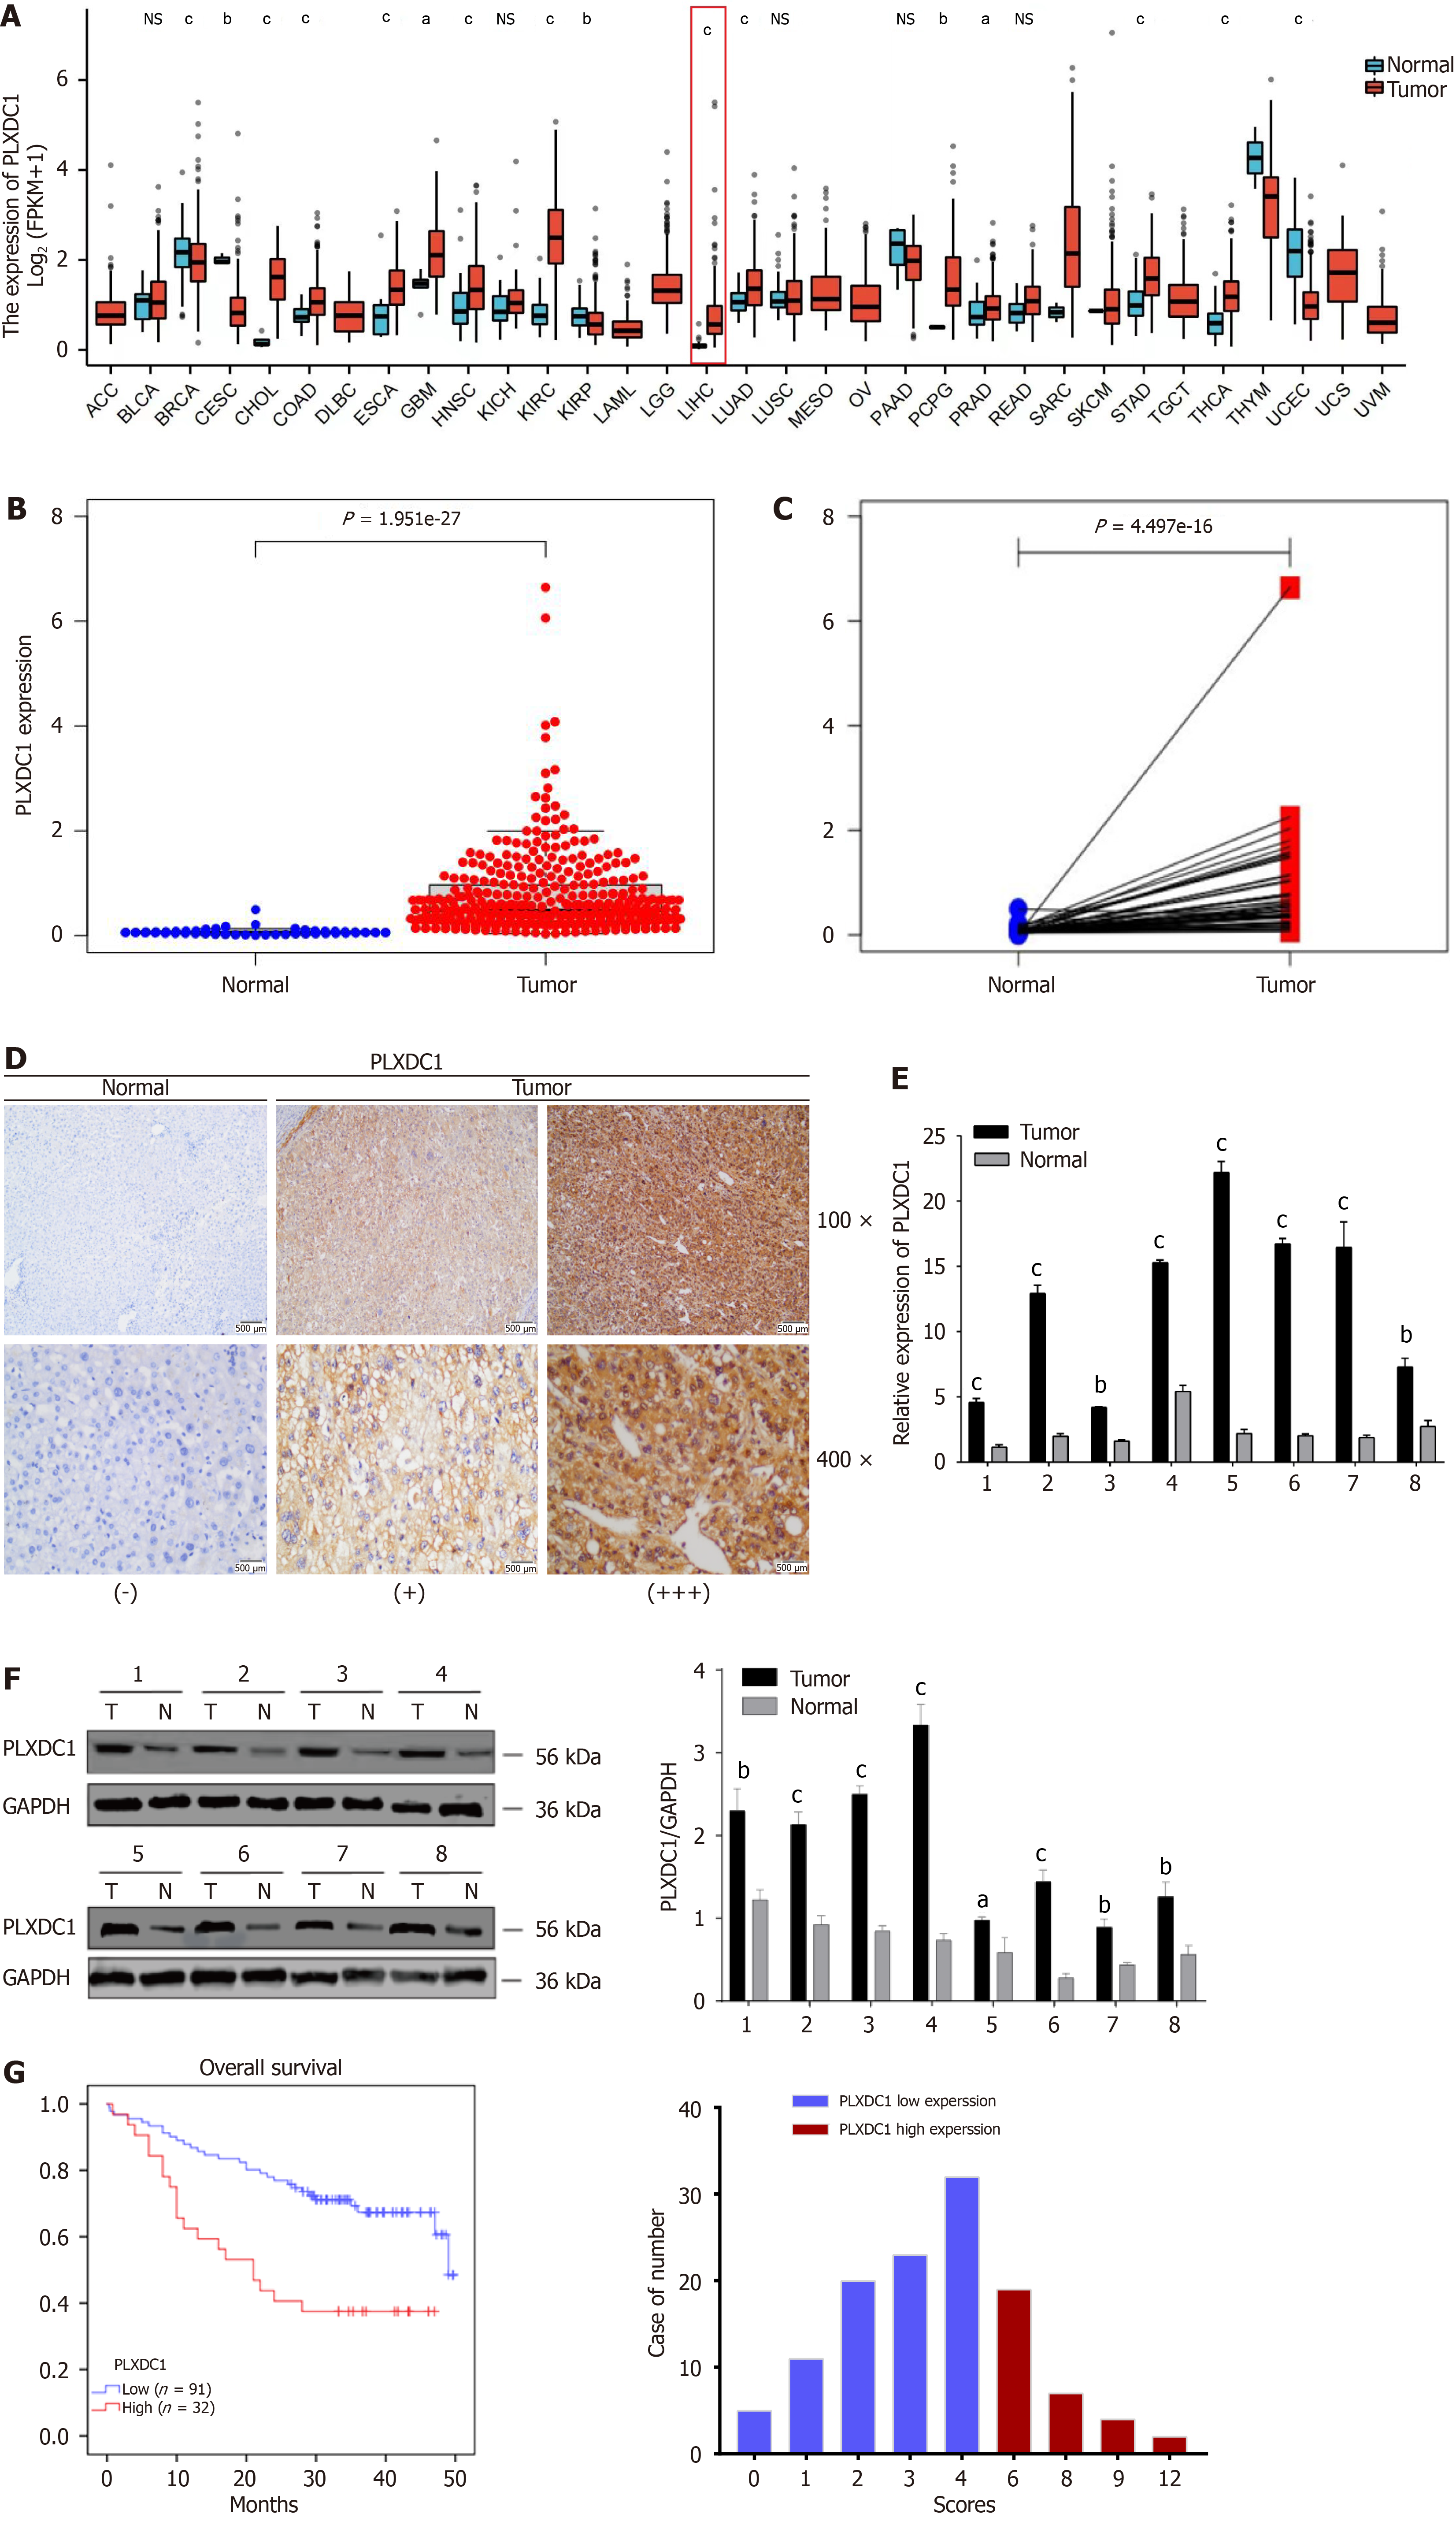
Figure 1 Expression levels of plexin domain-containing 1 in tumors.
A: Differences in plexin domain-containing 1 (PLXDC1) expression in tumor and normal tissues in the The Cancer Genome Atlas (TCGA) pancancer dataset; PLXDC1 expression was significantly higher in hepatocellular carcinoma (HCC) cancer tissues than in paracancerous tissues; B and C: Unpaired and paired difference analysis of HCC in the TCGA database; PLXDC1 expression was significantly higher in HCC tissues than in normal tissues; D: Immunohistochemical staining analysis of 123 pairs of paraffin-embedded HCC samples showed higher PLXDC1 expression in HCC than in adjacent normal tissues; E: Quantitative real-time polymerase chain reaction assay of PLXDC1 gene expression in 8 pairs of HCC tissues as well as corresponding normal tissues showed higher PLXDC1 expression in HCC tissues than in normal tissues; F: Western blot assay comparing PLXDC1 gene expression in 8 pairs of HCC tissues and normal tissues with quantification data; PLXDC1 expression was higher in HCC tissues than in normal tissues; G: Kaplan-Meier analysis of the survival curves and scoring statistics of 123 HCC patients stratified by PLXDC1 expression; patients with high PLXDC1 expression had a lower survival rate than those with low expression. aP < 0.05; bP < 0.01; cP < 0.001; NS: Not significant. PLXDC1: Plexin domain-containing 1.
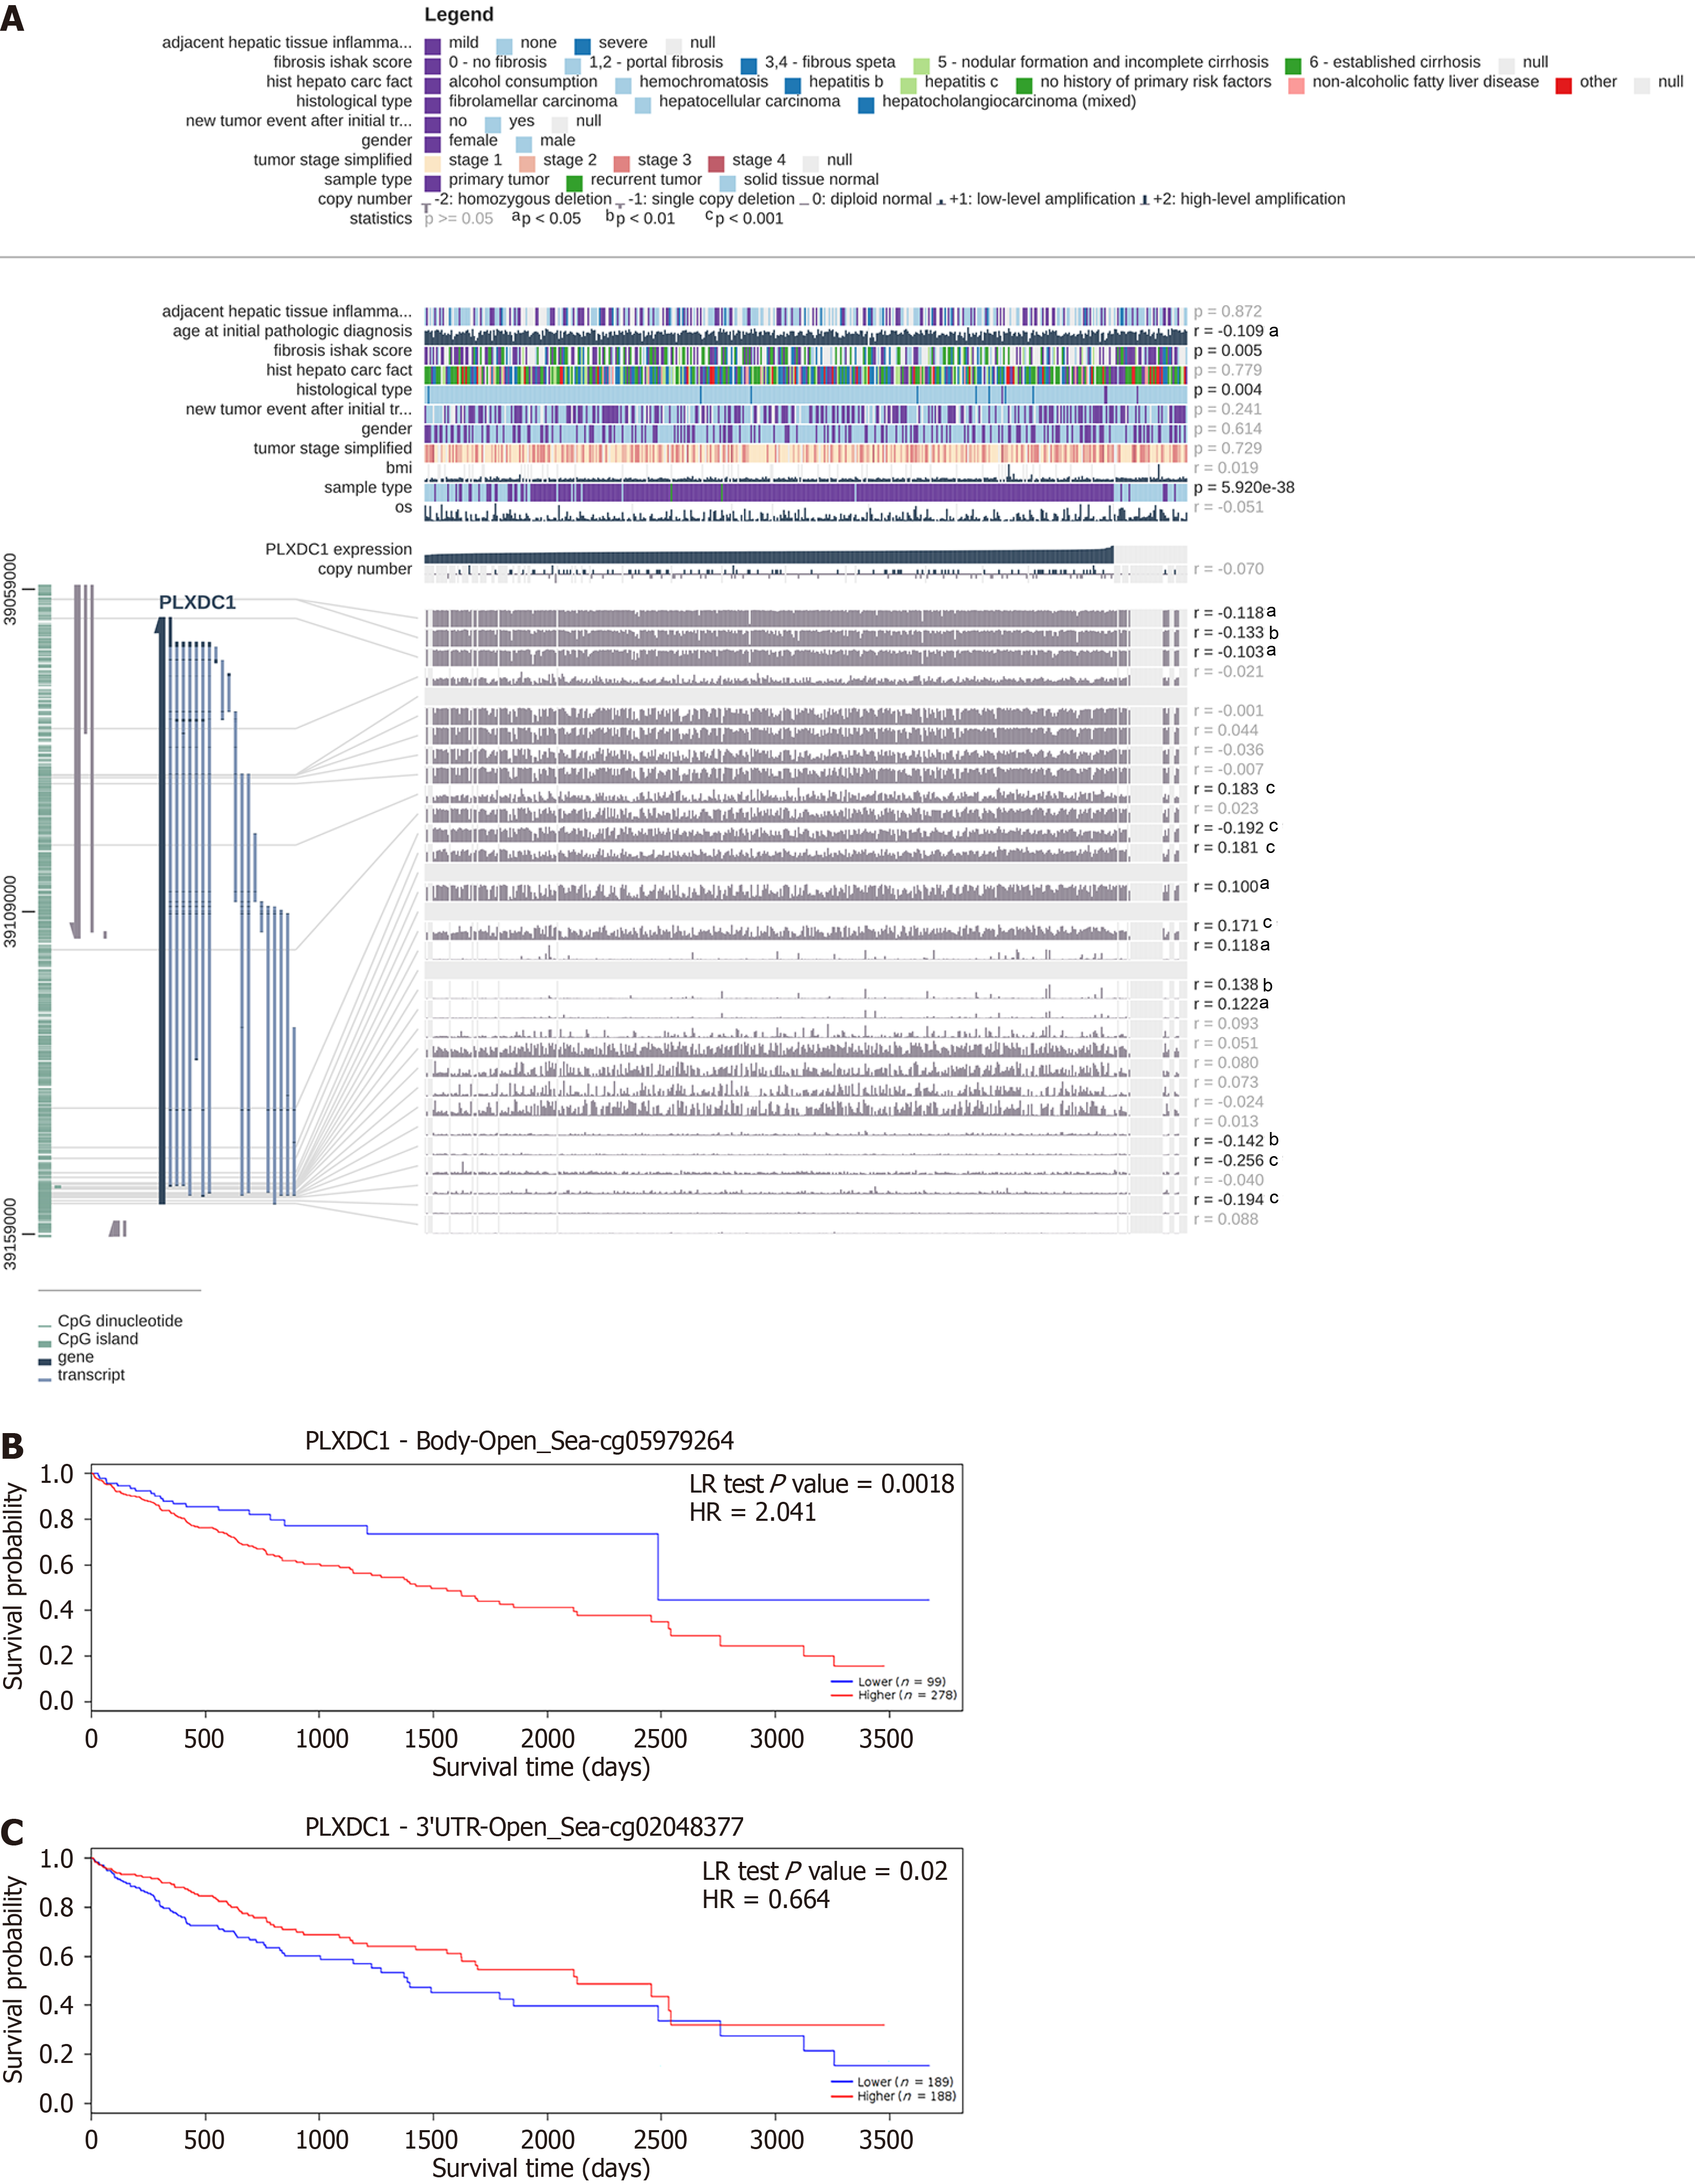
Figure 2 Correlation and prognostic value analysis of plexin domain-containing 1 gene methylation sites in hepatocellular carcinoma.
A: Methylation sites associated with plexin domain-containing 1 expression. r: Correlation; probe ID: Methylation site; aP < 0.05; bP < 0.01; cP < 0.001; B: Sites for which the methylation level was positively correlated with survival: The survival rate of the high-methylation group was significantly lower than that of the control group; C: Sites for which the methylation level was negatively correlated with survival: The survival rate of the high methylation group was significantly lower than that of the control group. PLXDC1: Plexin domain-containing 1.
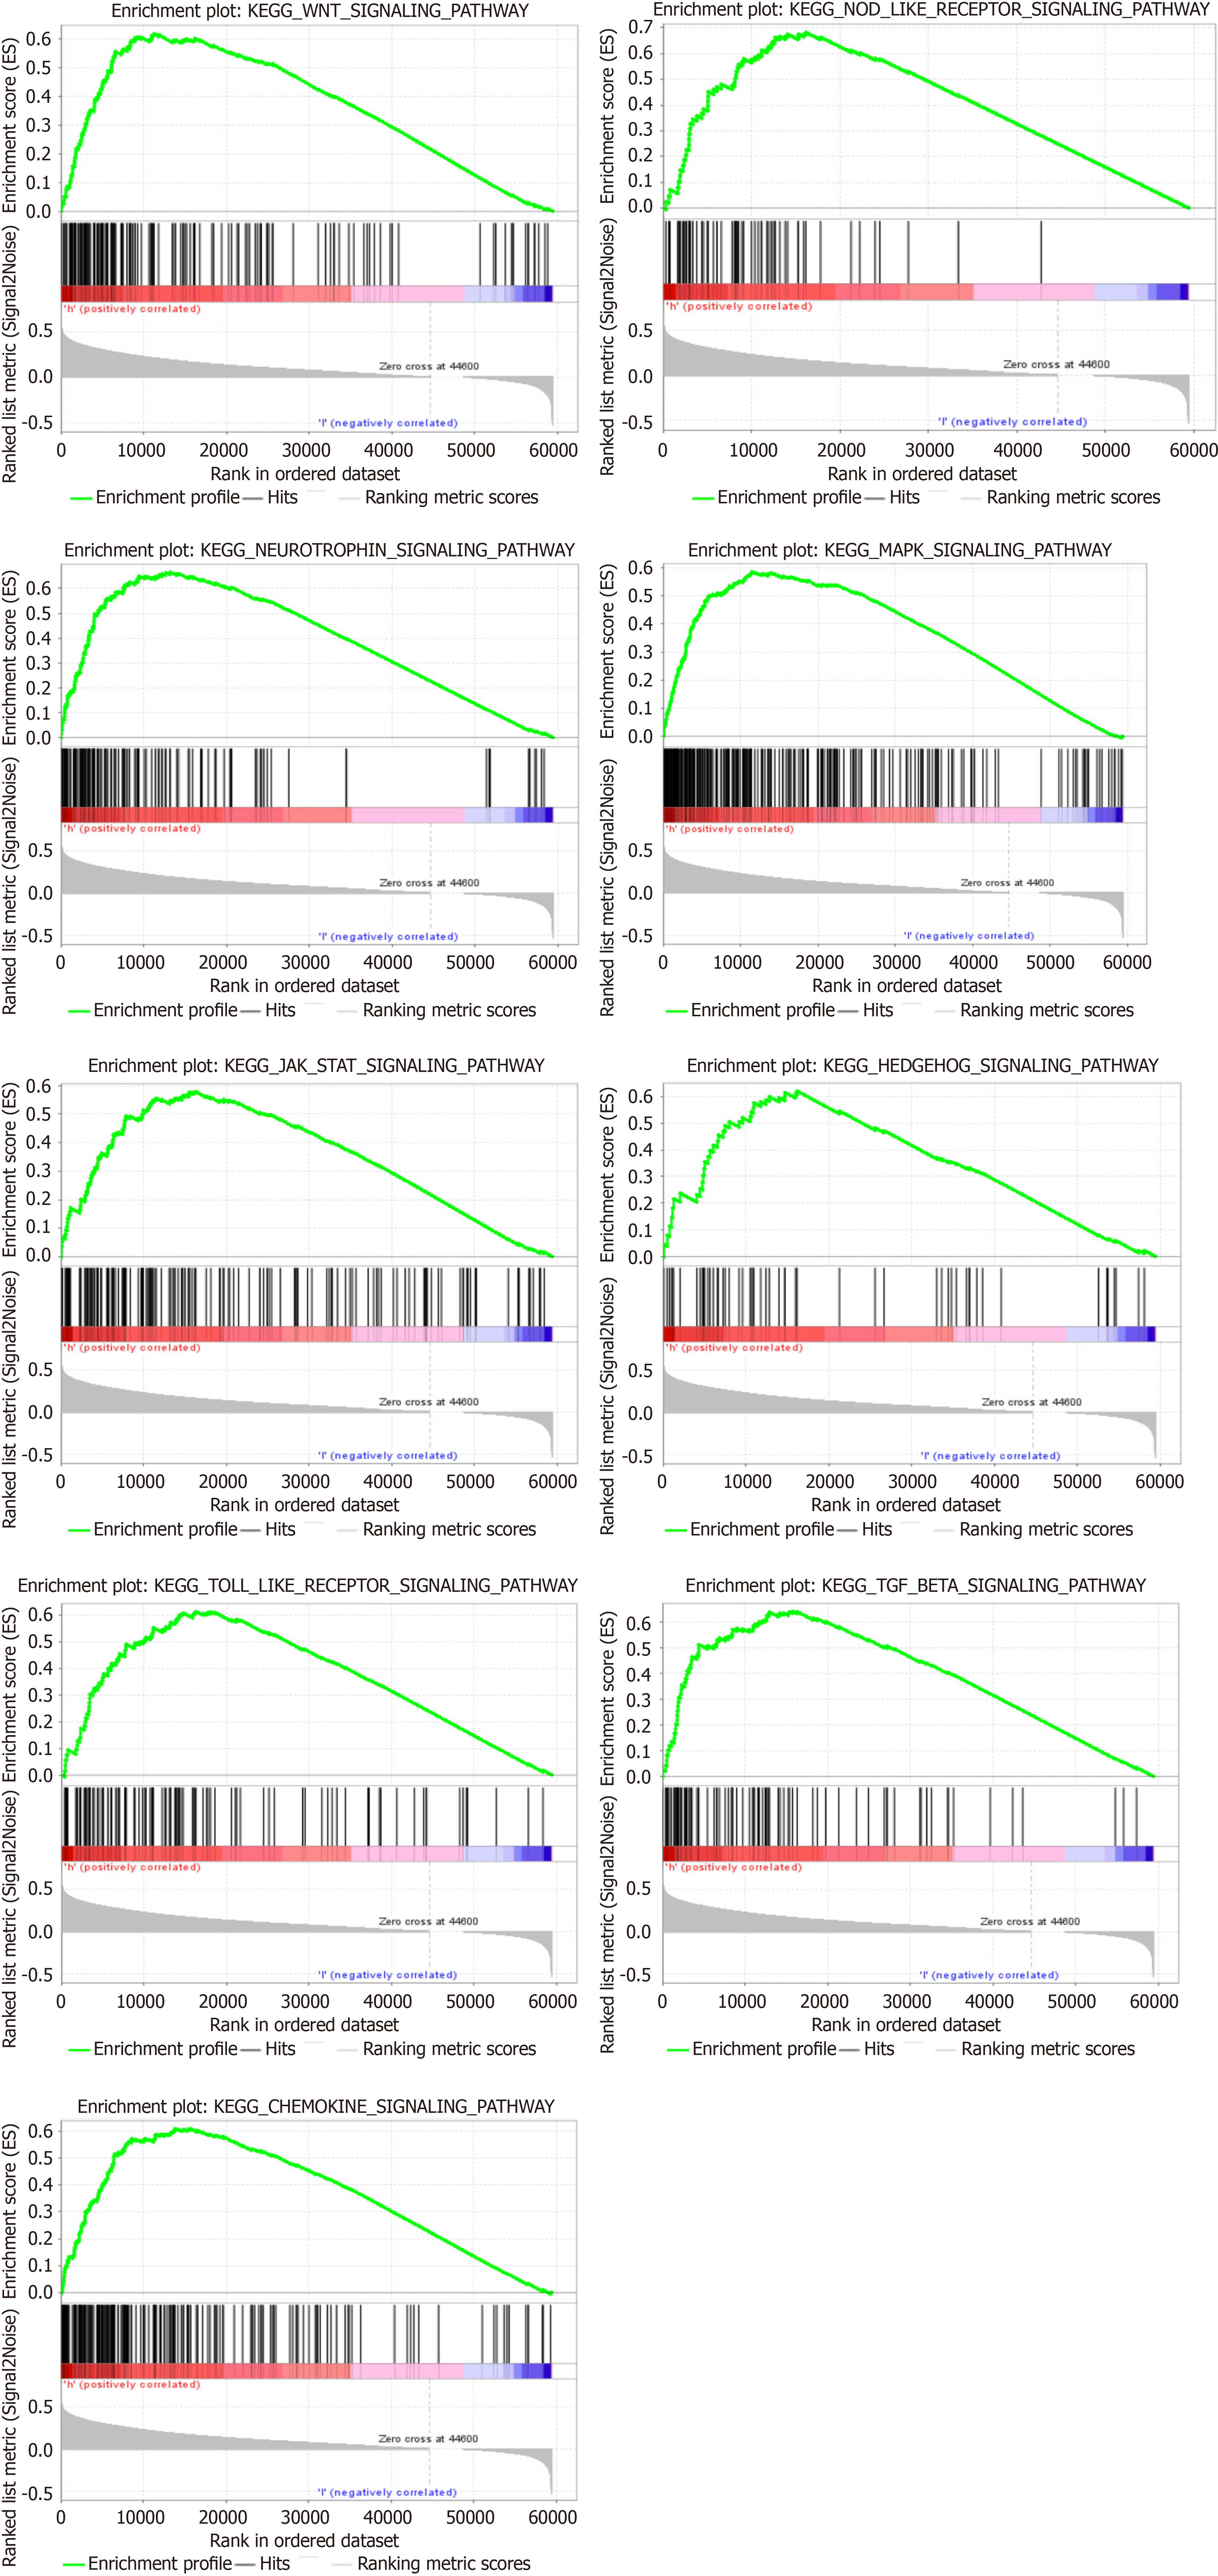
Figure 3 “GSVA” R package of the oncogenic pathways upregulated by plexin domain-containing 1 in hepatocellular carcinoma.
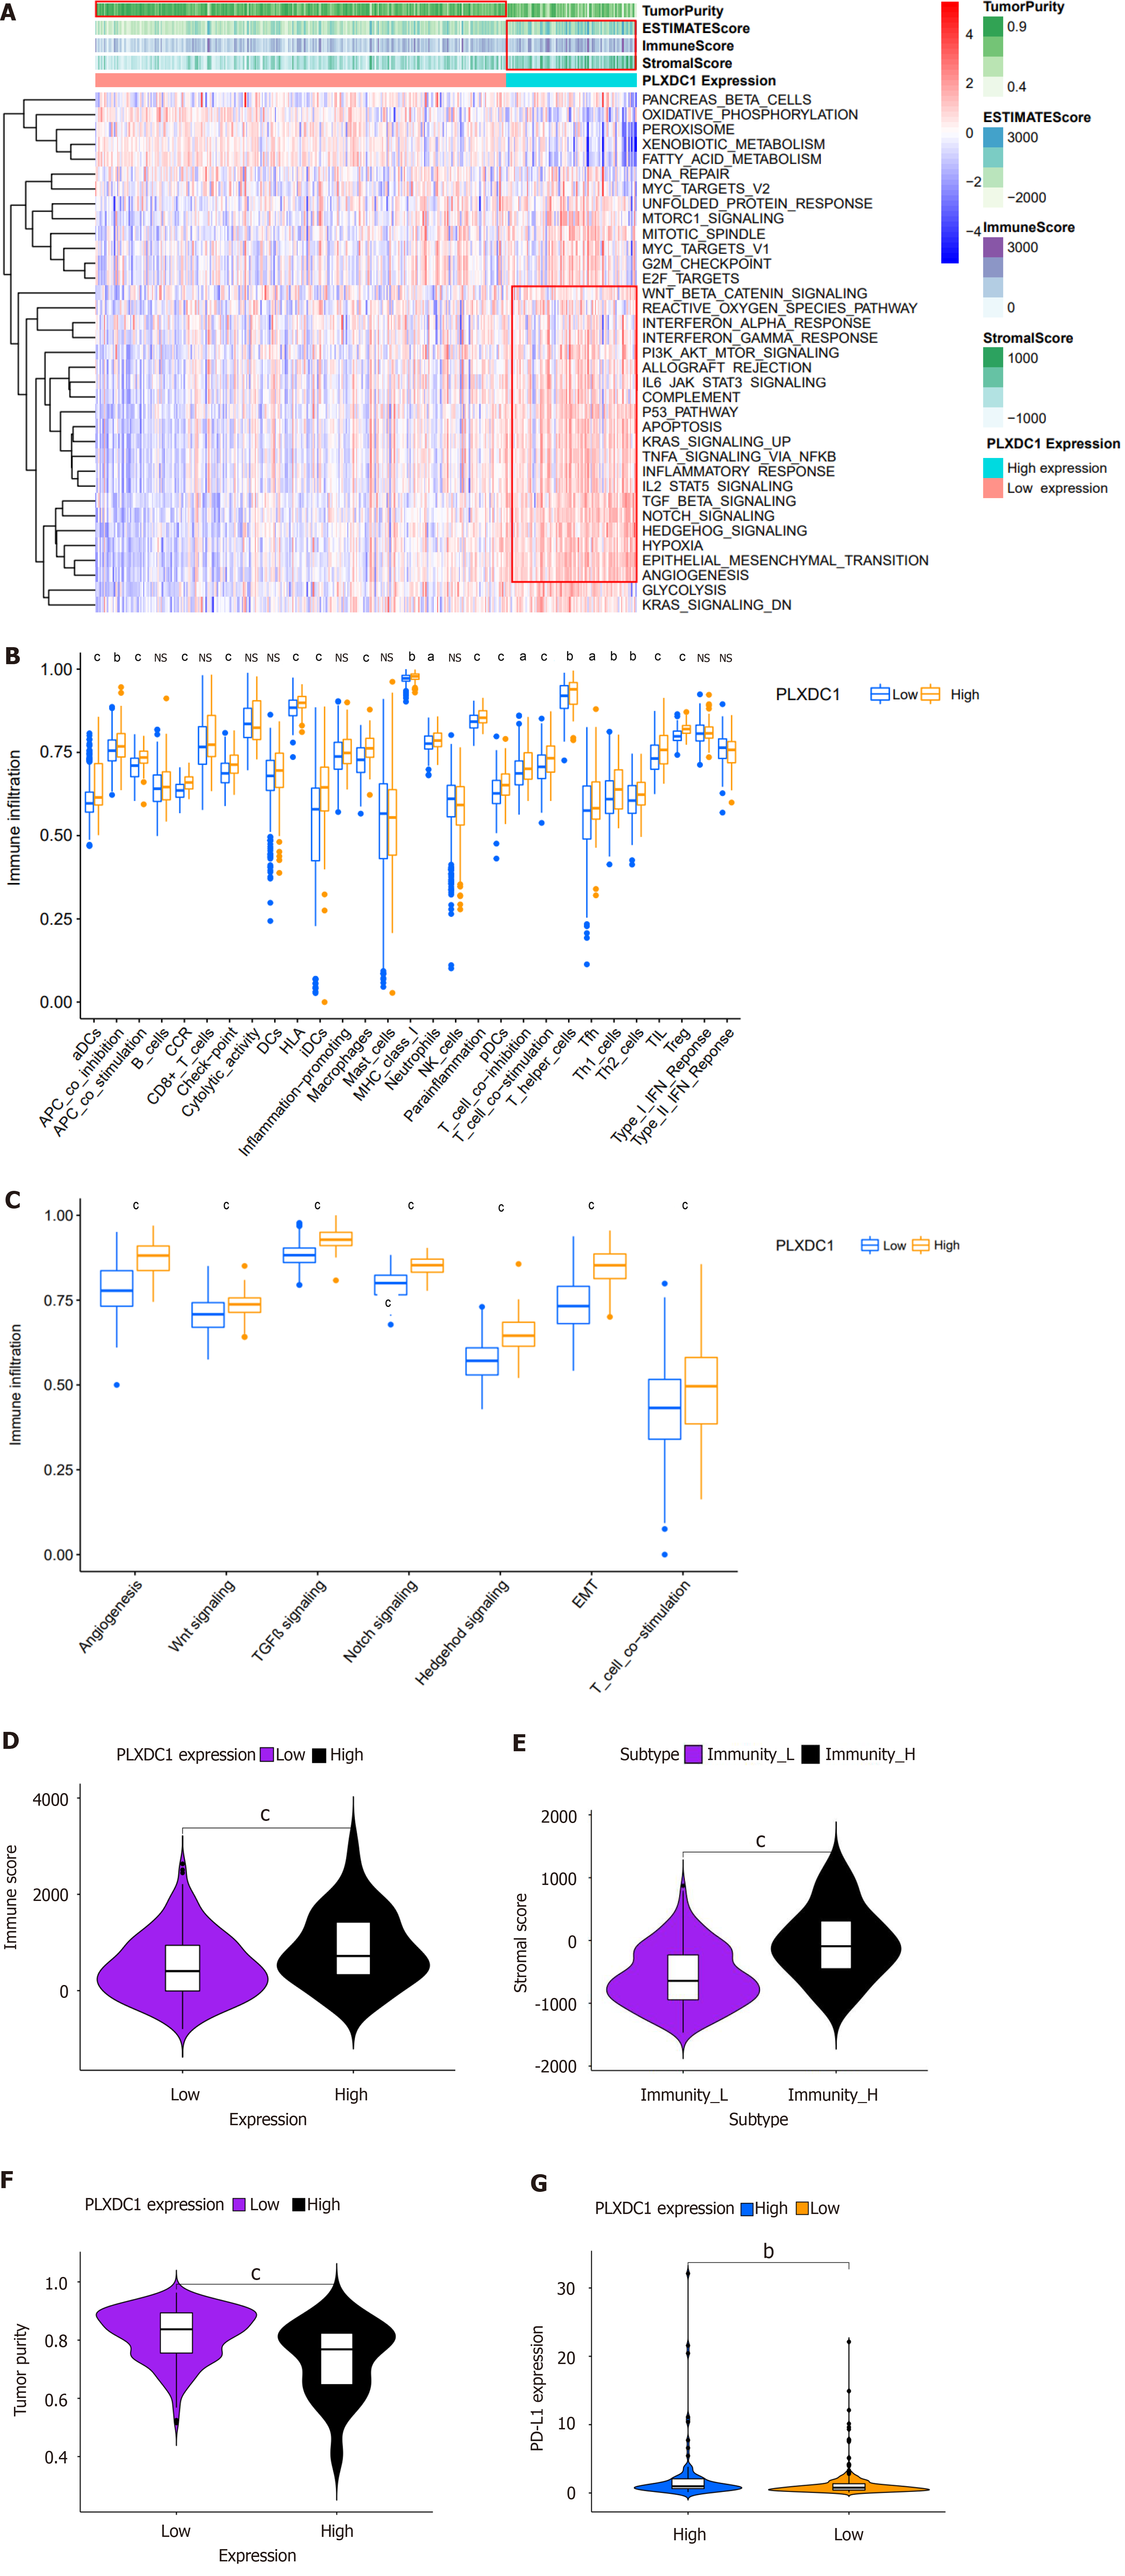
Figure 4 Analysis of the immune microenvironment of plexin domain-containing 1 in hepatocellular carcinoma.
A: Enrichment of differentially expressed genes between the high and low plexin domain-containing 1 (PLXDC1) expression groups in the hallmark pathway of hepatocellular carcinoma (HCC). The results showed that genes upregulated in PLXDC1-high vs PLXDC1-low samples in HCC mainly regulate immune activation and inflammatory response through IL6-JAK-STAT3 signaling, IL2-STAT5 signaling, and inflammatory response; B: Analysis of immune cell infiltration and functional enrichment between the PLXDC1-high and PLXDC1-low groups in HCC; C: Differentially expressed genes between the PLXDC1-high and PLXDC1-low groups showed enrichment of the stromal signaling pathway in HCC; D-G: ESTIMATE algorithm to assess immune cell score (D), stromal score (E), tumor purity score (F), and immunotherapy effect evaluation (G) in high and low PLXDC1 expression groups in HCC; immune cell score, tumor mesenchymal score, and PD-L1 expression were significantly higher than those in the low expression group, while the tumor purity score showed the opposite trend. aP < 0.05; bP < 0.01; cP < 0.001. PLXDC1: Plexin domain-containing 1.
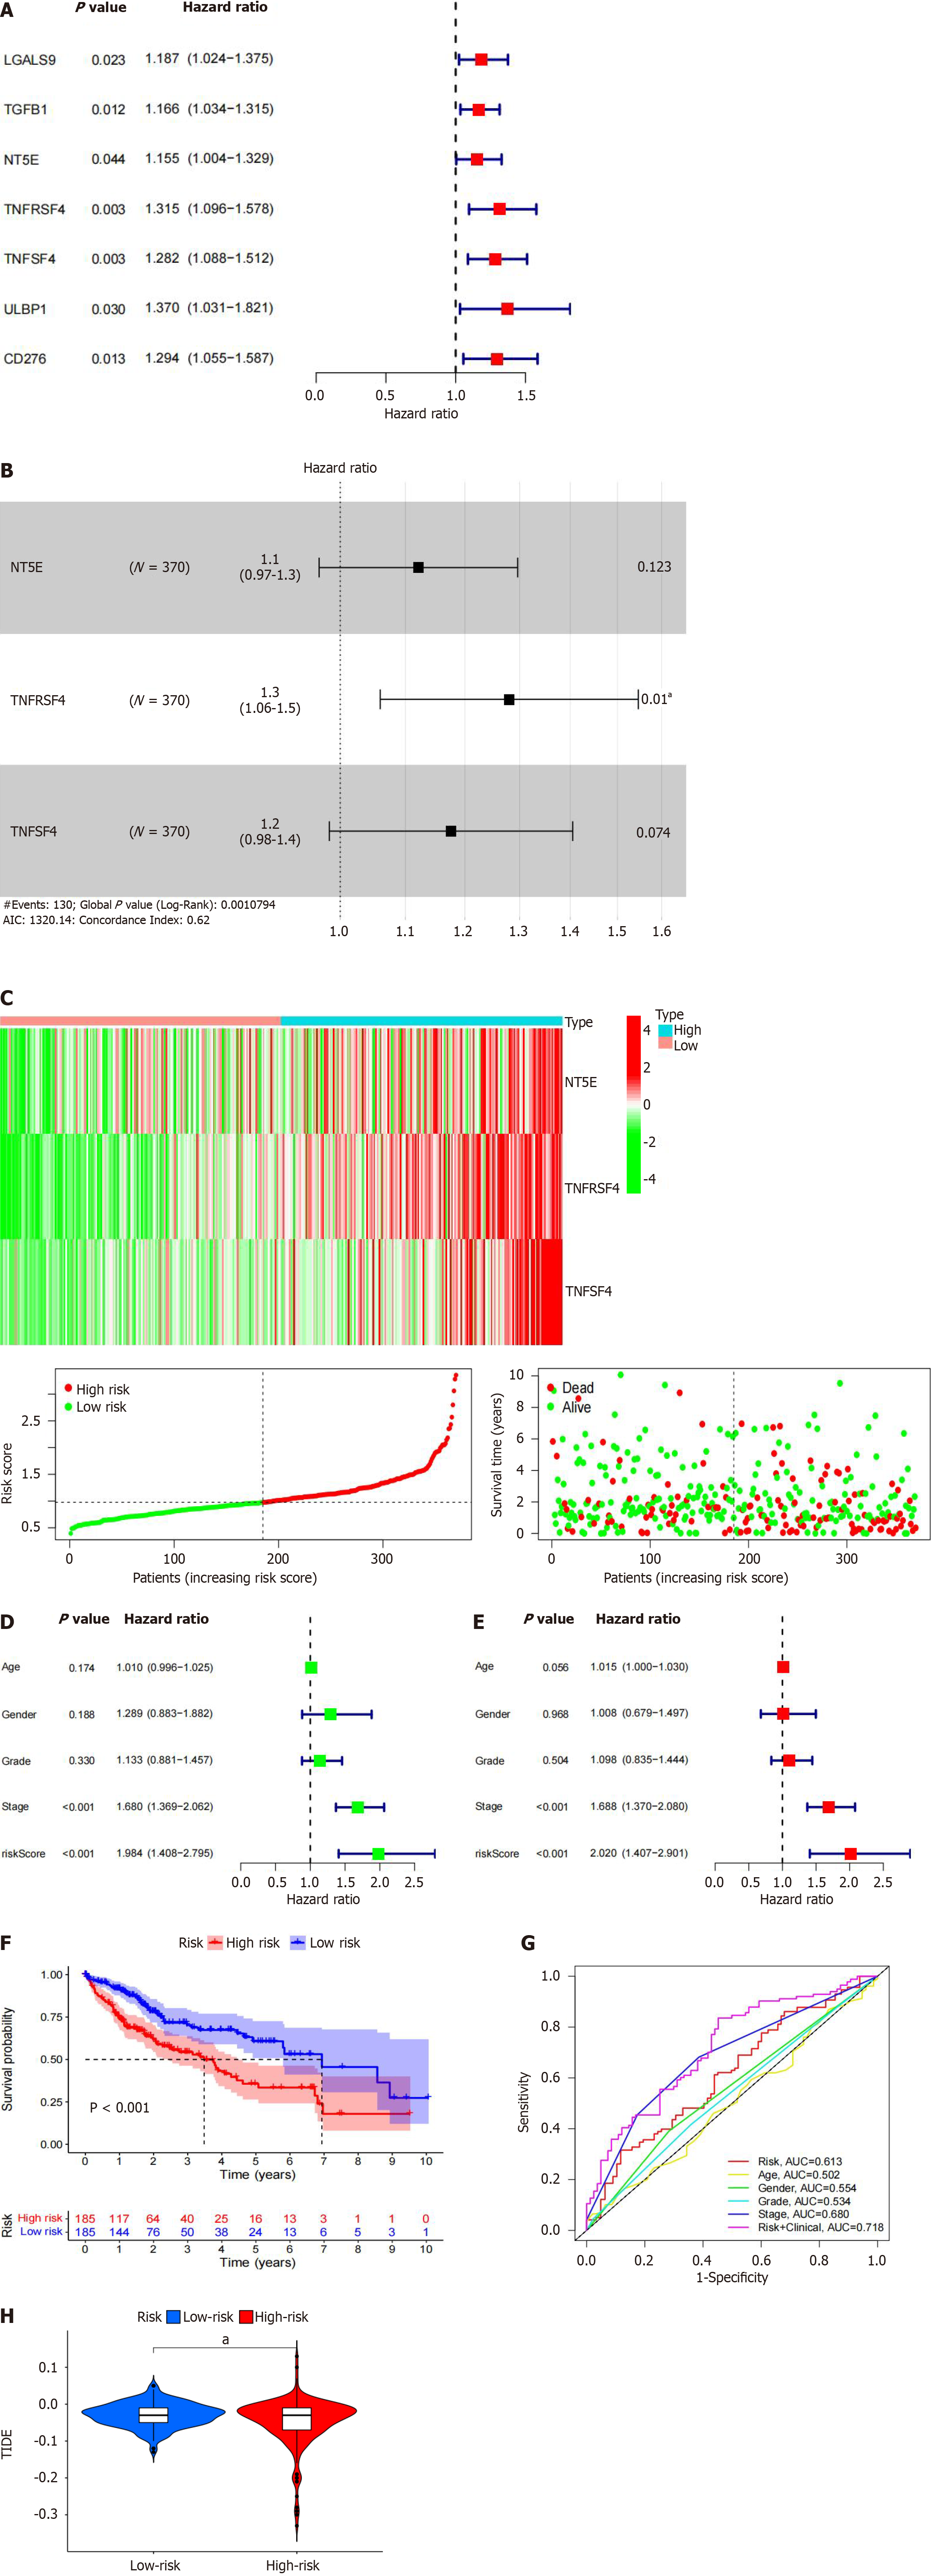
Figure 5 Risk model incorporating plexin domain-containing 1-associated immune checkpoints in hepatocellular carcinoma based on the The Cancer Genome Atlas database.
A: Construction of a prognostic immune checkpoint model associated with plexin domain-containing 1 (PLXDC1) in hepatocellular carcinoma (HCC); B and C: Proportional regression model of Cox risk for PLXDC1 in HCC with associated immune checkpoints CD73, TNFRSF4, and TNFSF4; D and E: Univariate and multifactor Cox analysis of model risk scores combined with clinical factors; F: Prognostic analysis results; G: The accuracy of the Cox model risk prediction was assessed using receiver operational characteristic curves; H: The immune evasion ability and immunotherapy response were assessed in the high-risk and low-risk groups; the high-risk group had a better treatment outcome than the low-risk group. aP < 0.05; bP < 0.01; cP < 0.001. PLXDC1: Plexin domain-containing 1.
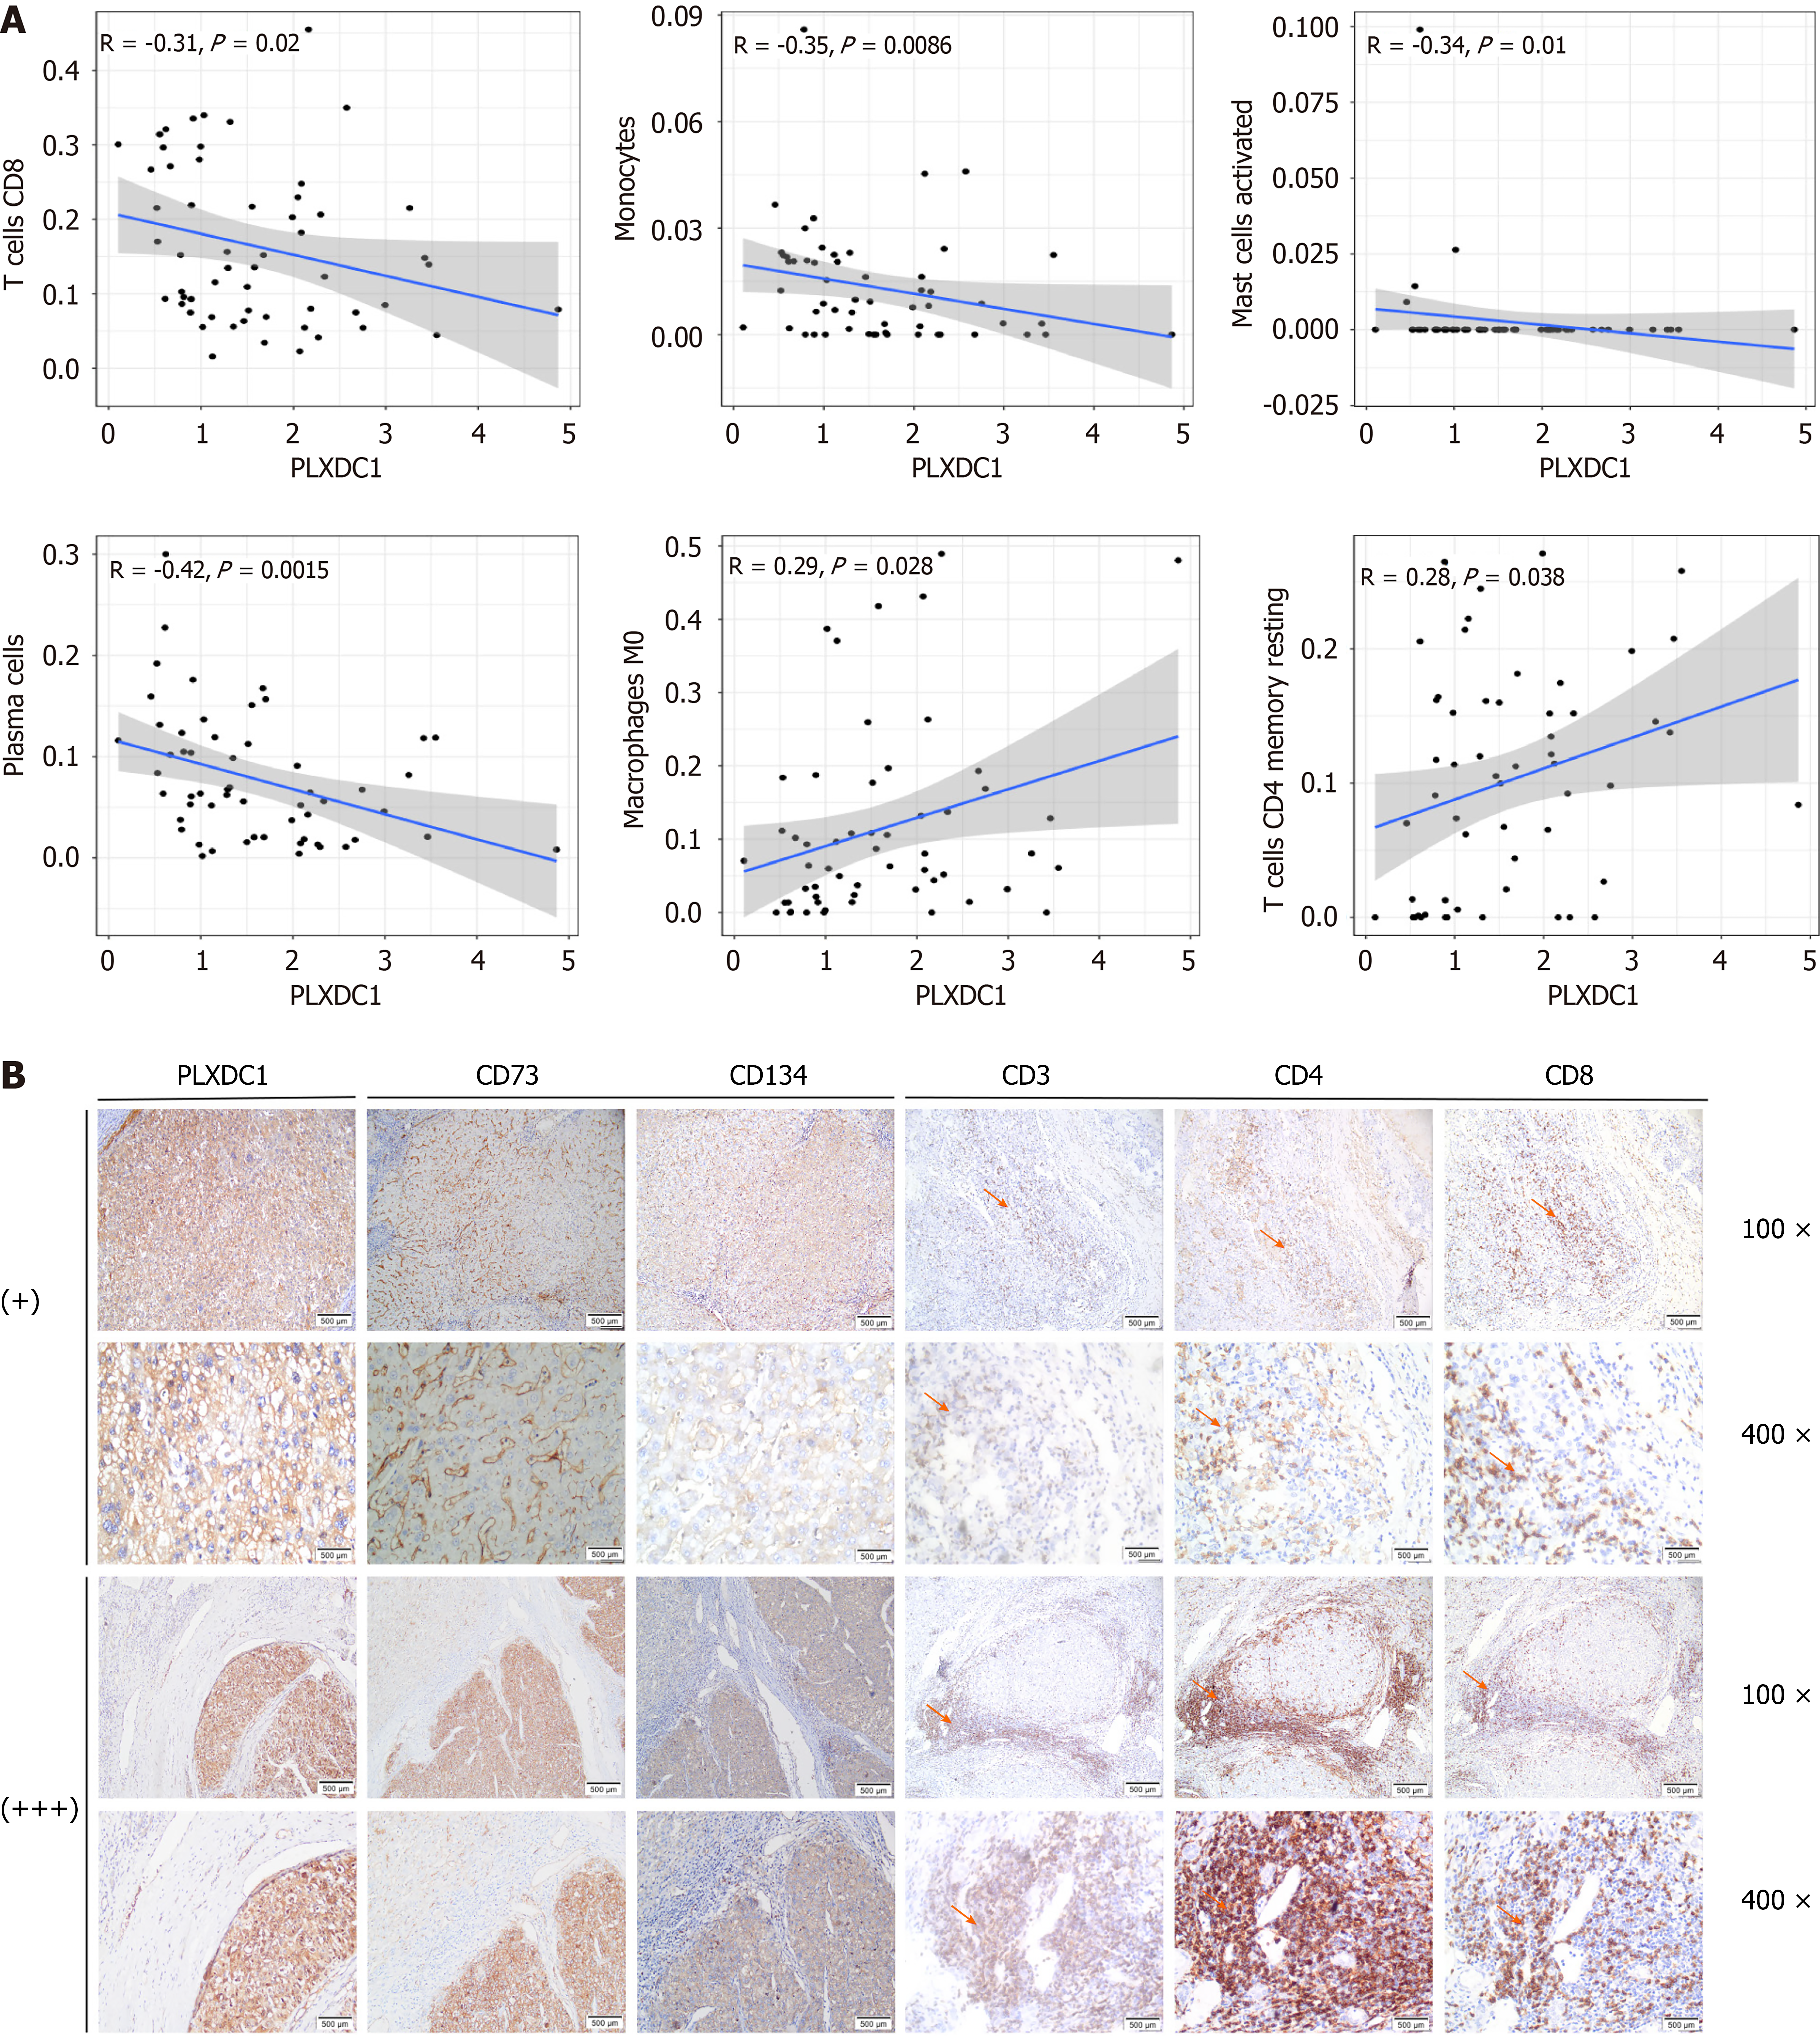
Figure 6 Immune cell infiltration in the high and low plexin domain-containing 1 gene expression groups.
A: Analysis of immune subtypes in hepatocellular carcinoma (HCC) immune cells with plexin domain-containing 1 (PLXDC1) expression in immune cells in the The Cancer Genome Atlas database; B: Immunohistochemical staining analysis of in 123 paraffin-embedded HCC samples showed that CD73 and CD134 expression levels were low when PLXDC1 expression was low, while CD3, CD4, and CD8 expression levels were low in tumor tissues with high PLXDC1 expression in the stroma; when CD73 and CD134 levels were high, PLXDC1 was also highly expressed; when CD3, CD4, and CD8 levels were low in the tumor tissue, PLXDC1 levels were high in the stroma. Orange arrows: Location of immune cells.
- Citation: Tang MY, Shen X, Yuan RS, Li HY, Li XW, Jing YM, Zhang Y, Shen HH, Wang ZS, Zhou L, Yang YC, Wen HX, Su F. Plexin domain-containing 1 may be a biomarker of poor prognosis in hepatocellular carcinoma patients, may mediate immune evasion. World J Gastrointest Oncol 2024; 16(5): 2091-2112
- URL: https://www.wjgnet.com/1948-5204/full/v16/i5/2091.htm
- DOI: https://dx.doi.org/10.4251/wjgo.v16.i5.2091


