Copyright
©The Author(s) 2024.
World J Gastrointest Oncol. May 15, 2024; 16(5): 2074-2090
Published online May 15, 2024. doi: 10.4251/wjgo.v16.i5.2074
Published online May 15, 2024. doi: 10.4251/wjgo.v16.i5.2074
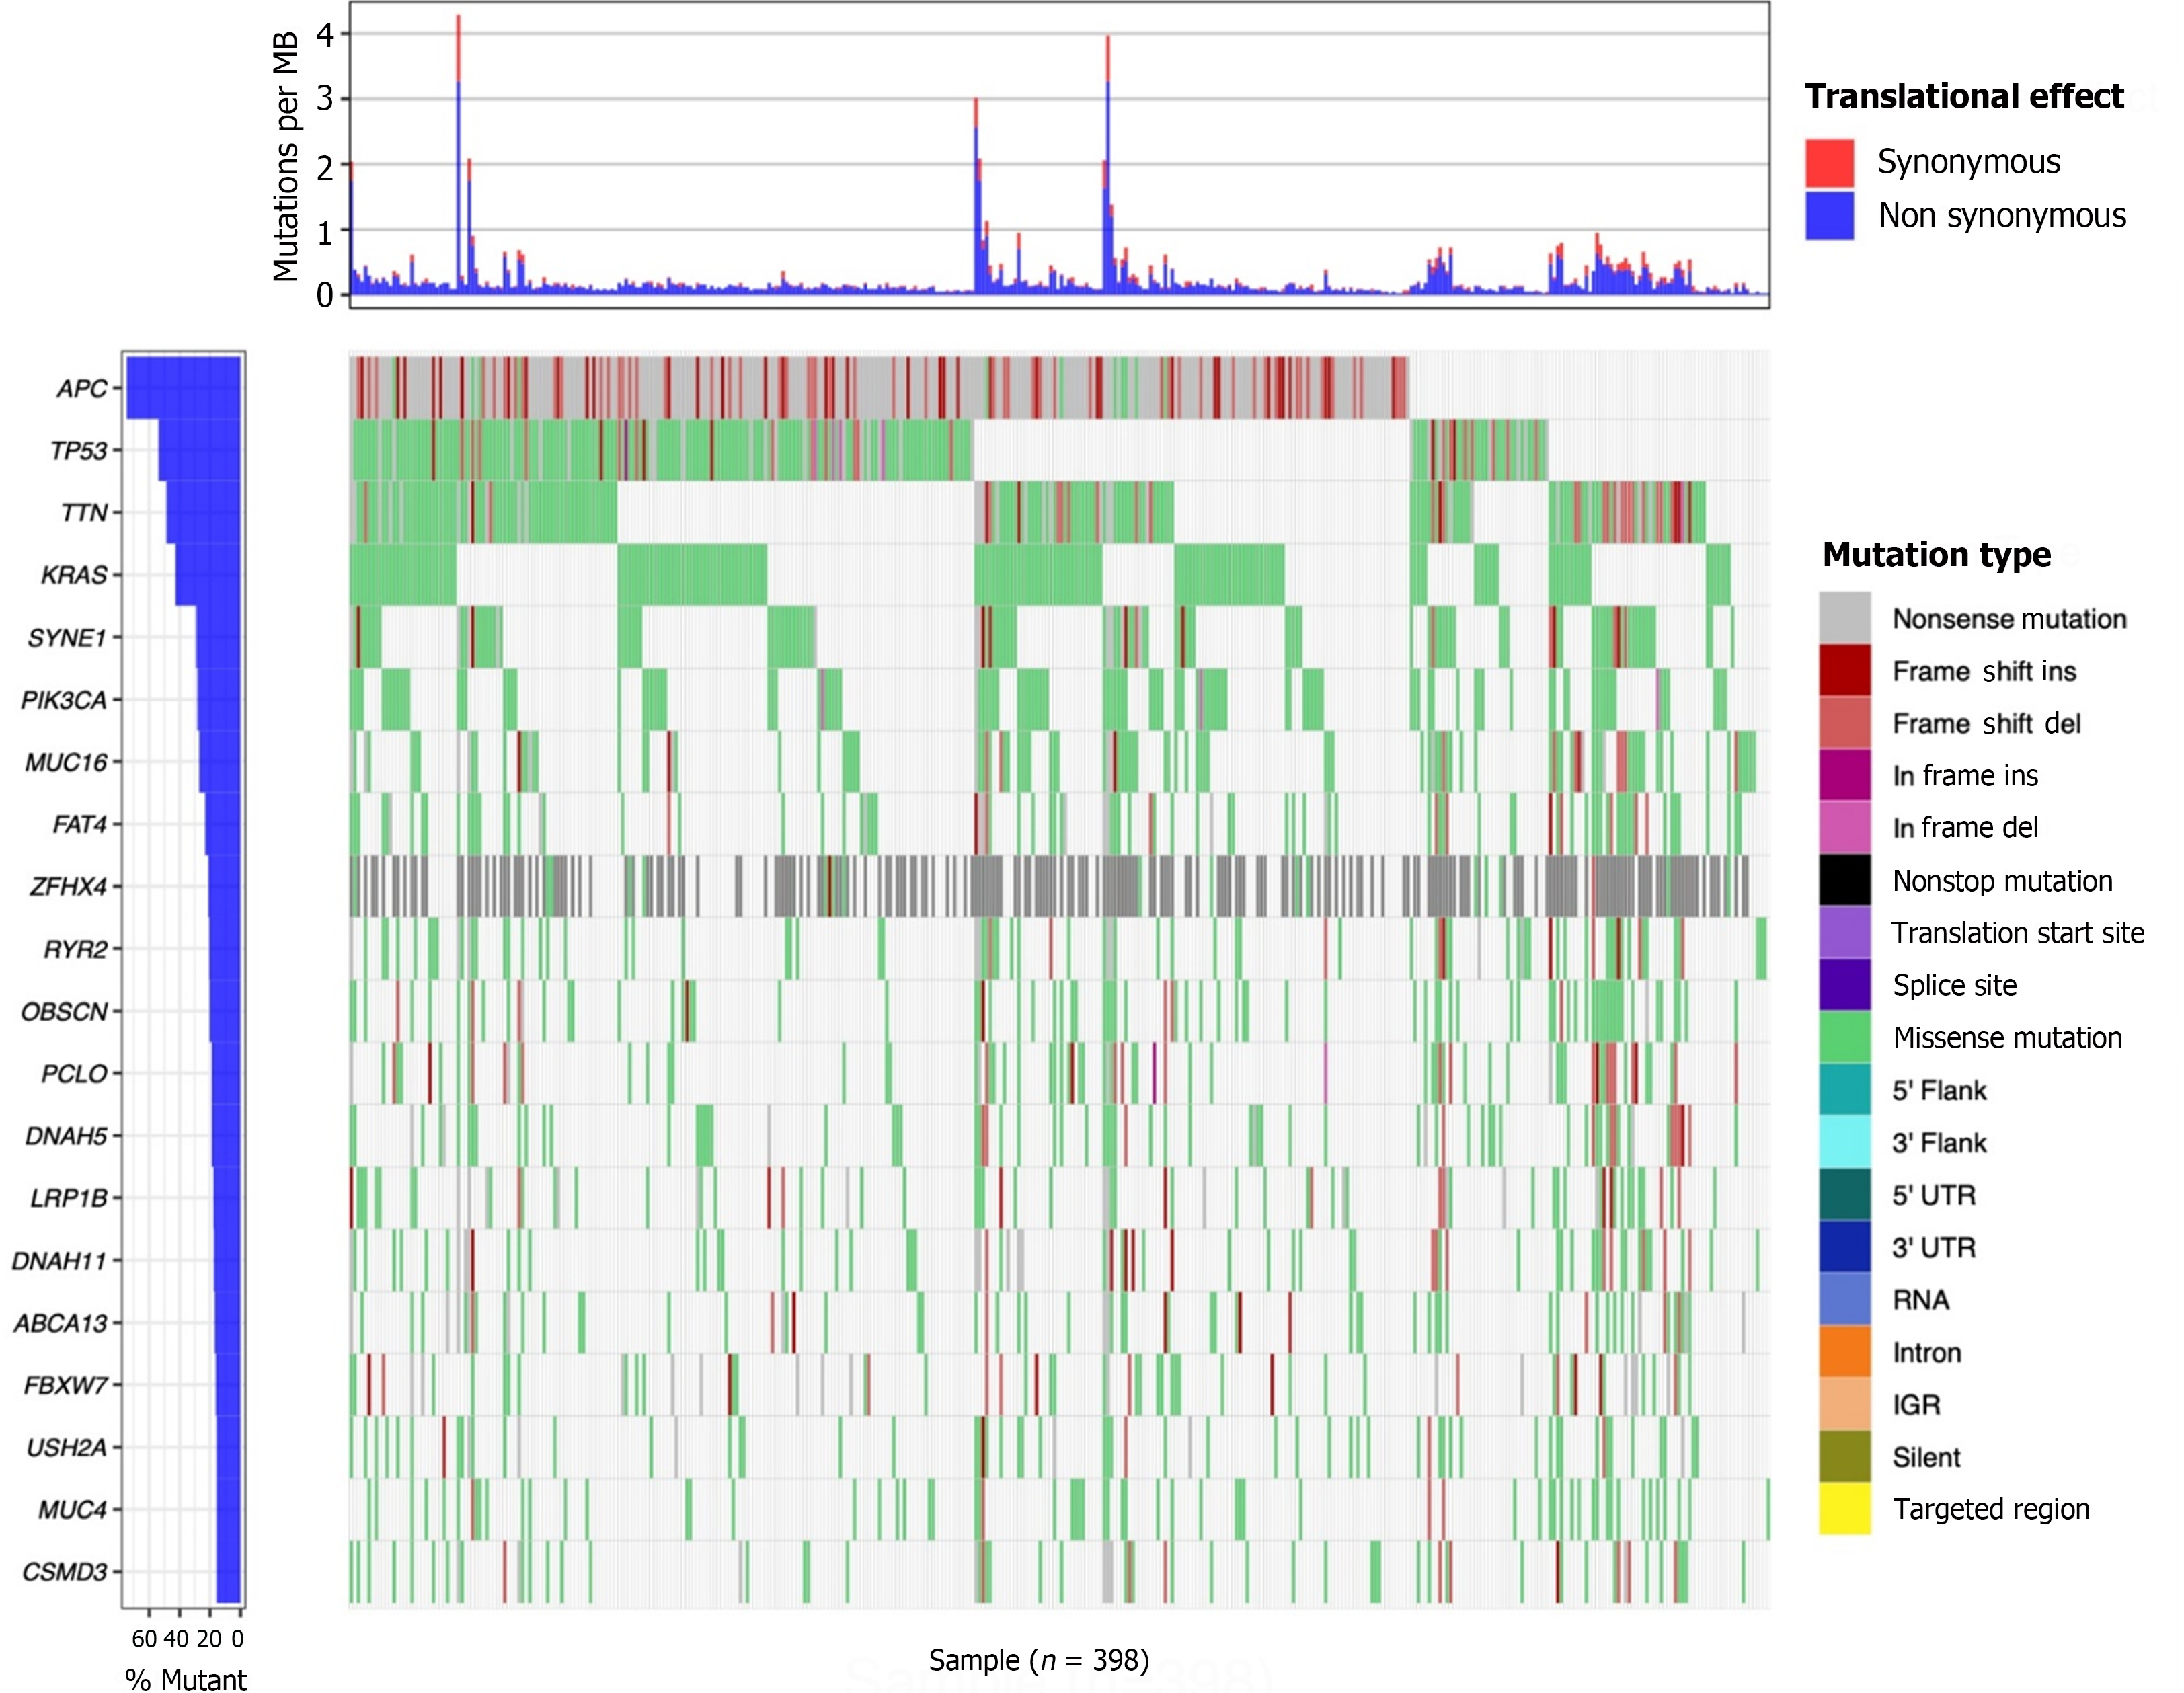
Figure 1
Landscape of mutation profiles in patients with colon cancer.
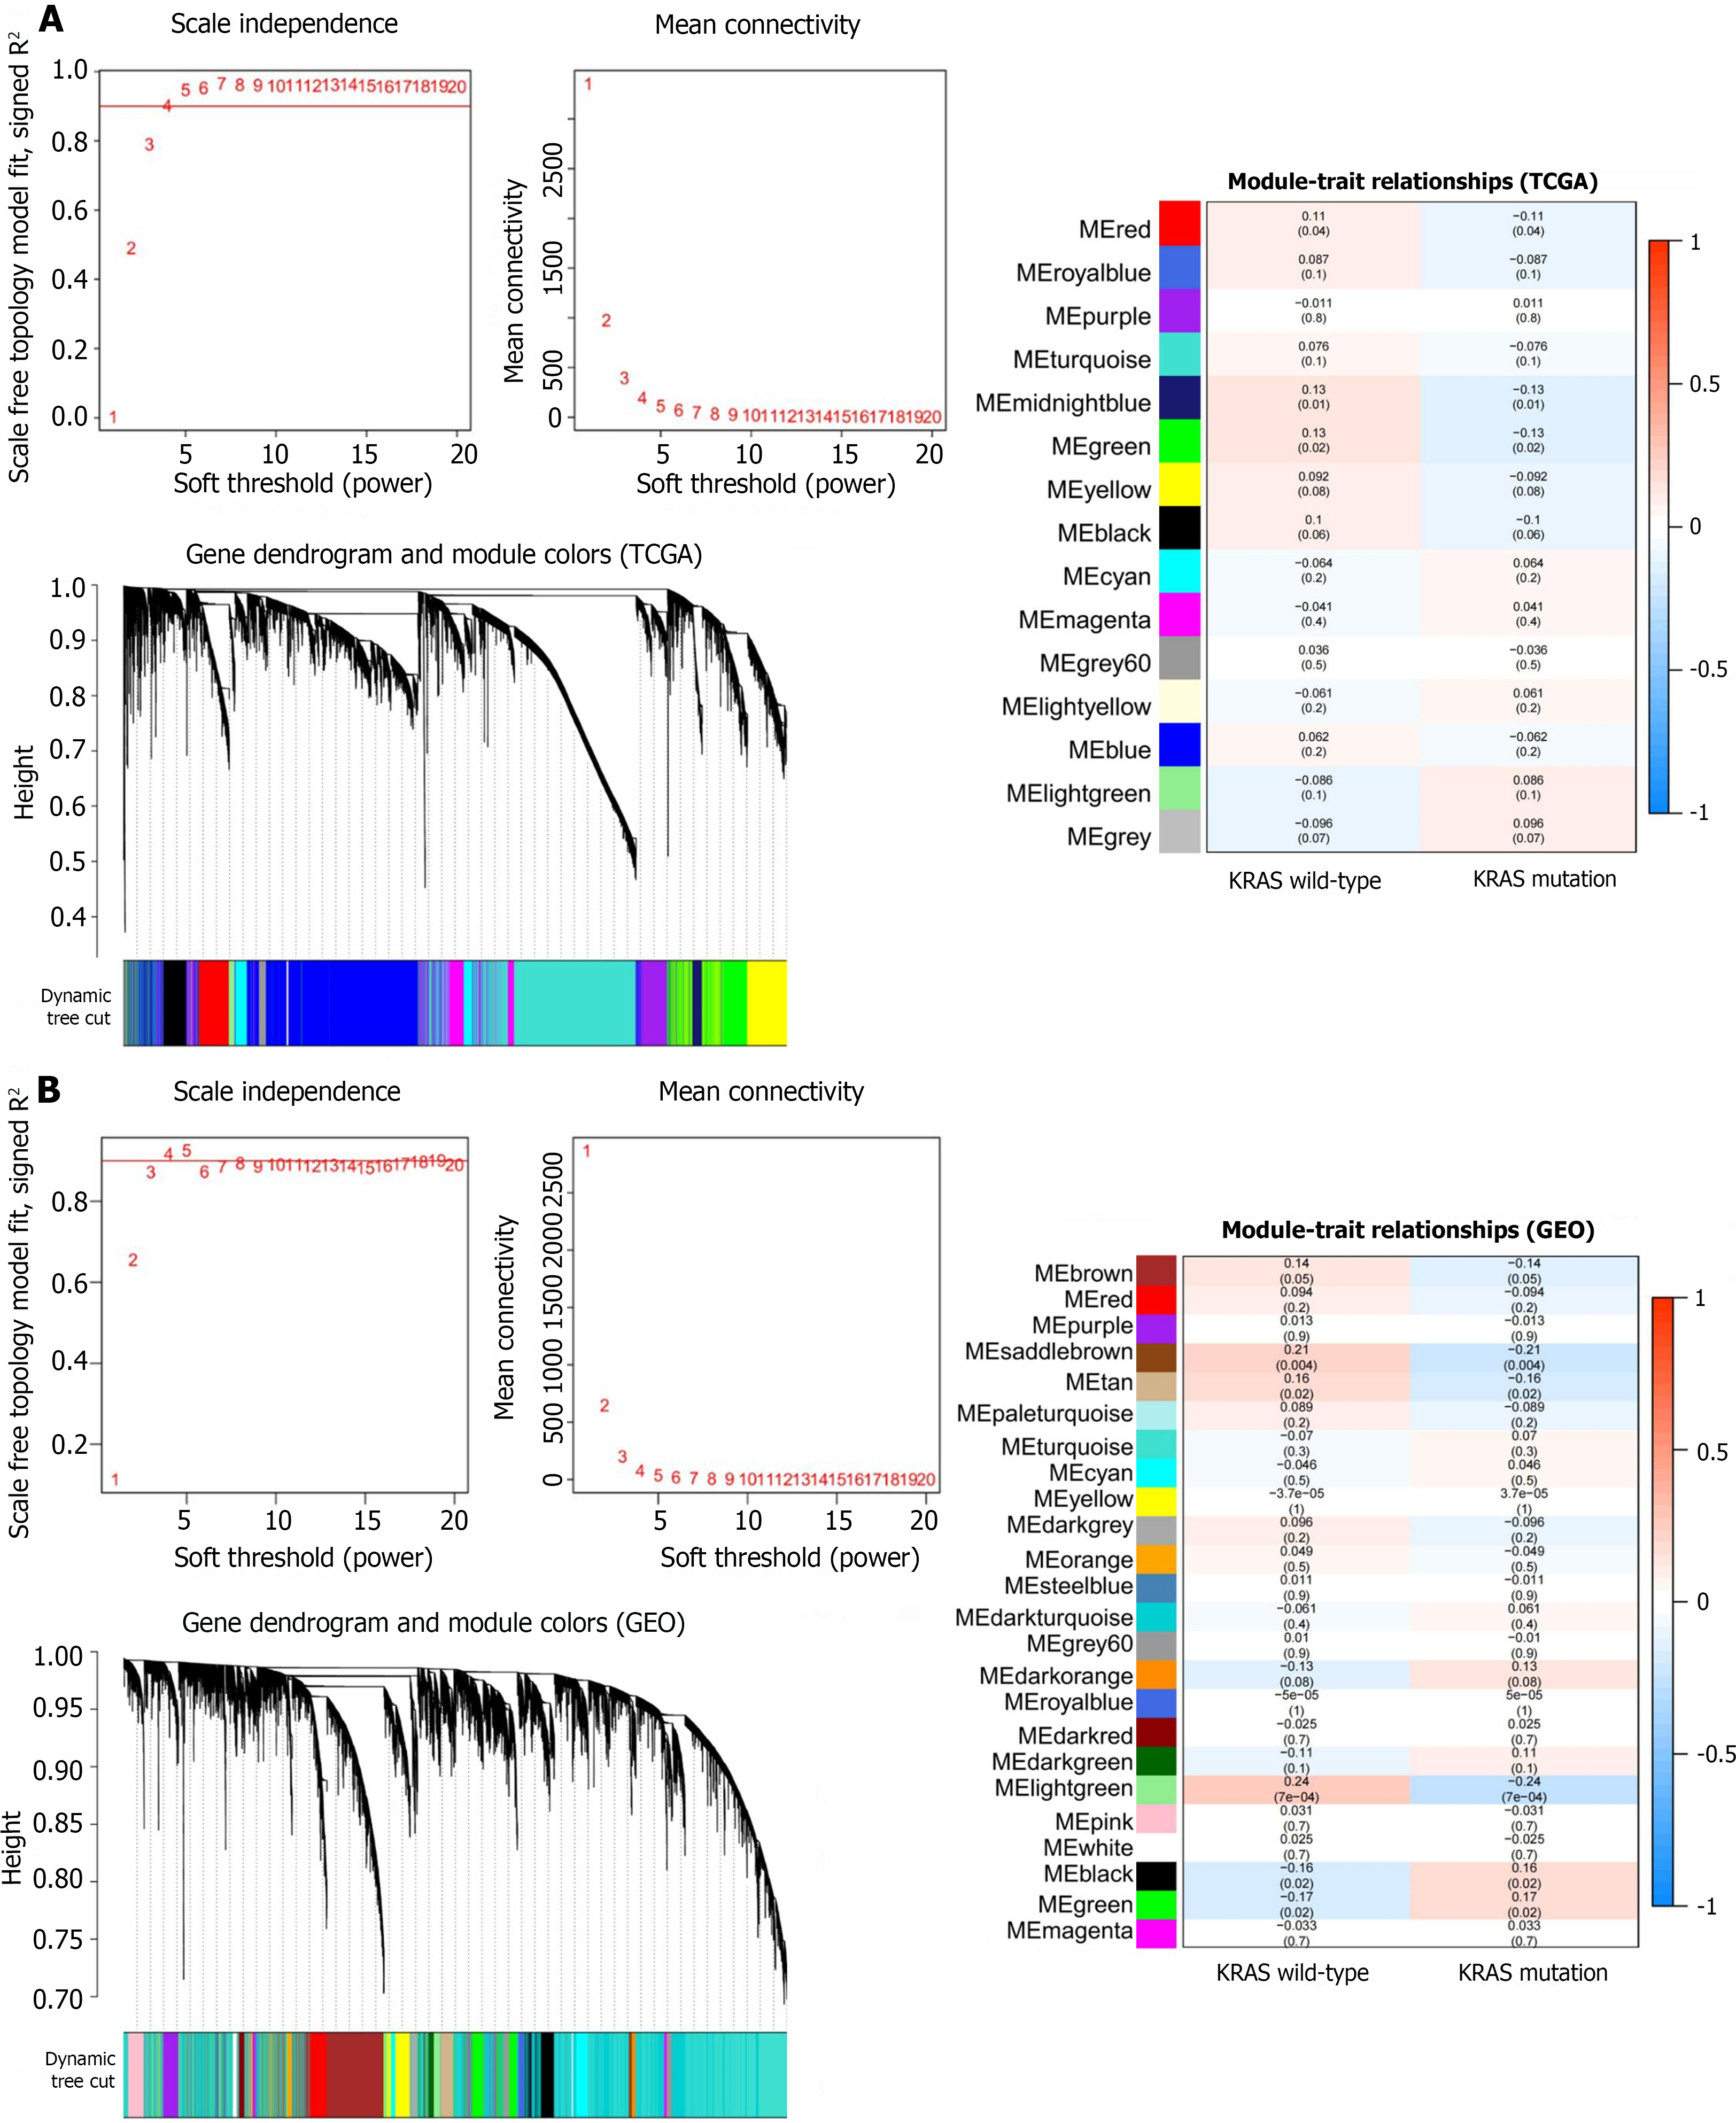
Figure 2 Weighted gene co-expression network analysis was performed to identify the KRAS mutation-related modules.
A: Weighted gene co-expression network analysis (WGCNA) results based on the The Cancer Genome Atlas-colon adenocarcinoma cohort; B: WGCNA results based on the GSE87211 cohort. TCGA: The Cancer Genome Atlas; GEO: Gene Expression Omnibus.
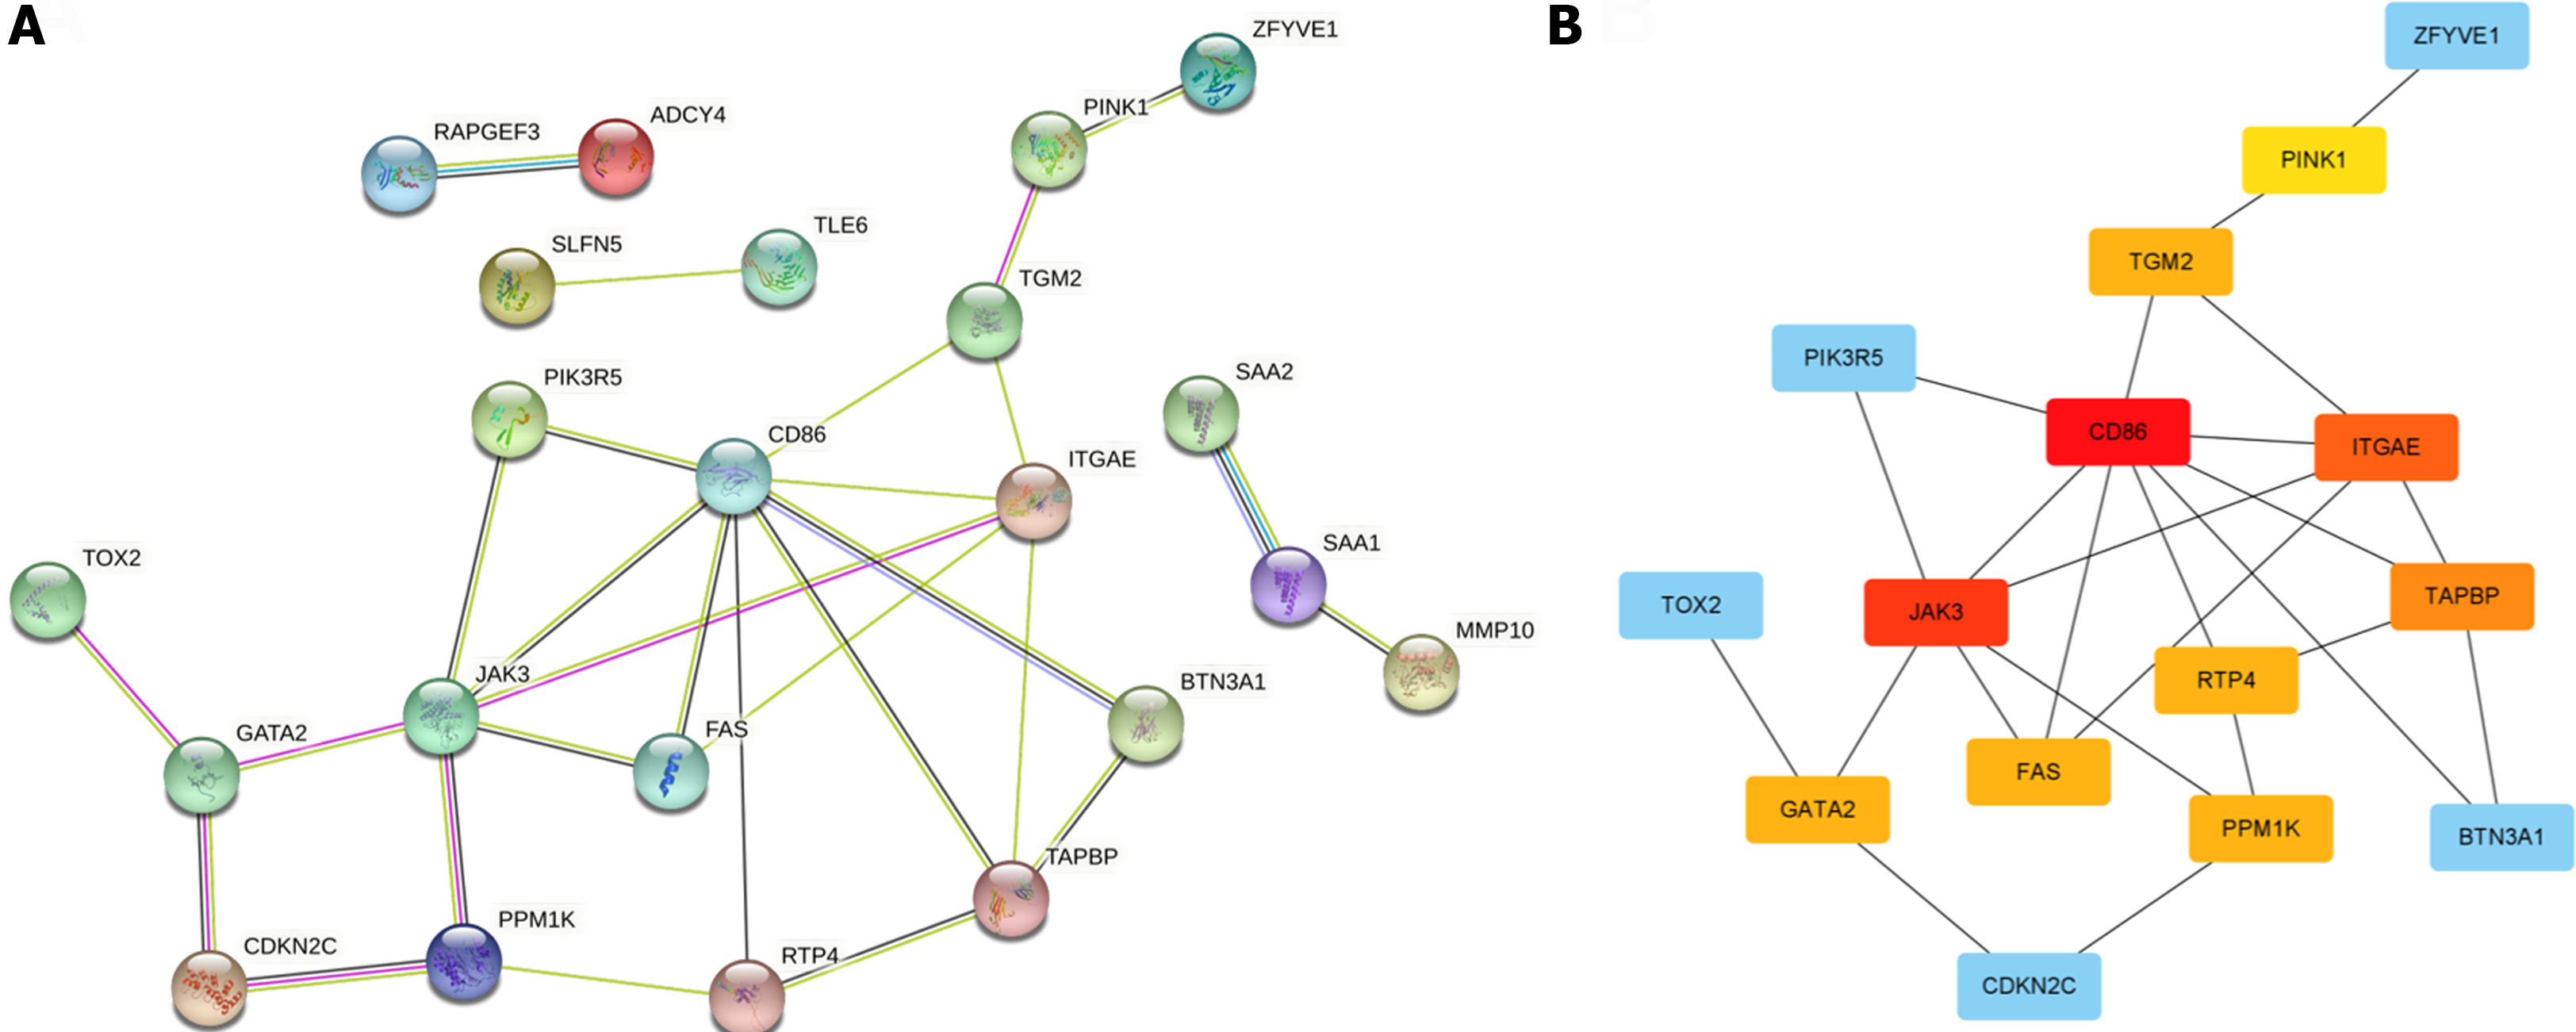
Figure 3 Construction of key genes network based on STRING database and Cytoscape software.
A: STRING database was used for the construction of protein-protein interaction network; B: CytoHubba plugin within the Cytoscape software was used for the construction of hub genes network.
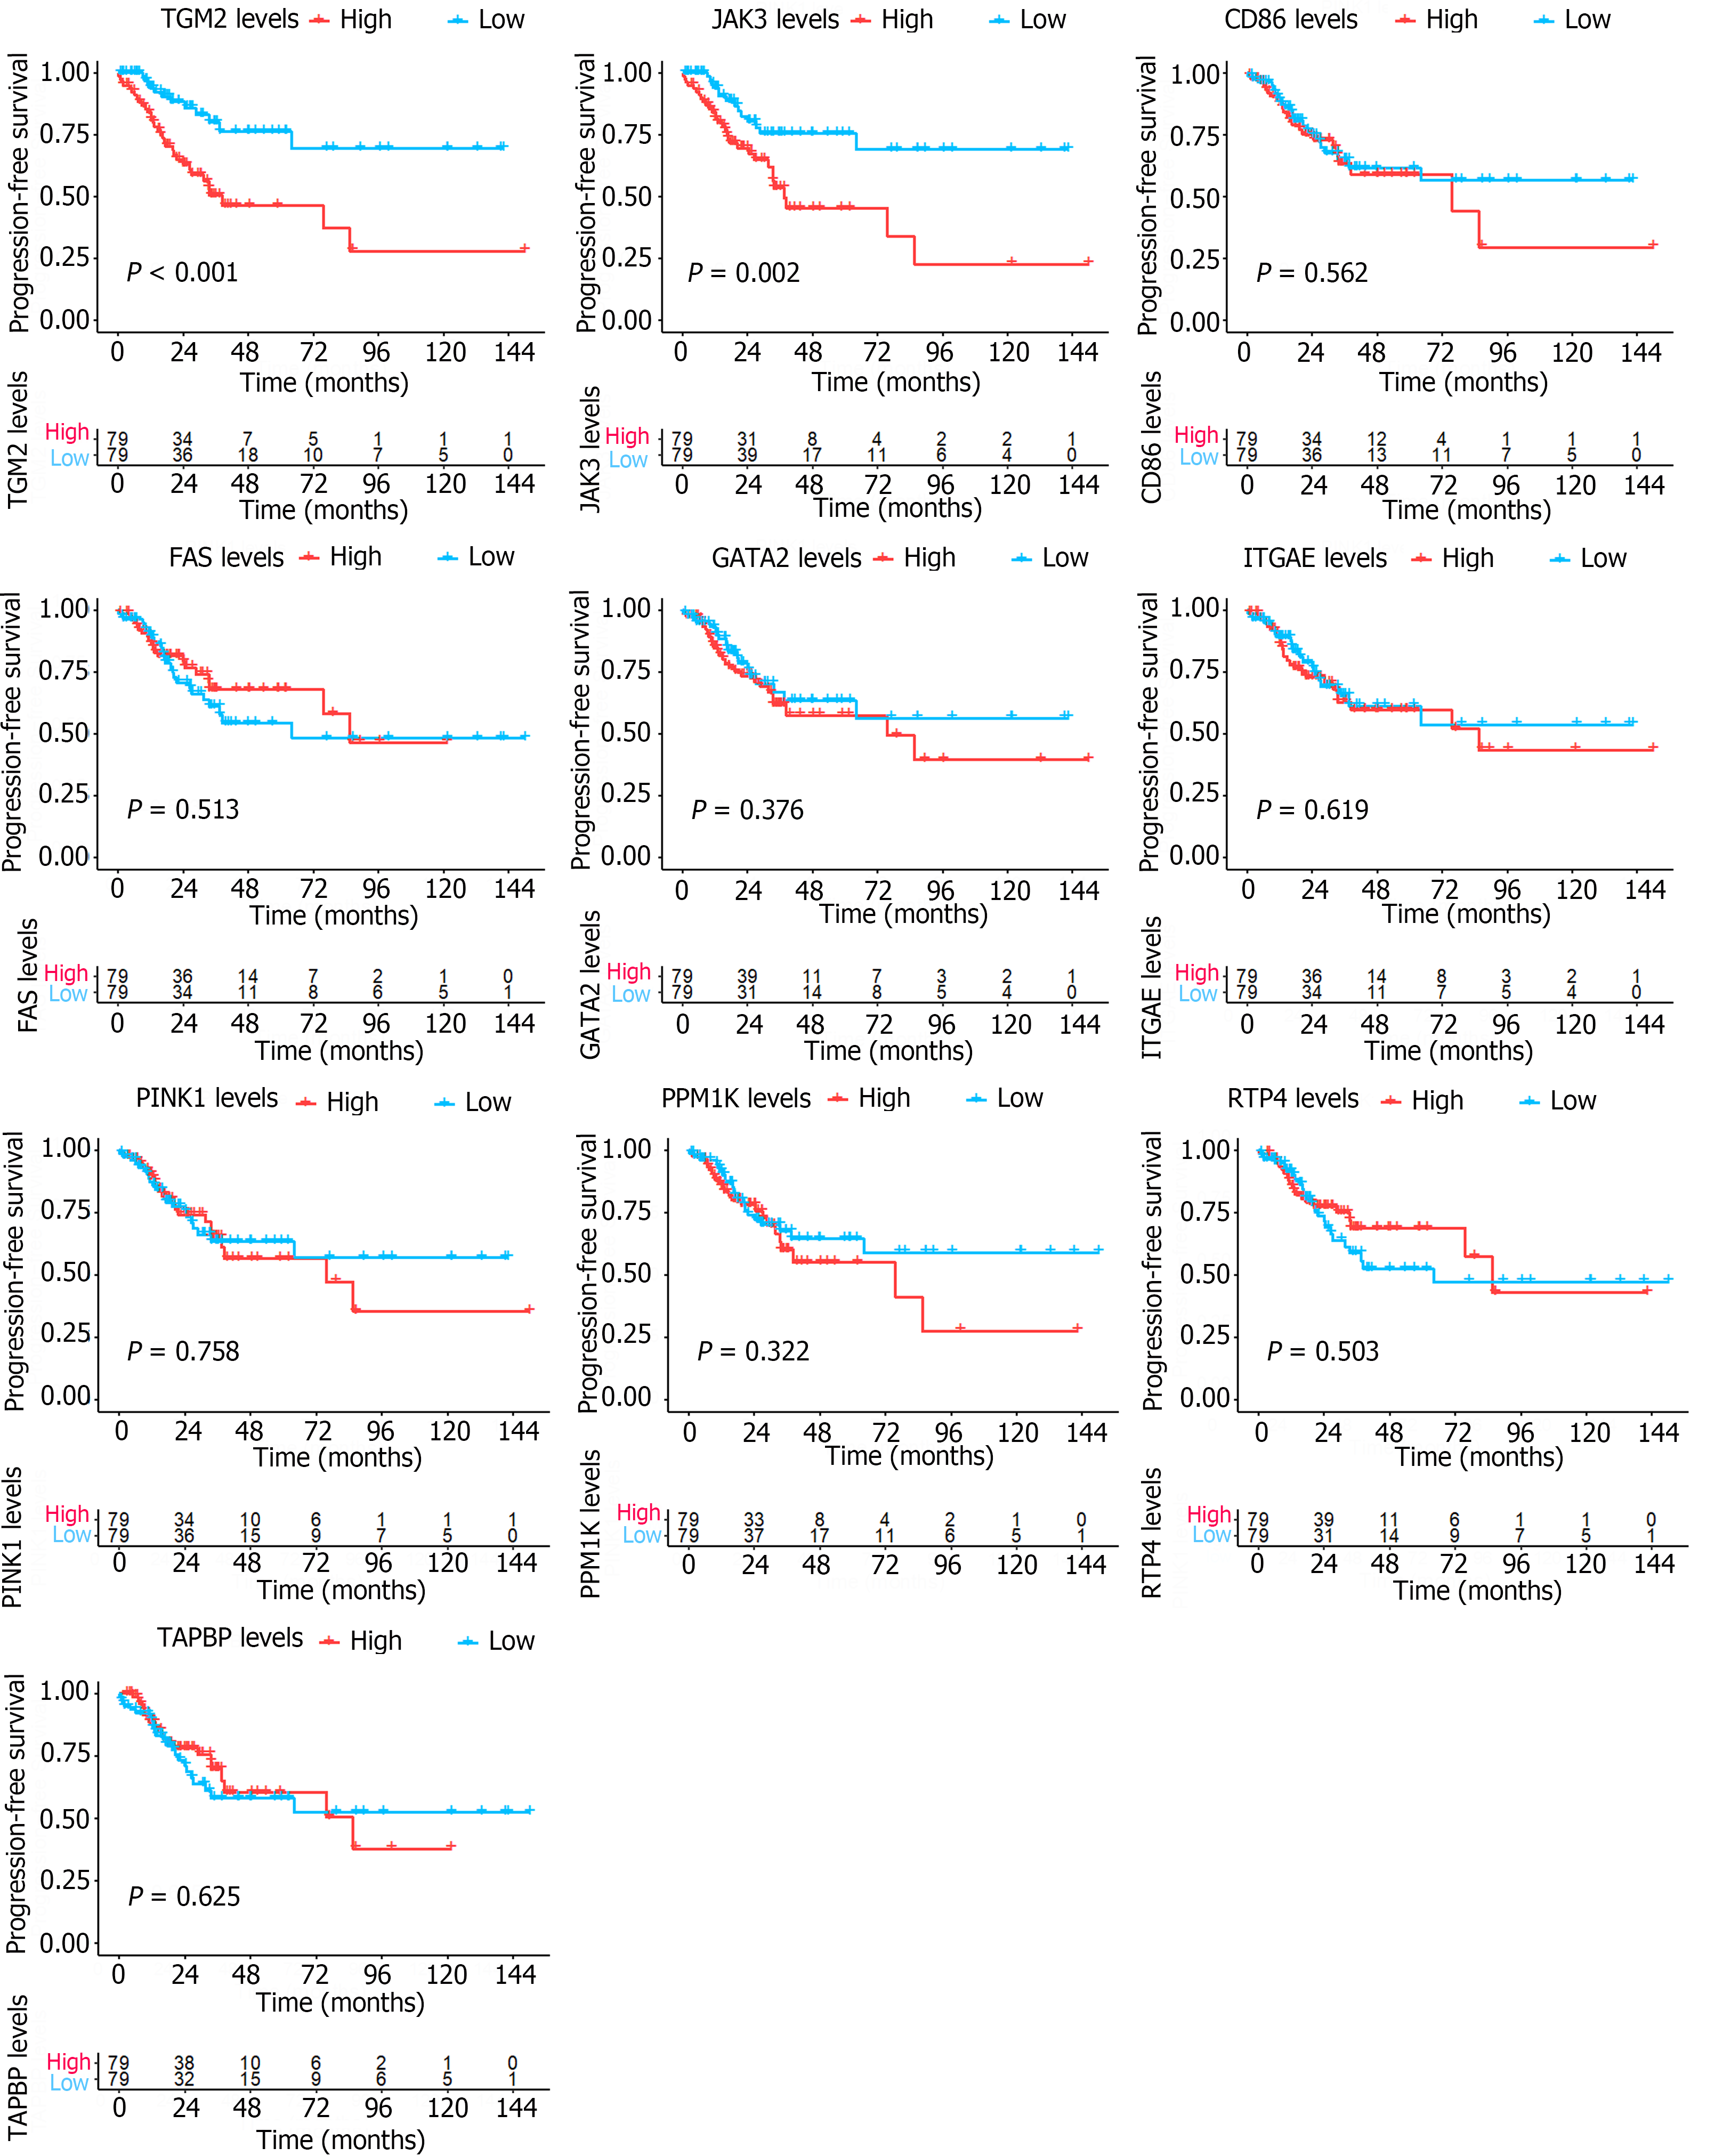
Figure 4 Kaplan-Meier survival analysis for progression-free survival in a cohort of 158 individuals with KRAS mutant colon cancer.
TGM2: Transglutaminase 2.
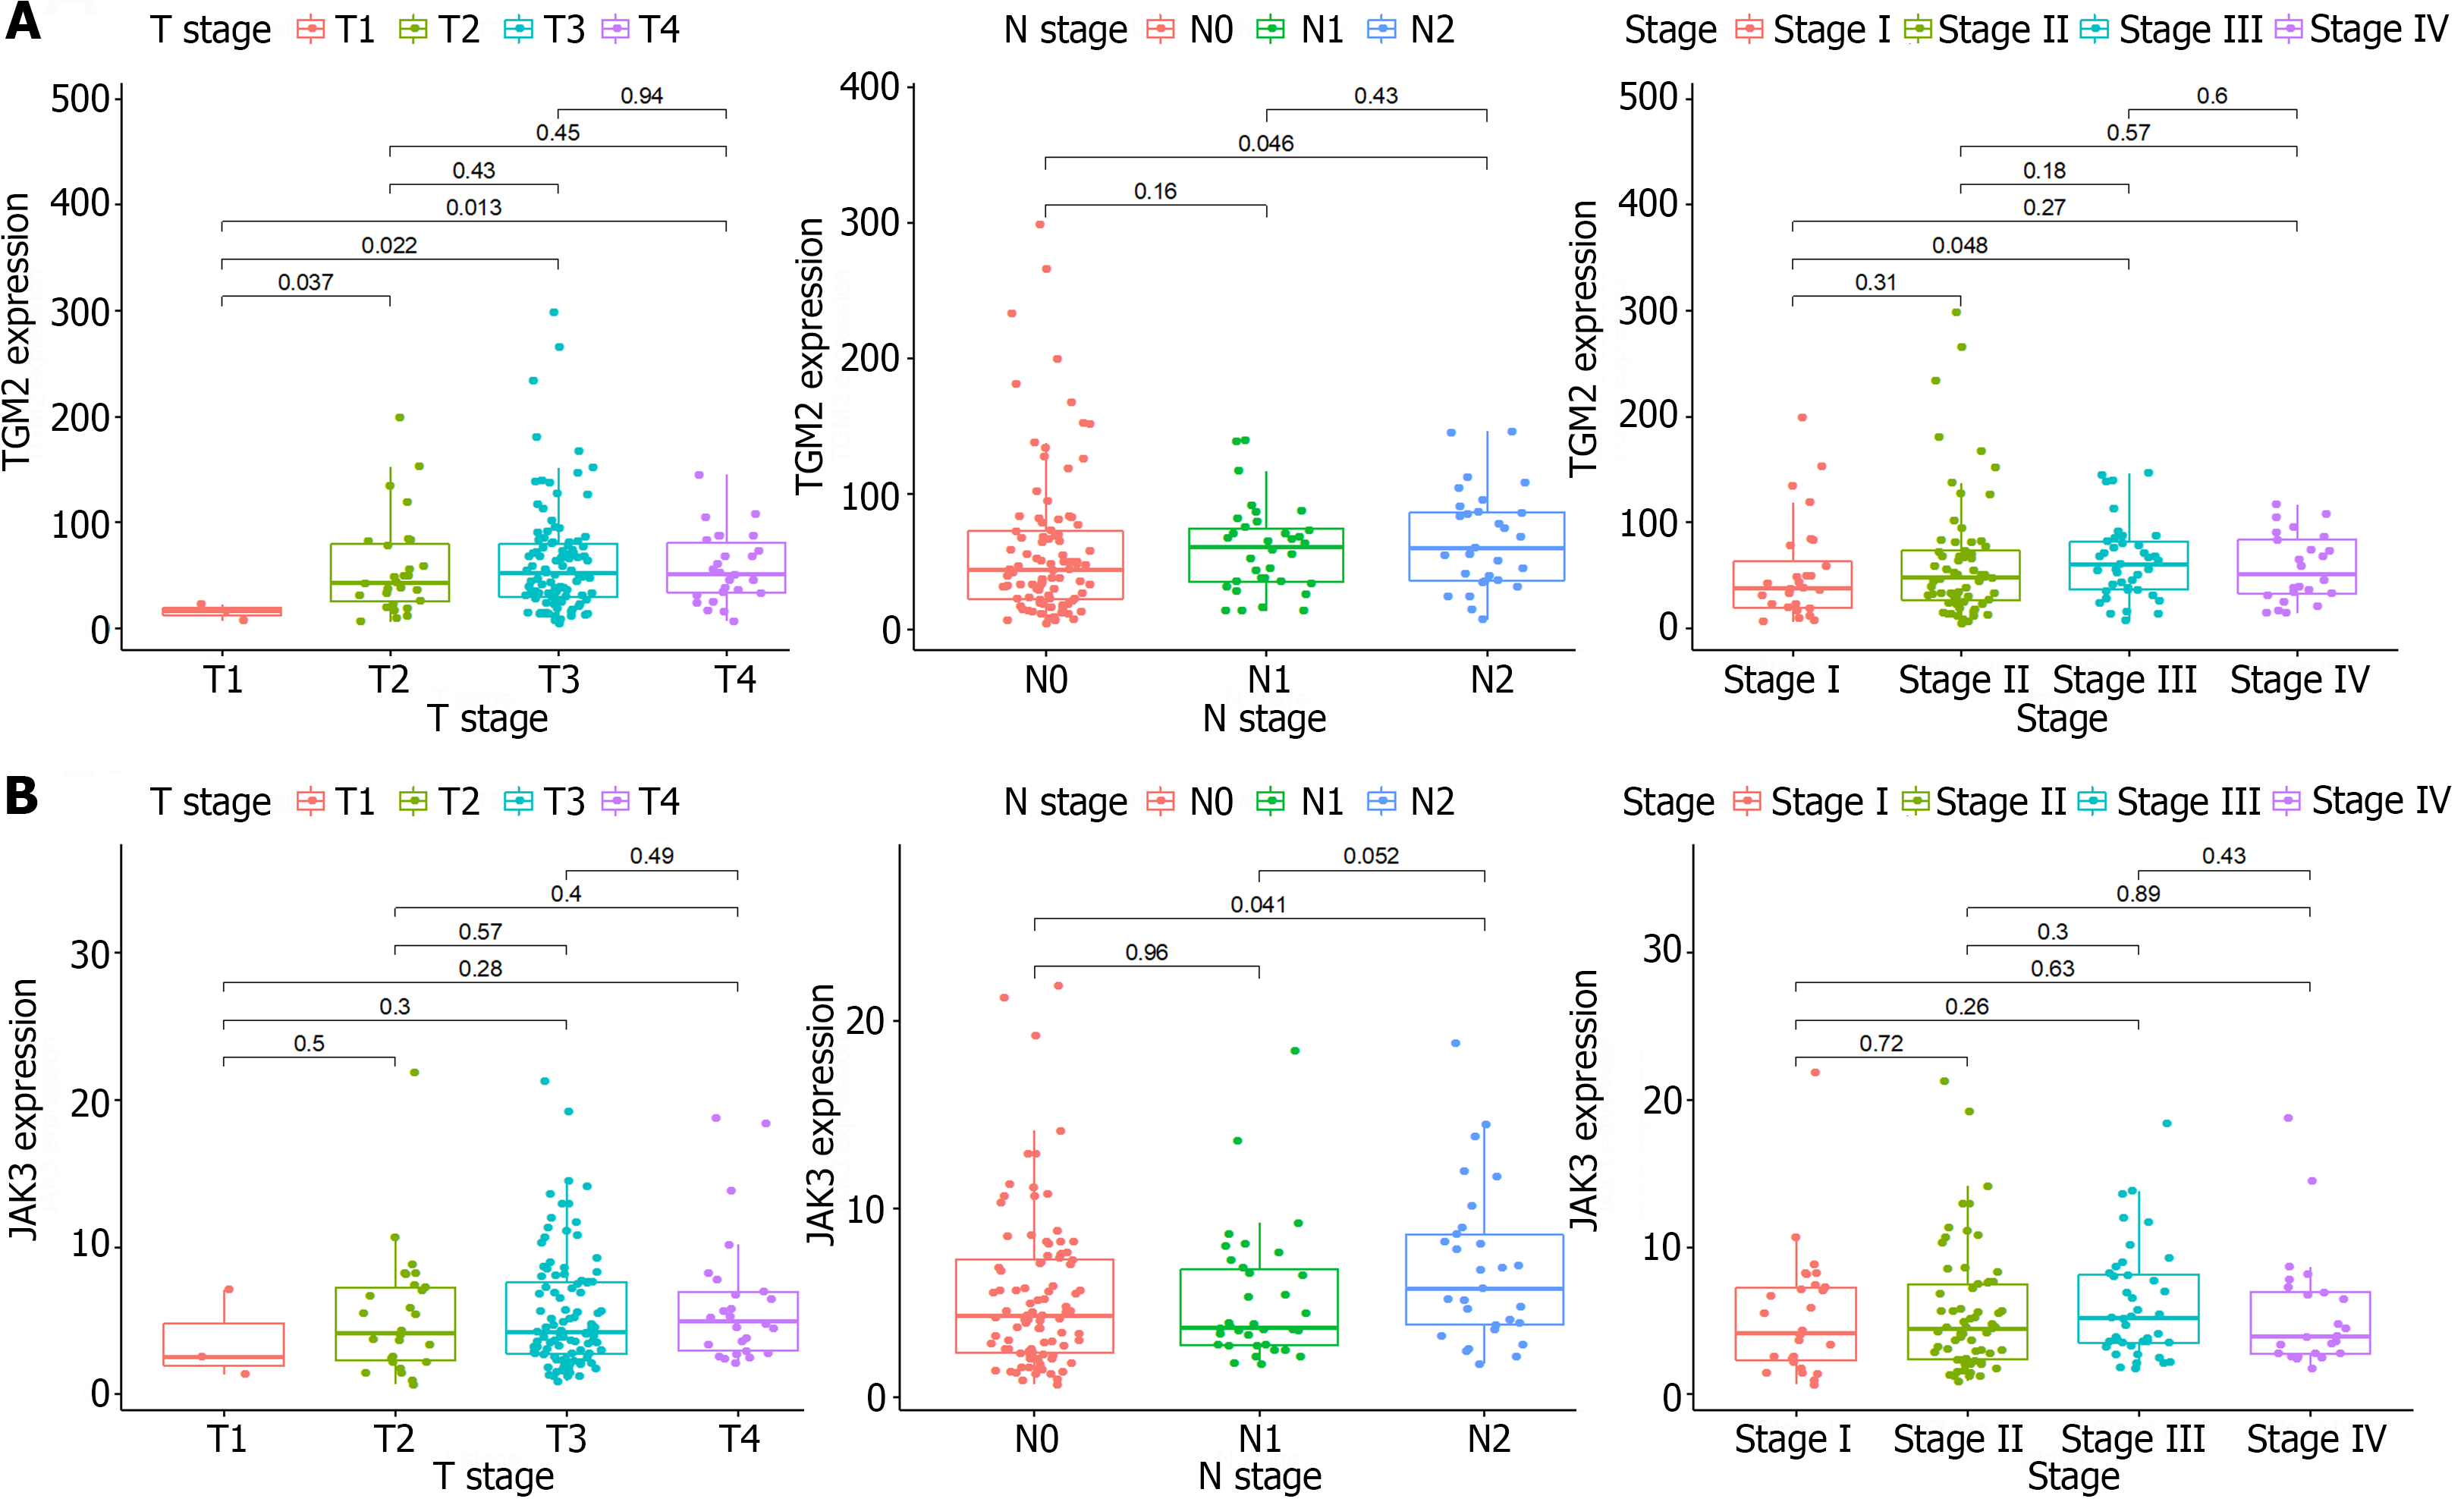
Figure 5 Associations between transglutaminase 2 and JAK3 and clinicopathological characteristics in patients with KRAS mutant colon cancer.
A: High expression of transglutaminase 2 predicted higher lymph node stage; B: High expression of JAK3 predicted higher lymph node stage. TGM2: Transglutaminase 2.
Figure 6 High level of transglutaminase 2 is an independent prognostic factor for progression-free survival using univariate and multivariate Cox regression analysis.
TGM2: Transglutaminase 2; HR: Hazard ratio; CI: Confidence interval.
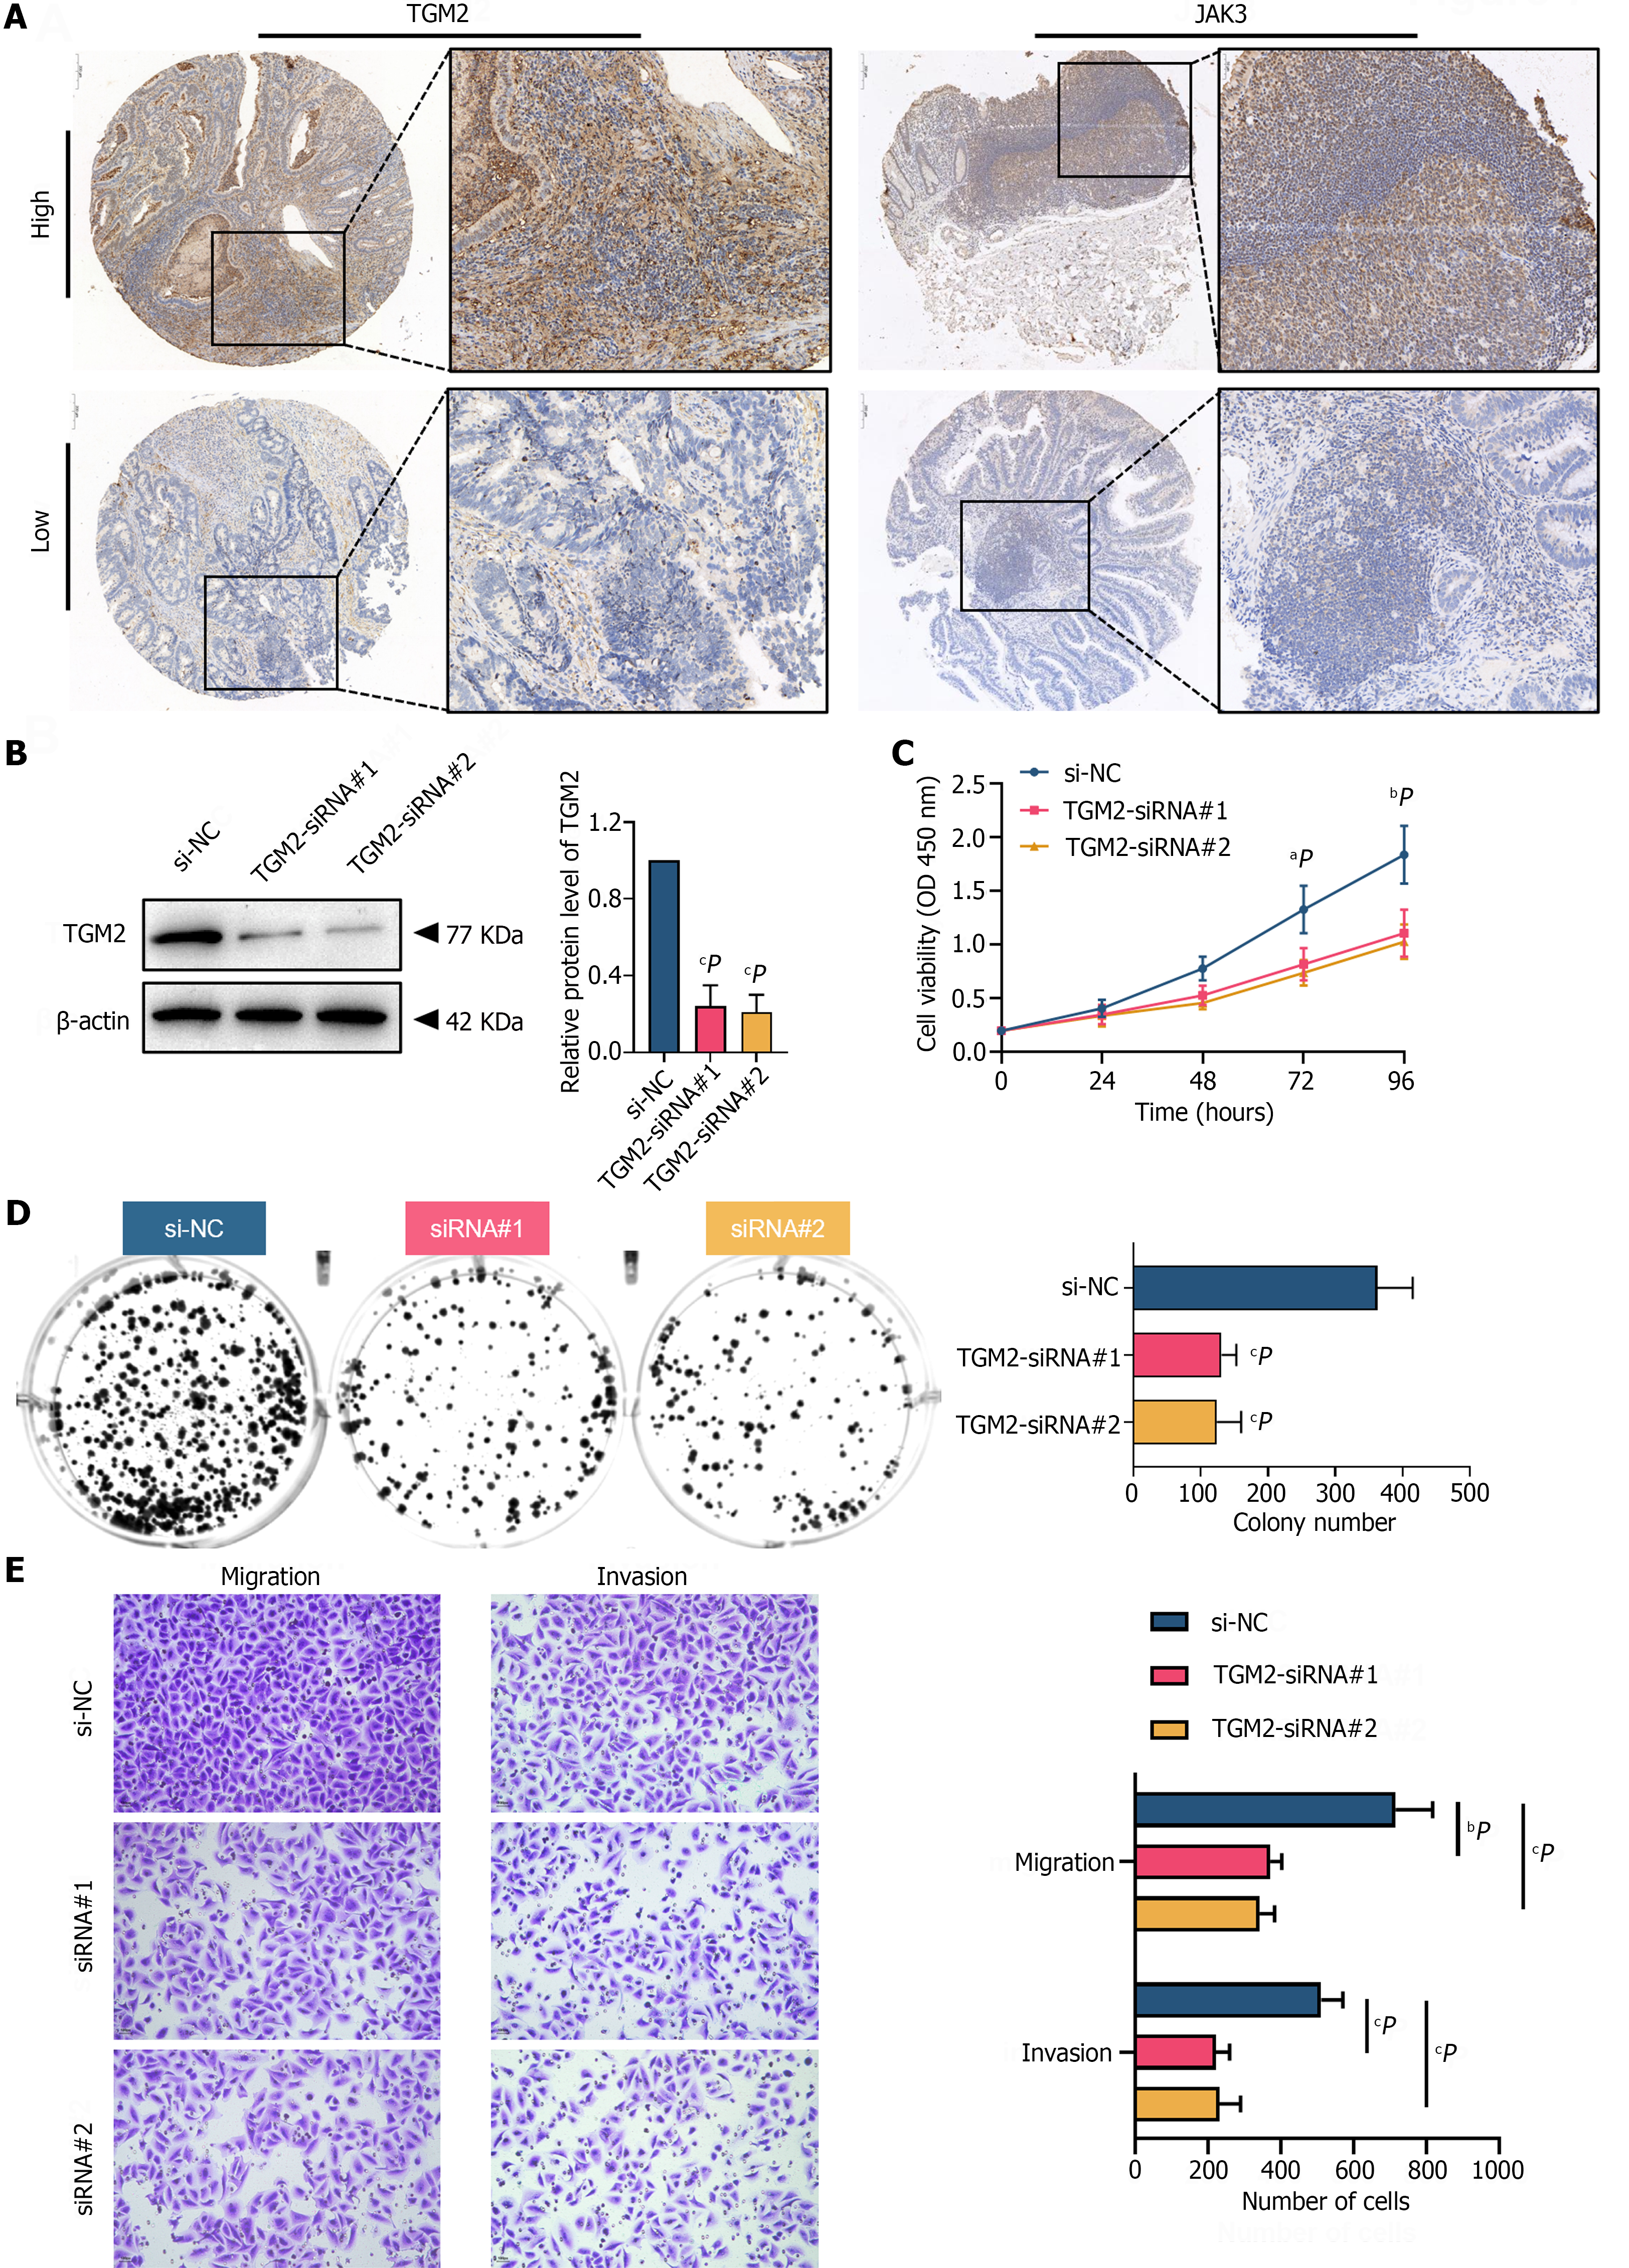
Figure 7 Molecular function of transglutaminase 2 in KRAS mutant colon cancer cell line HCT-116.
A: Immunohistochemistry images of colon cancer tissue microarray showed the location of transglutaminase 2 (TGM2) and JAK3; B: The efficiency of small interfering RNA-induced TGM2 knockdown by western blotting; C: Cell proliferation curves in TGM2-downregulated HCT-116 cells through Cell Counting Kit-8 assays; D: Representative images and bar graph of colony formation were shown in TGM2-downregulated HCT-116 cells; E: Representative images and quantification of Transwell migration assay and Transwell Matrigel invasion assay were shown in TGM2-downregulated HCT-116 cells. Data are represented as means ± SD from three separate experiment. aP < 0.05, bP < 0.01, cP < 0.001. TGM2: Transglutaminase 2; siRNA: Small interfering RNA.
- Citation: Peng WB, Li YP, Zeng Y, Chen K. Transglutaminase 2 serves as a pathogenic hub gene of KRAS mutant colon cancer based on integrated analysis. World J Gastrointest Oncol 2024; 16(5): 2074-2090
- URL: https://www.wjgnet.com/1948-5204/full/v16/i5/2074.htm
- DOI: https://dx.doi.org/10.4251/wjgo.v16.i5.2074


