Copyright
©The Author(s) 2024.
World J Gastrointest Oncol. May 15, 2024; 16(5): 2038-2059
Published online May 15, 2024. doi: 10.4251/wjgo.v16.i5.2038
Published online May 15, 2024. doi: 10.4251/wjgo.v16.i5.2038
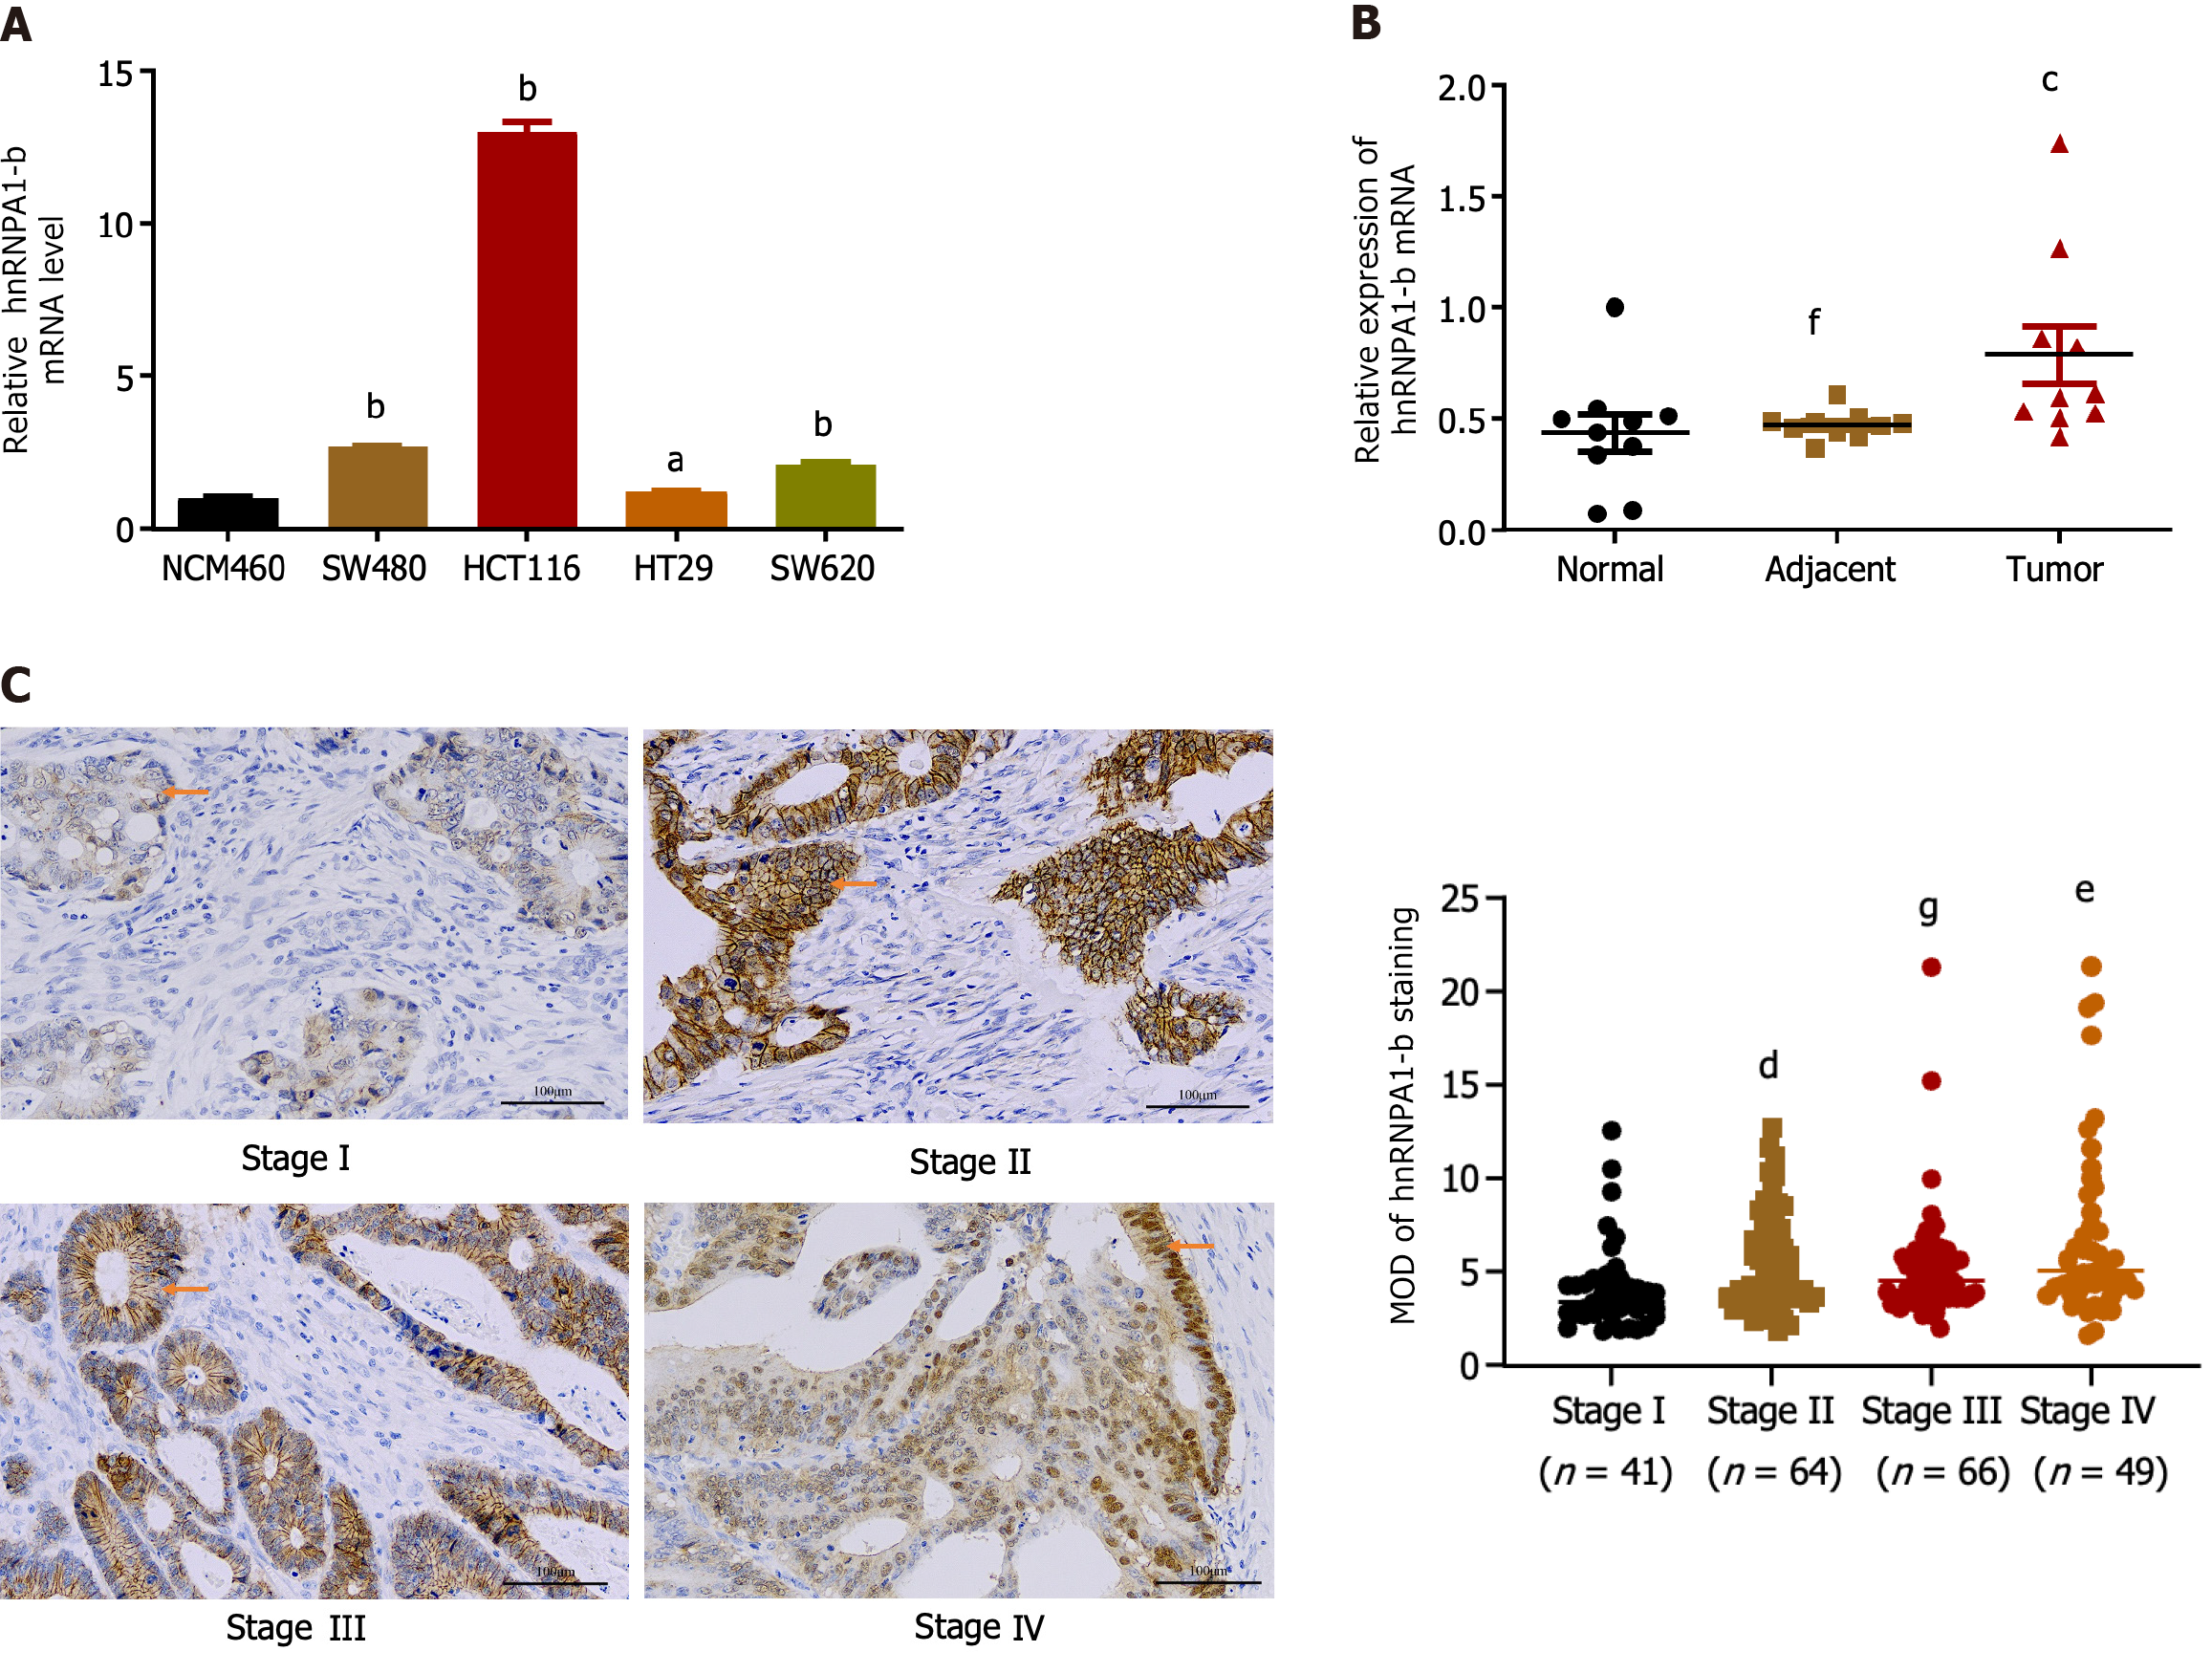
Figure 1 Heterogeneous ribonucleoprotein A1-b expression is upregulated in colon cancer and correlated with colon cancer progression.
A: The mRNA expression level of heterogeneous ribonucleoprotein A1 (hnRNPA1)-b in colon cancer (CC) cell lines (SW480, HCT116, HT29, and SW620) and normal colon epithelial cell NCM460 were detected by quantitative real-time polymerase chain reaction; B: The mRNA expression level of hnRNPA1-b is upregulated in CC tissues relative to paired paracancerous and normal tissues; C: The relationship between hnRNPA1-b expression level and clinical stage of CC was analyzed by immunohistochemistry. Scale bar: 100 μm. The arrow indicates positive cells expressing hnRNPA1-b. aP < 0.05, bP < 0.001 vs NCM460 group; cP < 0.05 vs adjacent group; dP < 0.05 vs stage I group; eP < 0.05 vs stage III group; fP > 0.05 vs normal group; gP > 0.05 vs stage II group, n = 3. hnRNPA1: Heterogeneous ribonucleoprotein A1; MOD: Mean optical density.
Figure 2 Heterogeneous ribonucleoprotein A1-b promotes colon cancer cell proliferation.
A: The effect of heterogeneous ribonucleoprotein A1 (hnRNPA1)-b overexpression or silencing on hnRNPA1-b expression was analyzed by quantitative real-time polymerase chain reaction analysis; B: SW620 and HCT116 cells expressing hnRNPA1-b were evaluated using cell counting kit-8 assays to assess cell viability; C: 5-ethynyl-2’-deoxyuridine incorporation assays were performed in hnRNPA1-b overexpressed or hnRNPA1-b silenced SW620 and HCT116 cells. The percentage of proliferating cells (red fluorescence) to total cells (blue fluorescence) was calculated. Scale bar: 100 μm; D and E: Flow cytometry was performed to evaluate the effect of hnRNPA1-b overexpressed or hnRNPA1-b silenced on the cell cycle distribution and apoptosis. aP < 0.05, bP < 0.01, cP < 0.001 vs OE-NC group; dP < 0.05, eP < 0.01, fP < 0.001, ns: P > 0.05 vs si-NC group, n = 3. EdU: 5-ethynyl-2’-deoxyuridine; OE-NC: Overexpression normal control; OE-A1-b: Overexpression of hnRNPA1-b; si-NC: Knock-down normal control; si-RNA2: Knockdown of hnRNPA1-b group 2; si-RNA3: Knockdown of hnRNPA1-b group 3.
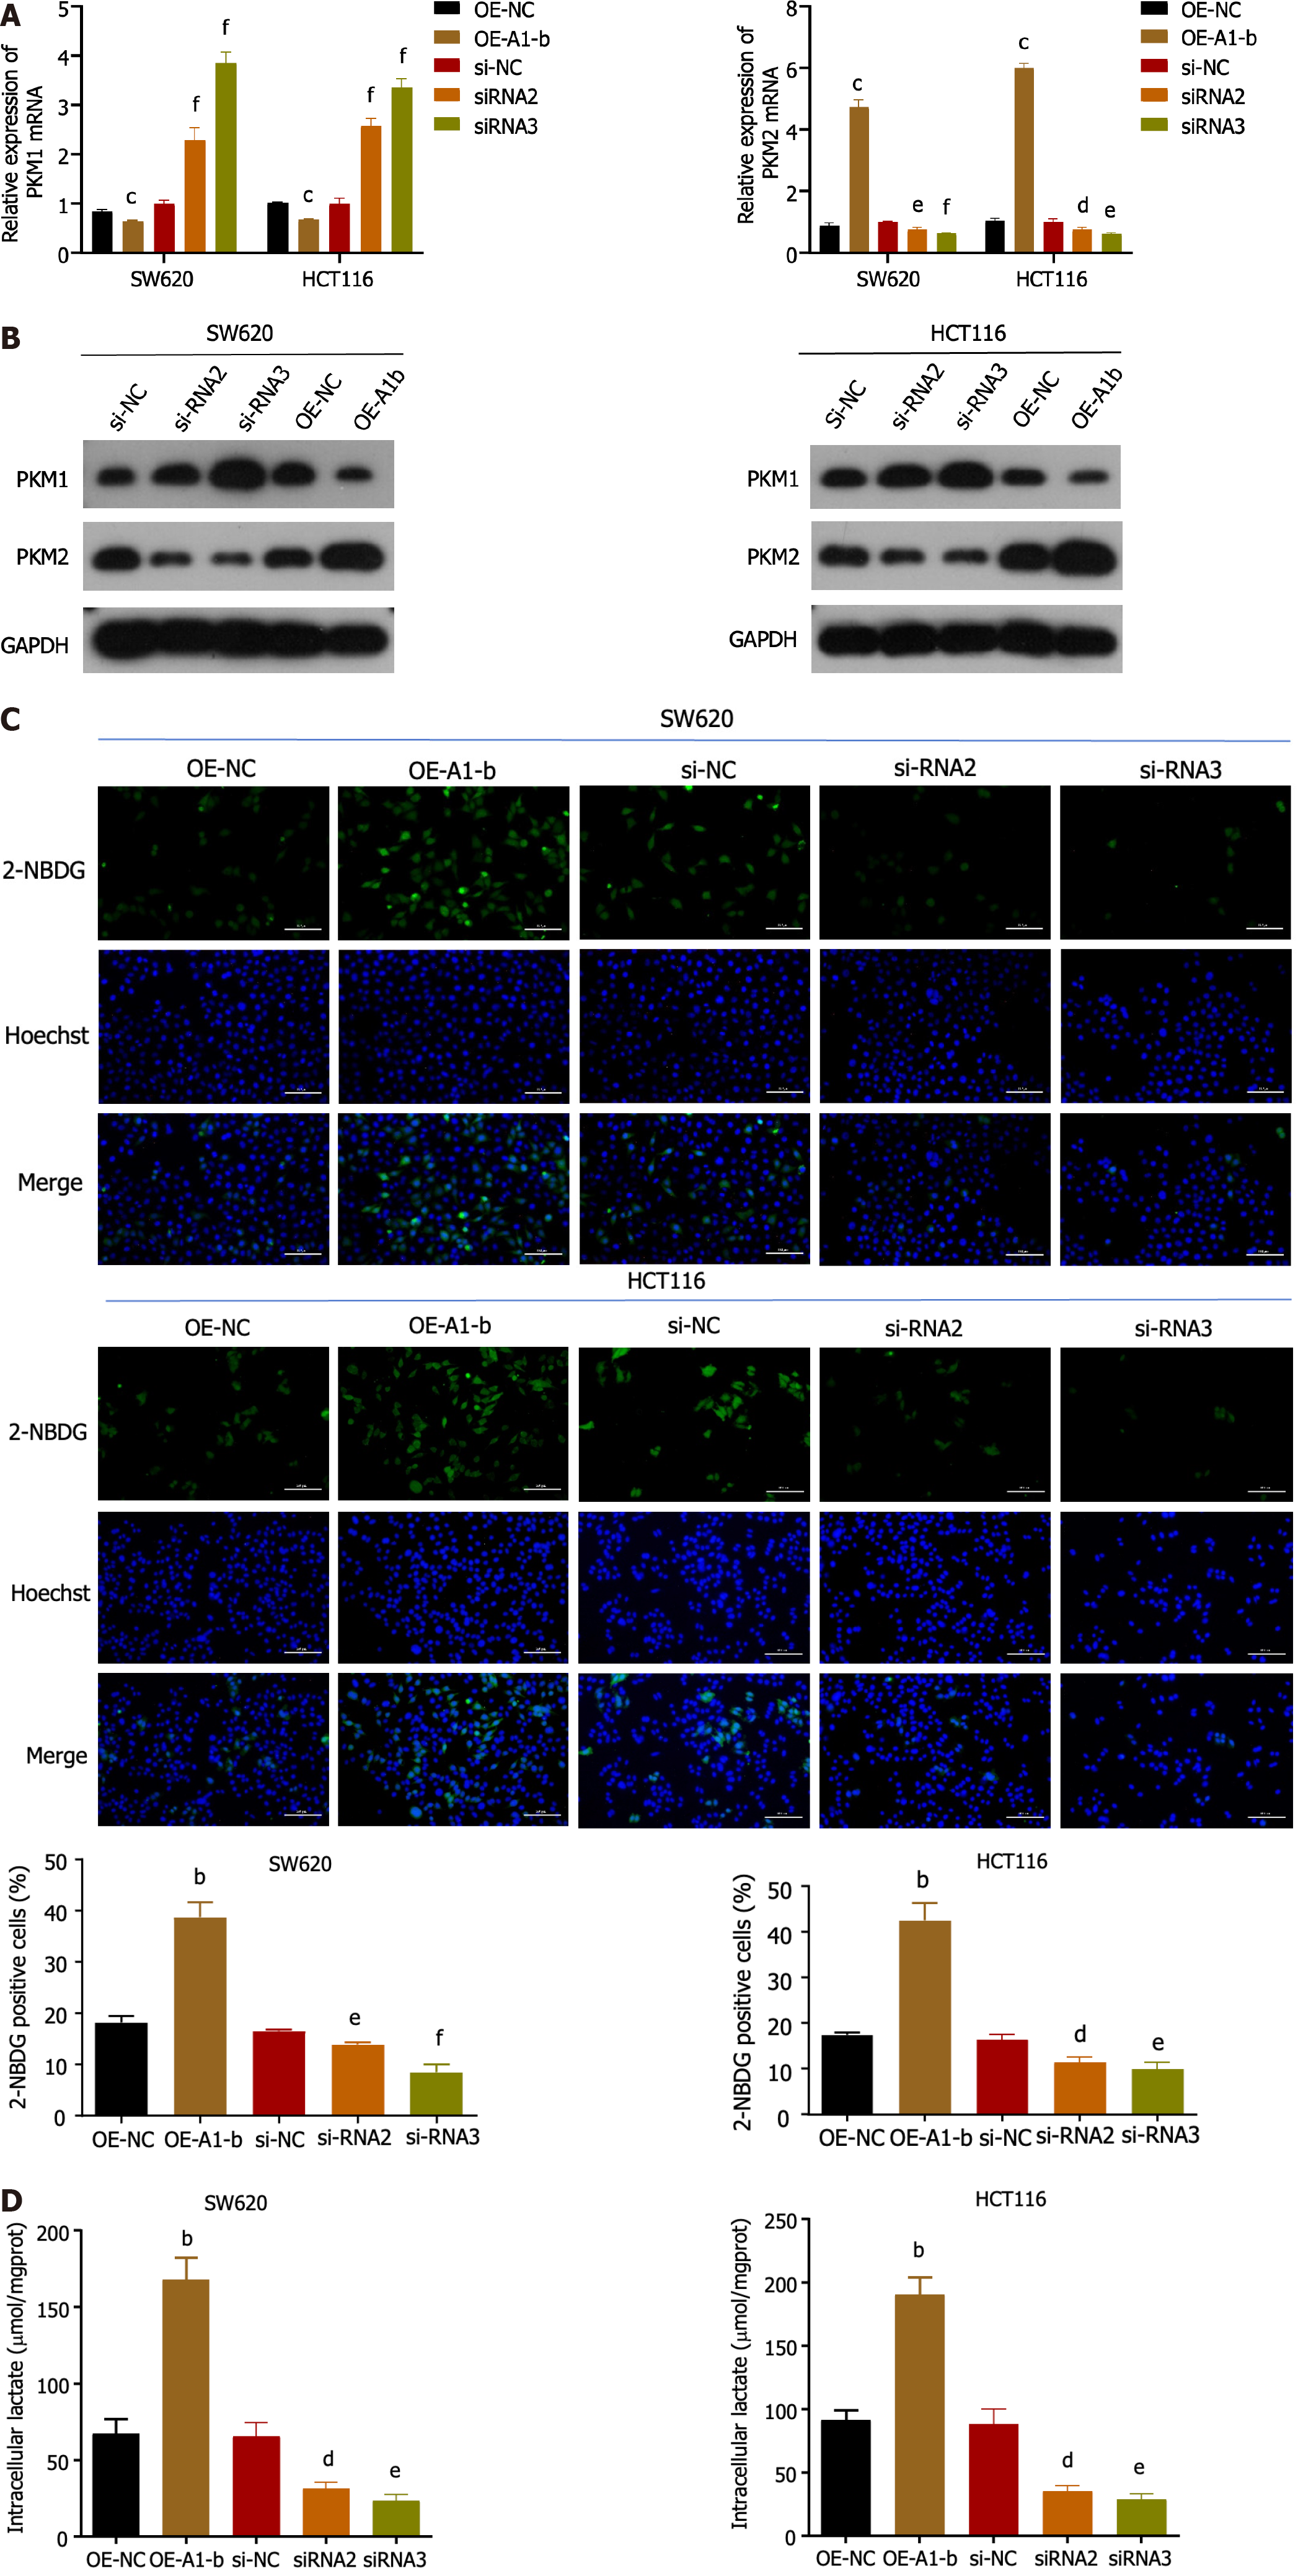
Figure 3 Heterogeneous ribonucleoprotein A1-b enhances the Warburg effect in SW620 and HCT116 cells.
A: Quantitative real-time polymerase chain reaction analysis was performed in SW620 and HCT116 cells transfected with heterogeneous ribonucleoprotein A1 (hnRNPA1)-b overexpression or hnRNPA1-b silenced to detect PKM1 and PKM2 expression; B: SW620 and HCT116 cells were transfected with hnRNPA1-b overexpressed plasmid or hnRNPA1-b interfering sequence and the expression of PKM1 and PKM2 was detected by western blot. GAPDH was used as the internal reference; C and D: SW620 and HCT116 cells were transfected with control or hnRNPA1 overexpression plasmid or silenced hnRNPA1-b for 48 h. Then glucose uptake and lactate production were measured. Scale bar: 100 μm. bP < 0.01, cP < 0.001 vs OE-NC group; dP < 0.05, eP < 0.01, fP < 0.001 vs si-NC group, n = 3. OE-NC: Overexpression normal control; OE-A1-b: Overexpression of hnRNPA1-b; si-NC: Knock-down normal control; si-RNA2: Knockdown of hnRNPA1-b group 2; si-RNA3: Knockdown of hnRNPA1-b group 3.
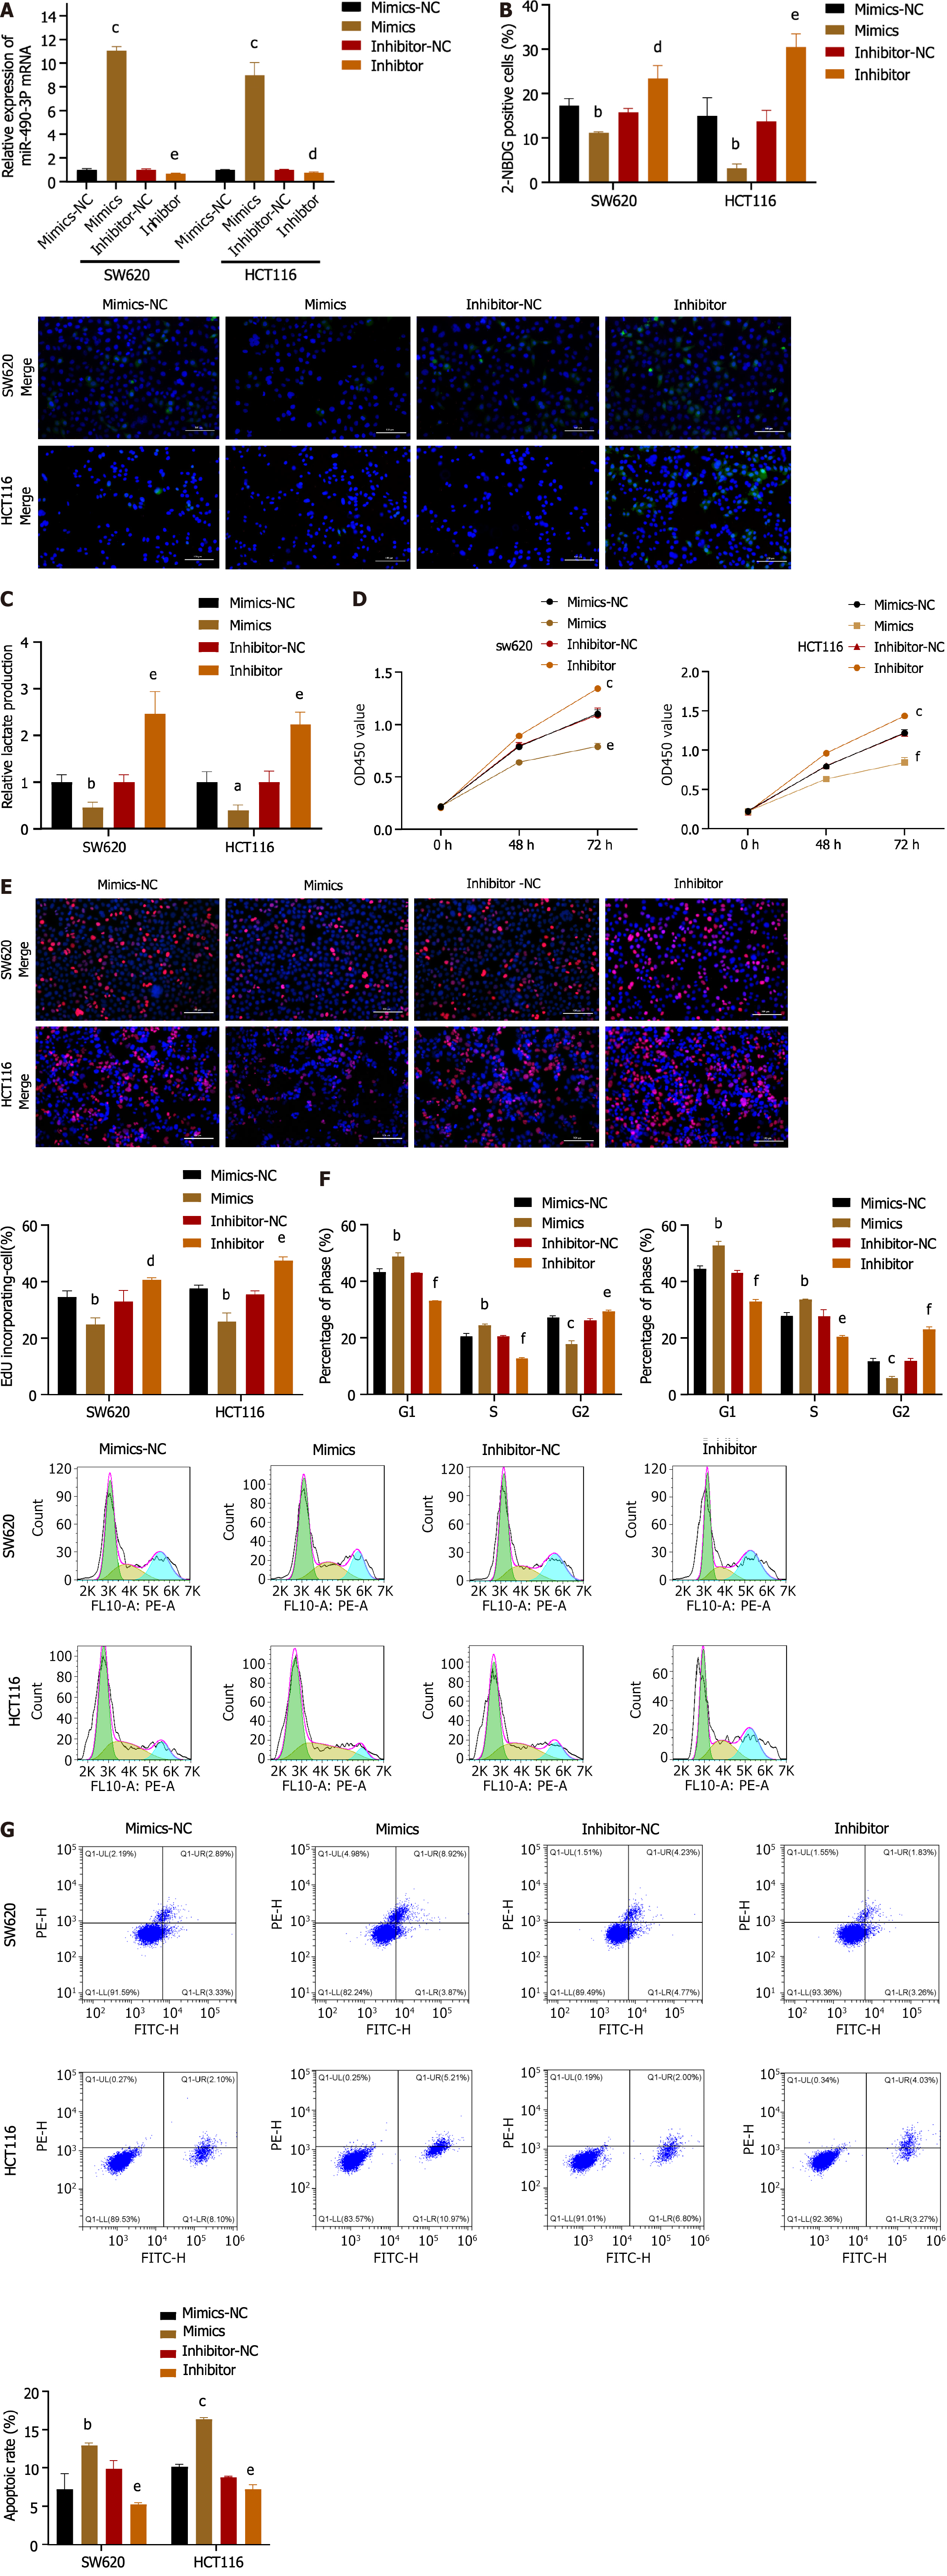
Figure 4 MiR-490-3P attenuates the Warburg effect and inhibits colon cancer cell proliferation.
A: The effect of miR-490-3P mimics or inhibitor on miR-490-3P expression was analyzed through quantitative real-time polymerase chain reaction analysis; B and C: SW620 and HCT116 cells were transfected with miR-490-3P control or mimics or inhibitor for 48 h. Then glucose uptake and lactate production were measured. Scale bar: 100 μm; D: The viability of SW620 and HCT116 cells transfected with miR-490-3P mimetics or inhibitors was evaluated using the cell counting kit-8 detection method; E: 5-ethynyl-2’-deoxyuridine incorporation assays were performed in SW620 and HCT116 cells with miR-490-3P mimics or inhibitor. The percentage of proliferating cells (red fluorescence) to total cells (blue fluorescence) was calculated. Scale bar: 100 μm; F and G: Flow cytometry was performed to evaluate the effect of miR-490-3P mimics or inhibitor on the cell cycle distribution and apoptosis. aP < 0.05, bP < 0.01, cP < 0.001 vs mimics-NC group; dP < 0.05, eP < 0.01, fP < 0.001 vs inhibitor-NC group, n = 3. NC: Normal control.
Figure 5 MiR-490-3p could target binding to heterogeneous ribonucleoprotein A1-b and inhibit the Warburg effect to attenuate colon cancer cell proliferation.
A: The binding sites of miR-490-3P and heterogeneous ribonucleoprotein A1 (hnRNPA1) were predicted using TargetScan; B: The wild-type (WT) and mutant type (MUT) hnRNPA1-b 3’ untranslated region reporter plasmids were co-transfected with miR-490-3P control or mimics in HEK-293T cells; C: Quantitative real-time polymerase chain reaction analysis was performed to analyze hnRNPA1-b, PKM1 and PKM2 expression in SW620 and HCT116 cells transfected with miR-490-3P control or mimics or inhibitor; D and E: SW620 and HCT116 cells were transfected with miR-490-3P control or mimics or in combination of hnRNPA1-b overexpression plasmid for 48 h. Then glucose uptake and lactate production were evaluated. Scale bar: 100 μm; F: Cell viability of SW620 and HCT116 cells transfected with miR-490-3P control or mimic or conjugated with hnRNPA1-b overexpression plasmid for 72 h was detected by the cell counting kit-8 assay; G: 5-ethynyl-2’-deoxyuridine incorporation assays were performed using SW620 and HCT116 cells with miR-490-3P control or mimics or in combination with hnRNPA1-b overexpression plasmid. The percentage of proliferating cells (red fluorescence) to total cells (blue fluorescence) was calculated. Scale bar: 100 μm; H and I: Flow cytometry was performed to evaluate the effect of miR-490-3P control or mimics or in combination with hnRNPA1-b overexpression plasmid on the cell cycle distribution and apoptosis. aP < 0.001 vs miR-NC + HNRNPA1-B-WT; bP < 0.01 vs miR-NC + HNRNPA1-B-MUT1; cP < 0.01 vs miR-NC + HNRNPA1-B-MUT2; ns: P > 0.05 vs miR-NC + HNRNPA1-B-MUT3; dP < 0.05, eP < 0.01, fP < 0.001 vs mimics-NC; gP < 0.001 vs inhibitor-NC; hP < 0.01, iP < 0.001 vs mimics, n = 3. NC: Normal control; OE-A1-b: Overexpression of hnRNPA1-b.
Figure 6 Heterogeneous ribonucleoprotein A1-b promotes SW620 and HCT116 cells proliferation by enhancing the Warburg effect through the PI3K/AKT pathway.
A: The p-AKT expression level after the addition of PI3K/AKT pathway blocker Ly294002 was verified via western blot. GAPDH was used as the internal reference; B and C: SW620 and HCT116 cells were transfected with control or heterogeneous ribonucleoprotein A1 (hnRNPA1) overexpression plasmid or pathway blocker Ly294002 for 48 h. Then glucose uptake and lactate production were measured. Scale bar: 100 μm; D: SW620 and HCT116 cells with the addition of Ly294002 were assessed for cell viability by the cell counting kit-8 assay; E: 5-ethynyl-2’-deoxyuridine incorporation assays were performed in control or hnRNPA1-b overexpression or Ly294002 supplementation in SW620 and HCT116 cells. The percentage of proliferating cells (red fluorescence) to total cells (blue fluorescence) was calculated. Scale bar, 100 μm. aP < 0.05, bP < 0.01, cP < 0.001 vs OE-NC; dP < 0.05, eP < 0.01, fP < 0.001 vs OE-NC + ly294002, n = 3. OE-NC: Overexpression normal control; OE-A1-b: Overexpression of hnRNPA1-b.
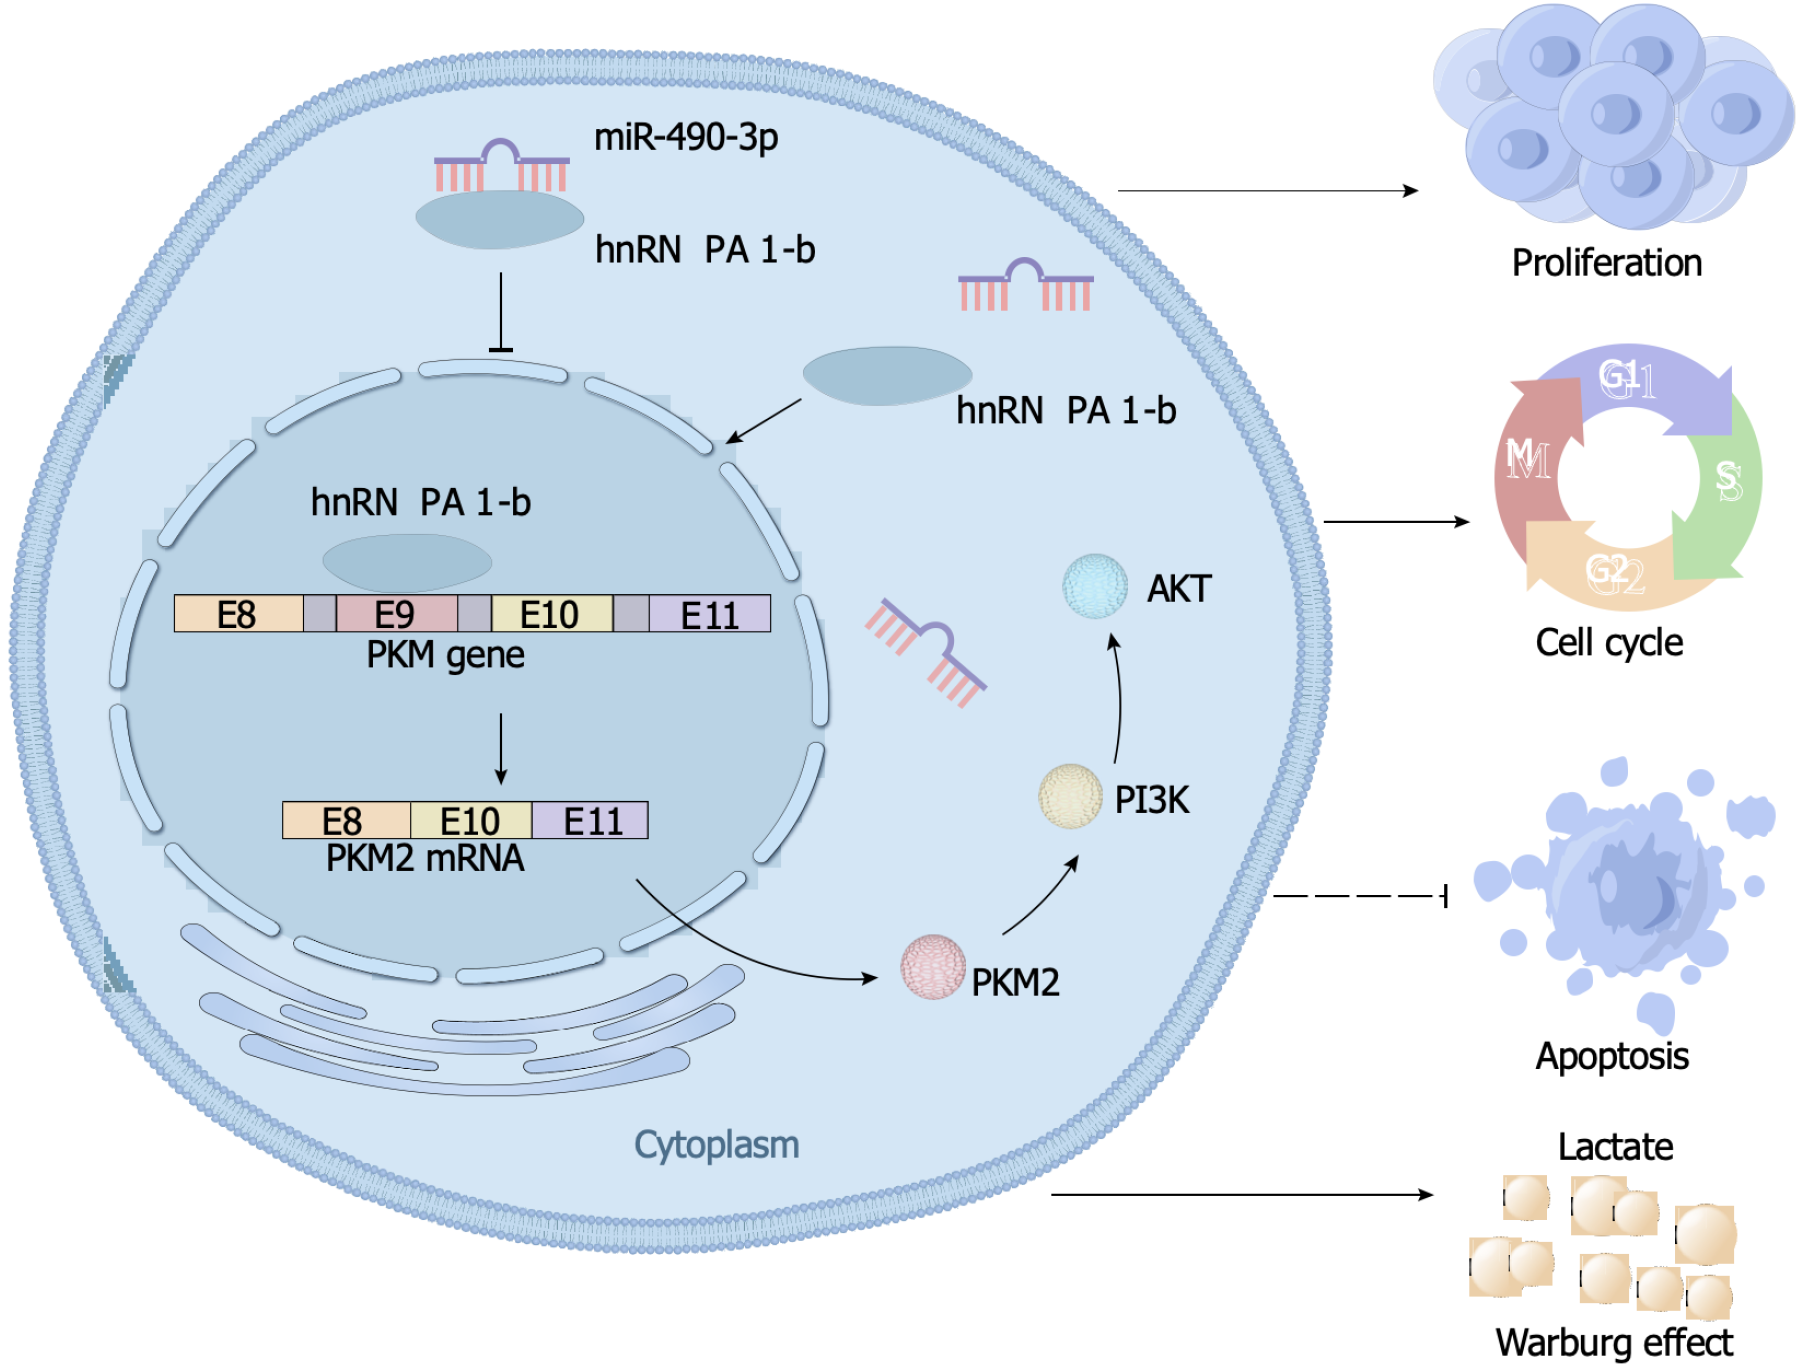
Figure 7 Schematic model illustrates the biological role of the miR-490-3p/heterogeneous ribonucleoprotein A1-b/PKM2 axis in colon cancer progression.
The schematic shows that heterogeneous ribonucleoprotein A1 hnRNPA1-b promotes the selective expression of PKM2, enhances the Warburg effect through PI3K/AKT pathway, facilitates the proliferation and division of colon cancer (CC) cells, and hinders the apoptosis of CC cells. However, when miR-490-3p binds to hnRNPA1-b, it exerts an inhibitory effect on the aforementioned biological processes. hnRNPA1: Heterogeneous ribonucleoprotein A1.
- Citation: Wan XH, Jin GB, Yang Q, Hu JL, Liu ZL, Rao J, Wen C, Li PL, Yang XM, Huang B, Wang XZ. Novel miR-490-3p/hnRNPA1-b/PKM2 axis mediates the Warburg effect and proliferation of colon cancer cells via the PI3K/AKT pathway. World J Gastrointest Oncol 2024; 16(5): 2038-2059
- URL: https://www.wjgnet.com/1948-5204/full/v16/i5/2038.htm
- DOI: https://dx.doi.org/10.4251/wjgo.v16.i5.2038


