Copyright
©The Author(s) 2024.
World J Gastrointest Oncol. May 15, 2024; 16(5): 2018-2037
Published online May 15, 2024. doi: 10.4251/wjgo.v16.i5.2018
Published online May 15, 2024. doi: 10.4251/wjgo.v16.i5.2018
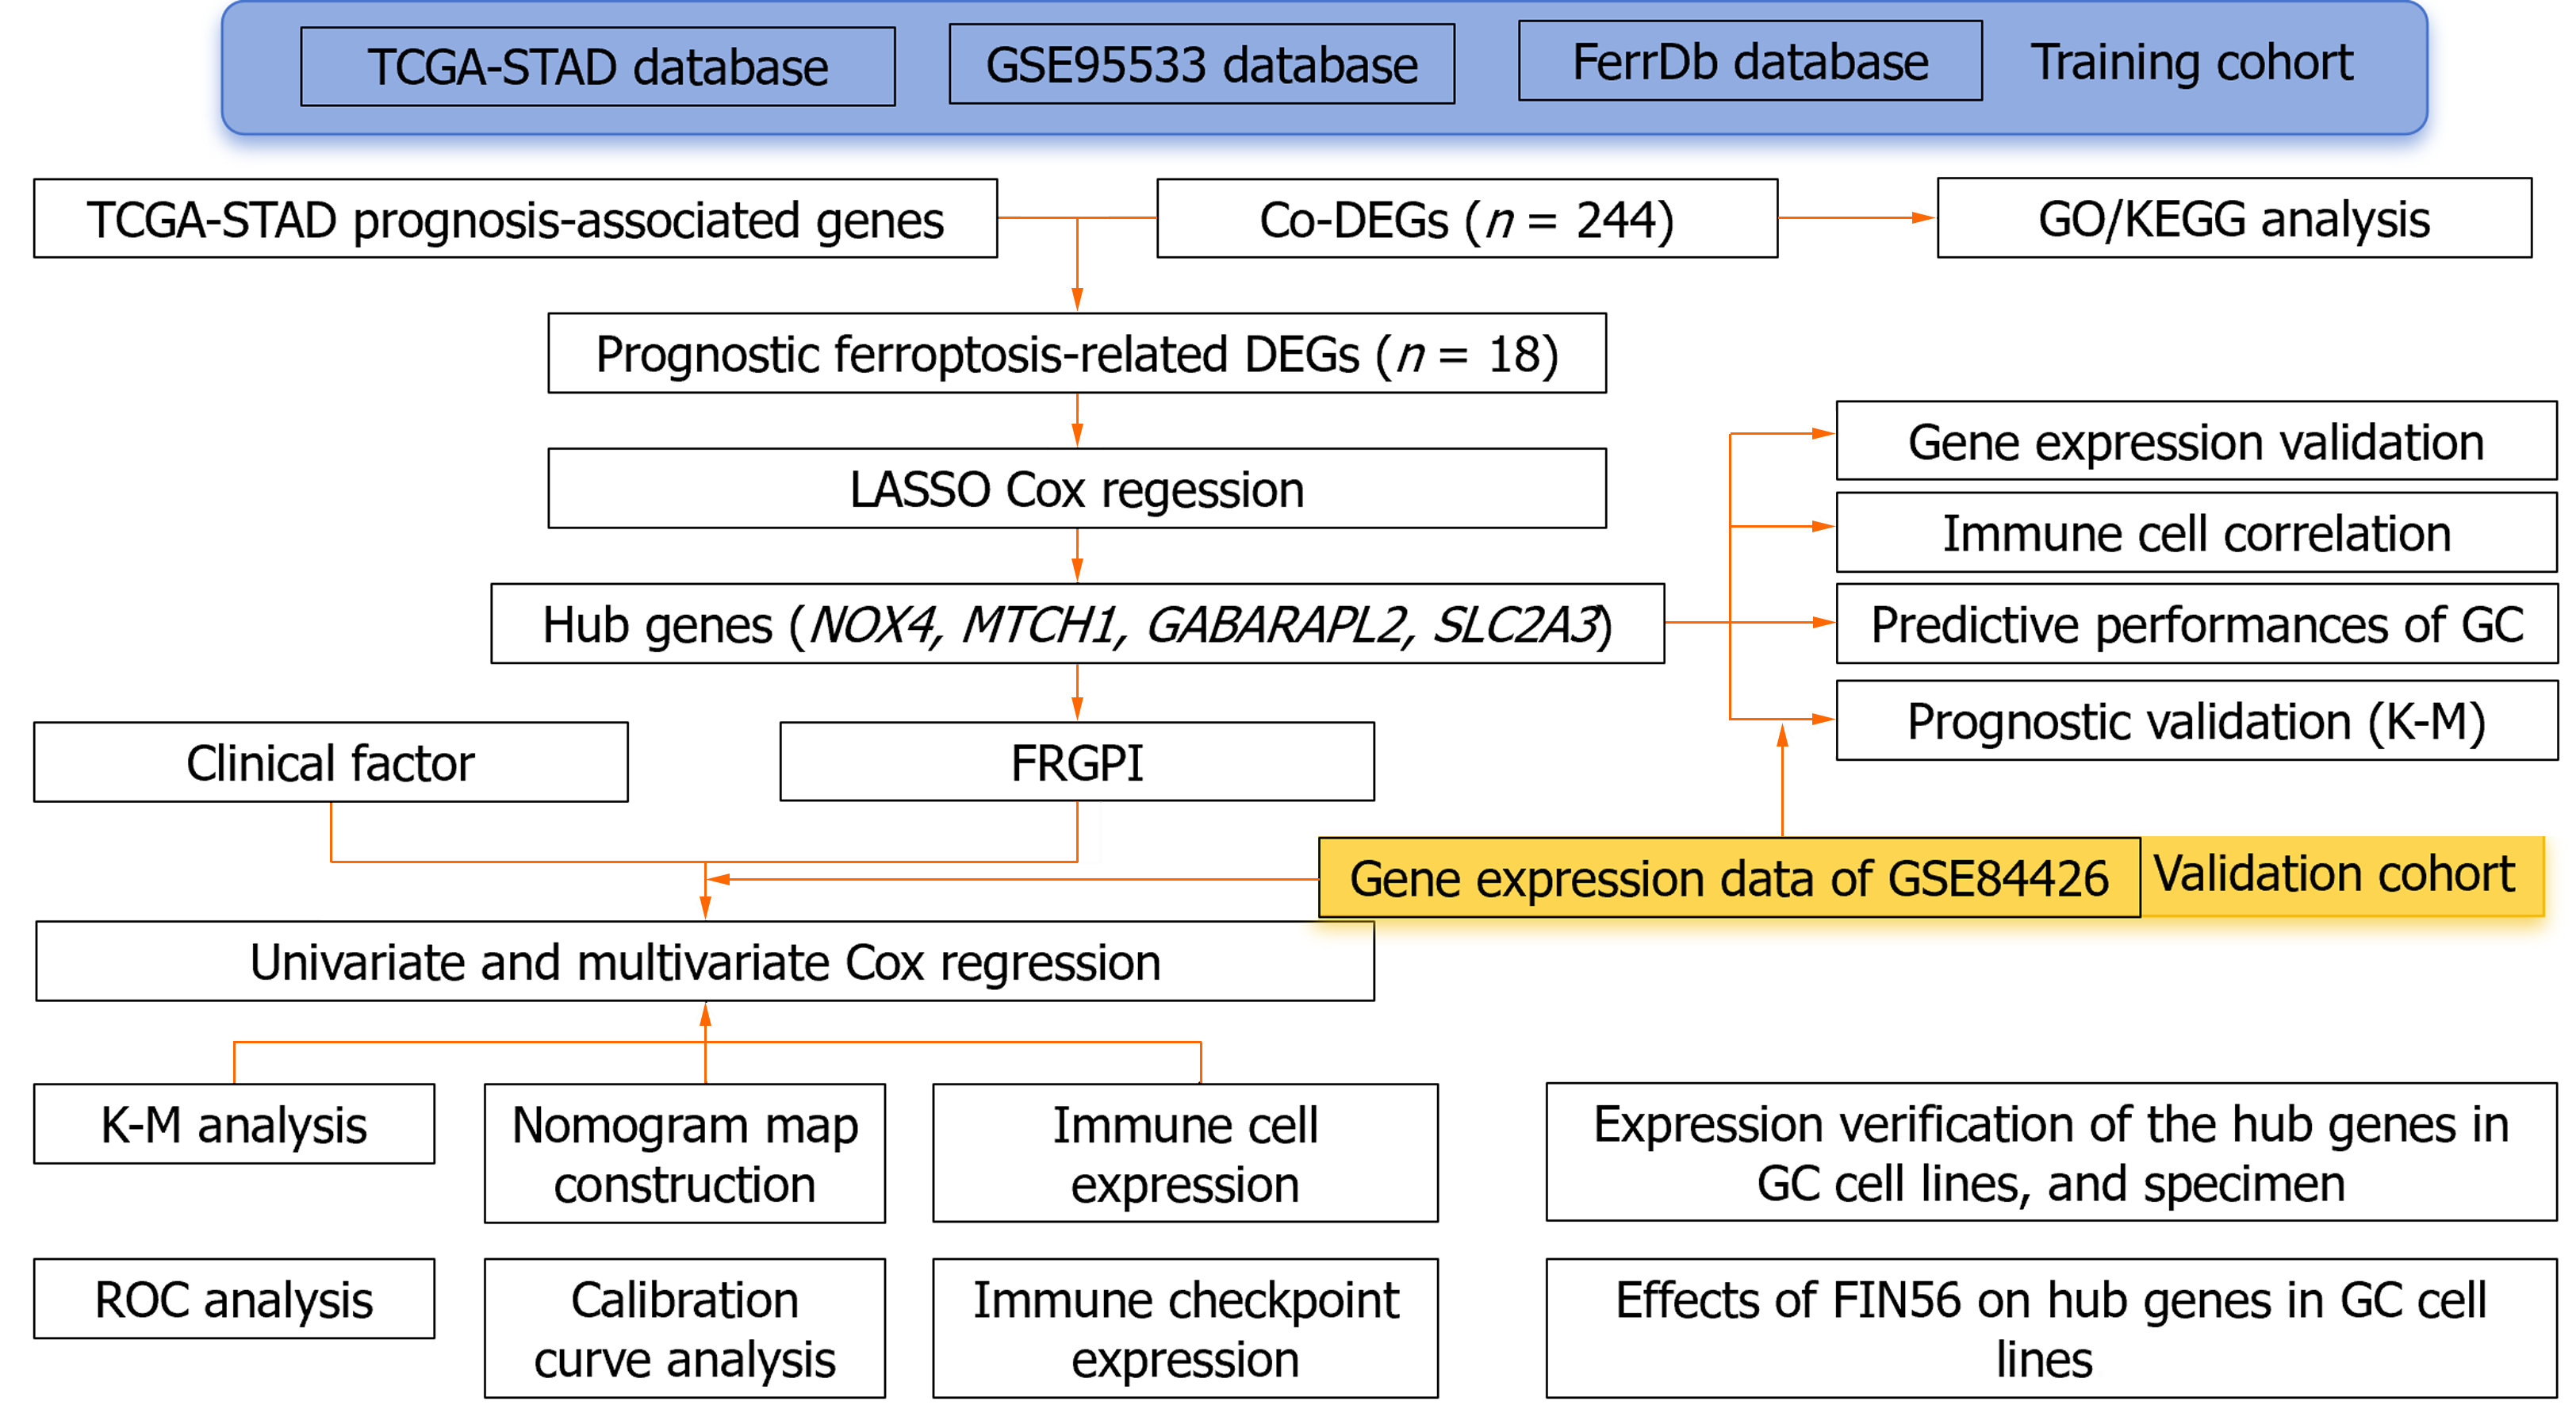
Figure 1 Flow diagram of data collection and analysis.
Co-DEGs: Co-regulated differentially expressed genes; FRGPI: Ferroptosis-related genes prognostic index; GC: Gastric cancer; ROS: Reactive oxygen species; LASSO: Least absolute shrinkage and selection operator; TCGA: The cancer genome atlas.
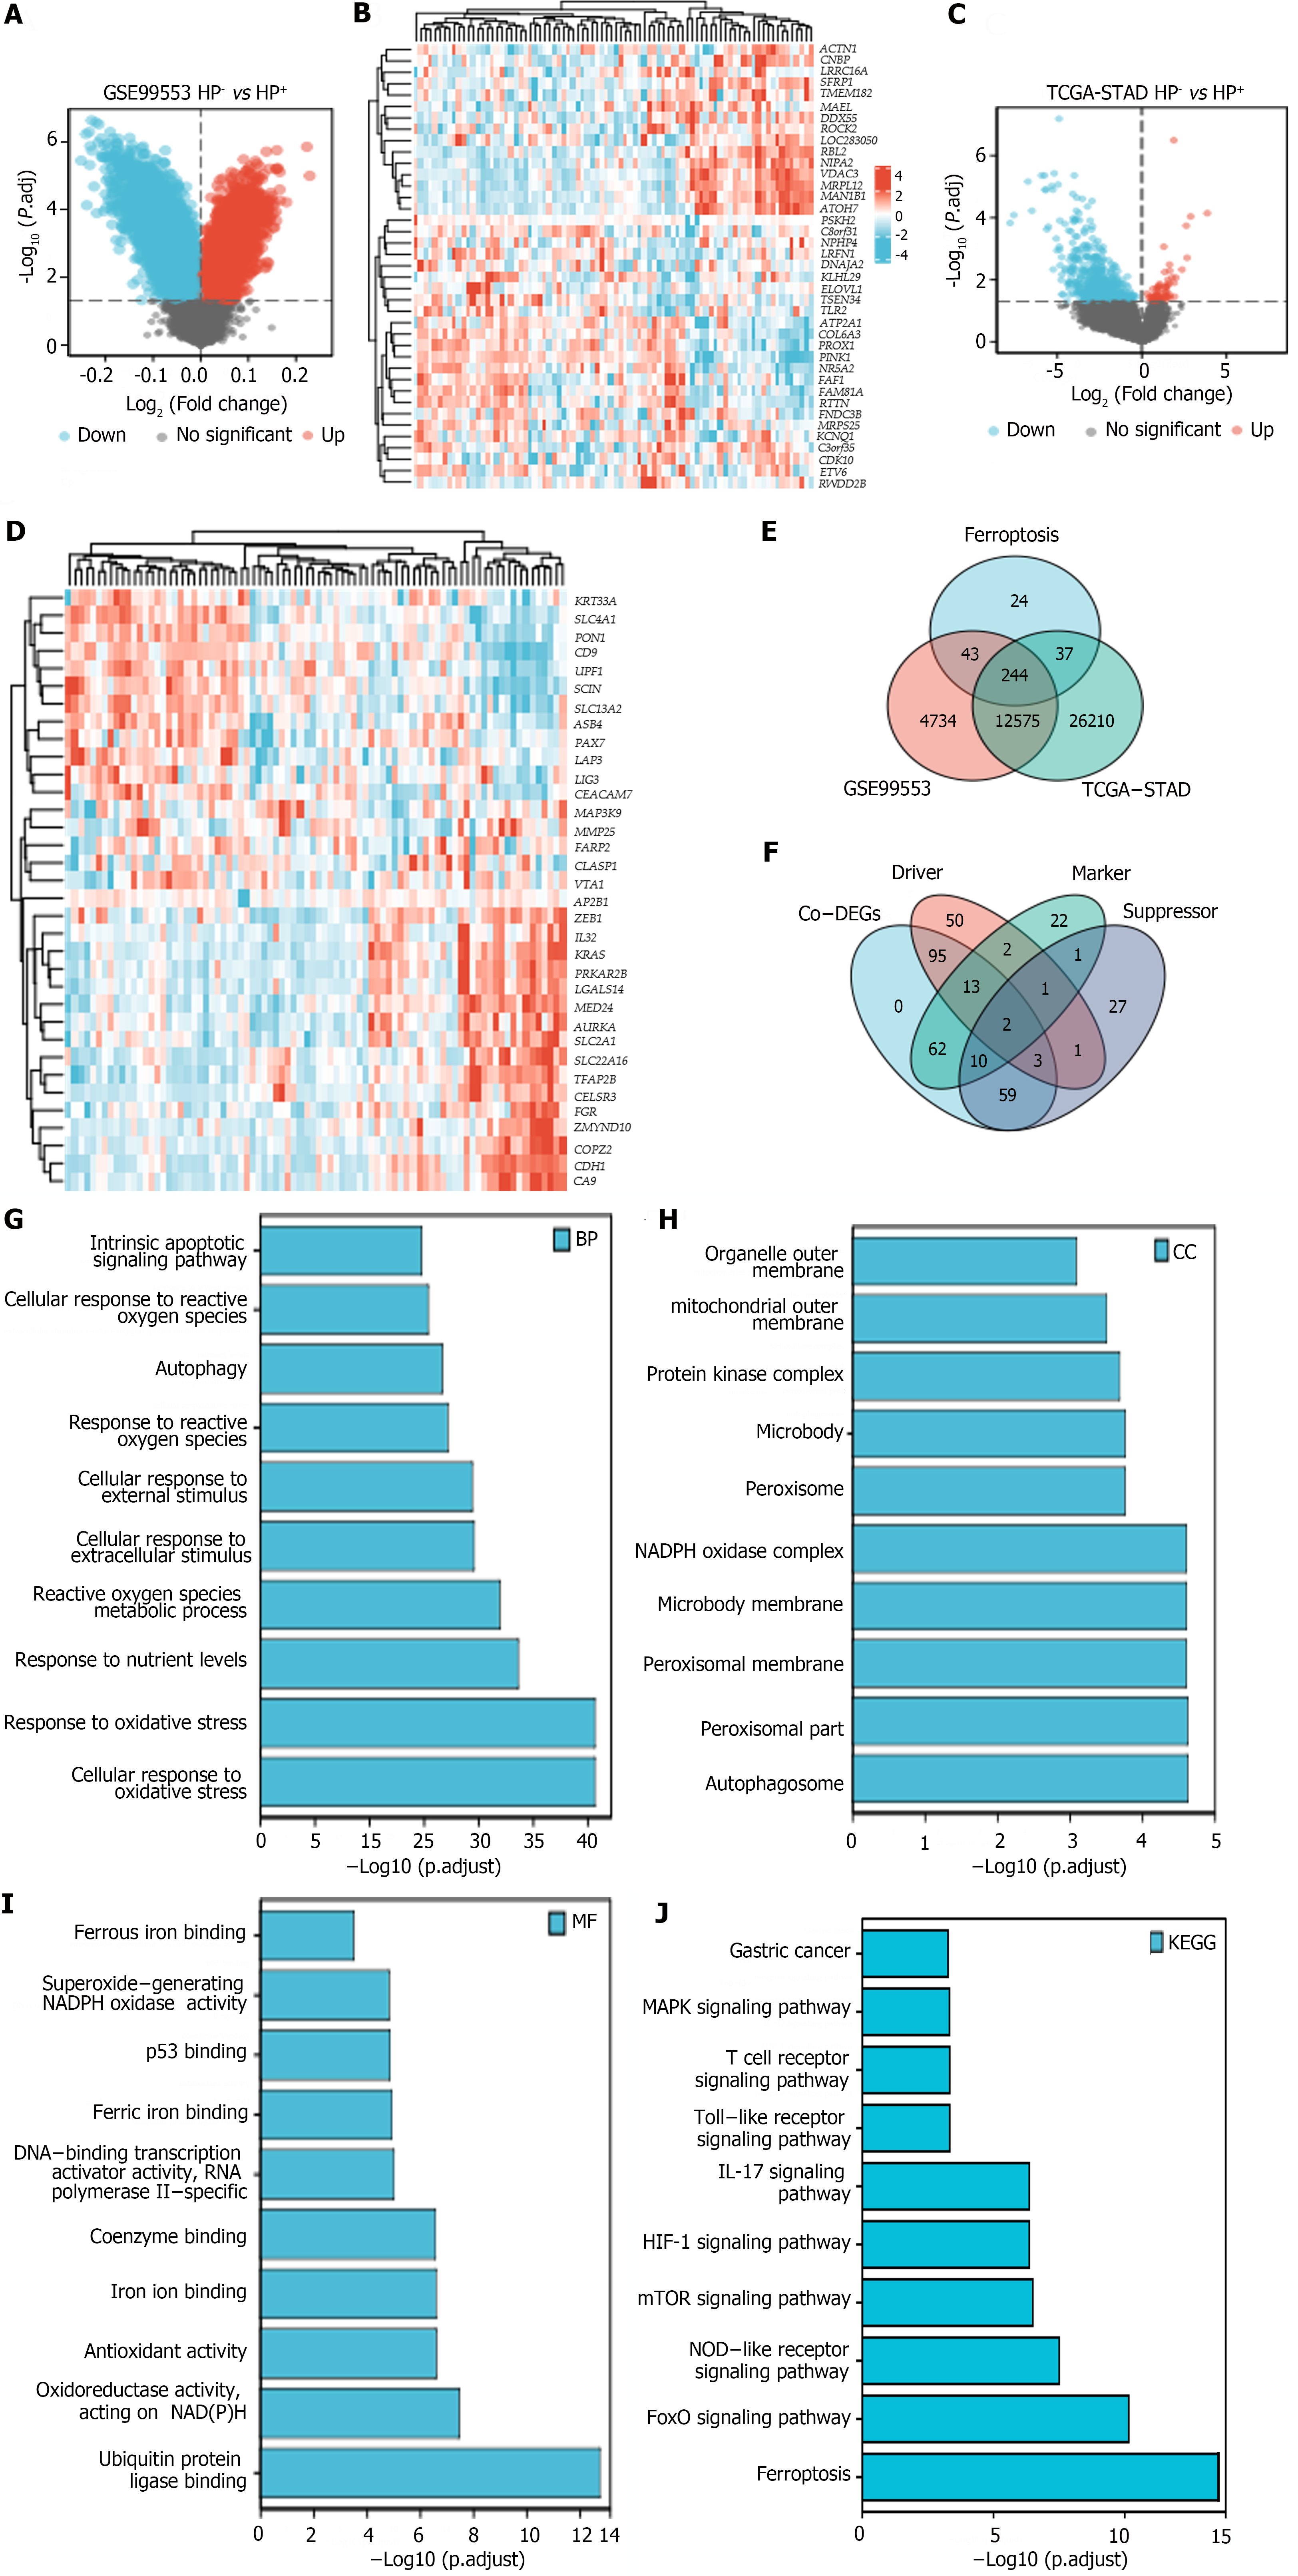
Figure 2 Identification of co-regulated differentially expressed genes and GO and KEGG analyses.
A: Differential gene expression map in GSE99553; B: Heatmap of differentially expressed genes in GSE99553; C: Differential gene expression map in the cancer genome atlas of stomach adenocarcinoma (TCGA-STAD) cohort; D: Heatmap of differentially expressed genes in the TCGA-STAD cohort; E and F: Overlapping differentially expressed genes in TCGA-STAD and GSE99553 related to ferroptosis; G-J: GO and KEGG analysis results of the Co-DEGs. NADPH: Nicotinamide adenine dinucleotide phosphate; MAPK: Mitogen-activated protein kinase; HIF-1: Hypoxia-inducible factor; IL-17: Interleukin-17; FoxO: Forkhead box O; NOD: Nucleotide-binding oligomerization domain; TCGA-STAD: The cancer genome atlas of stomach adenocarcinoma; Co-DEGs: Co-regulated differentially expressed genes.
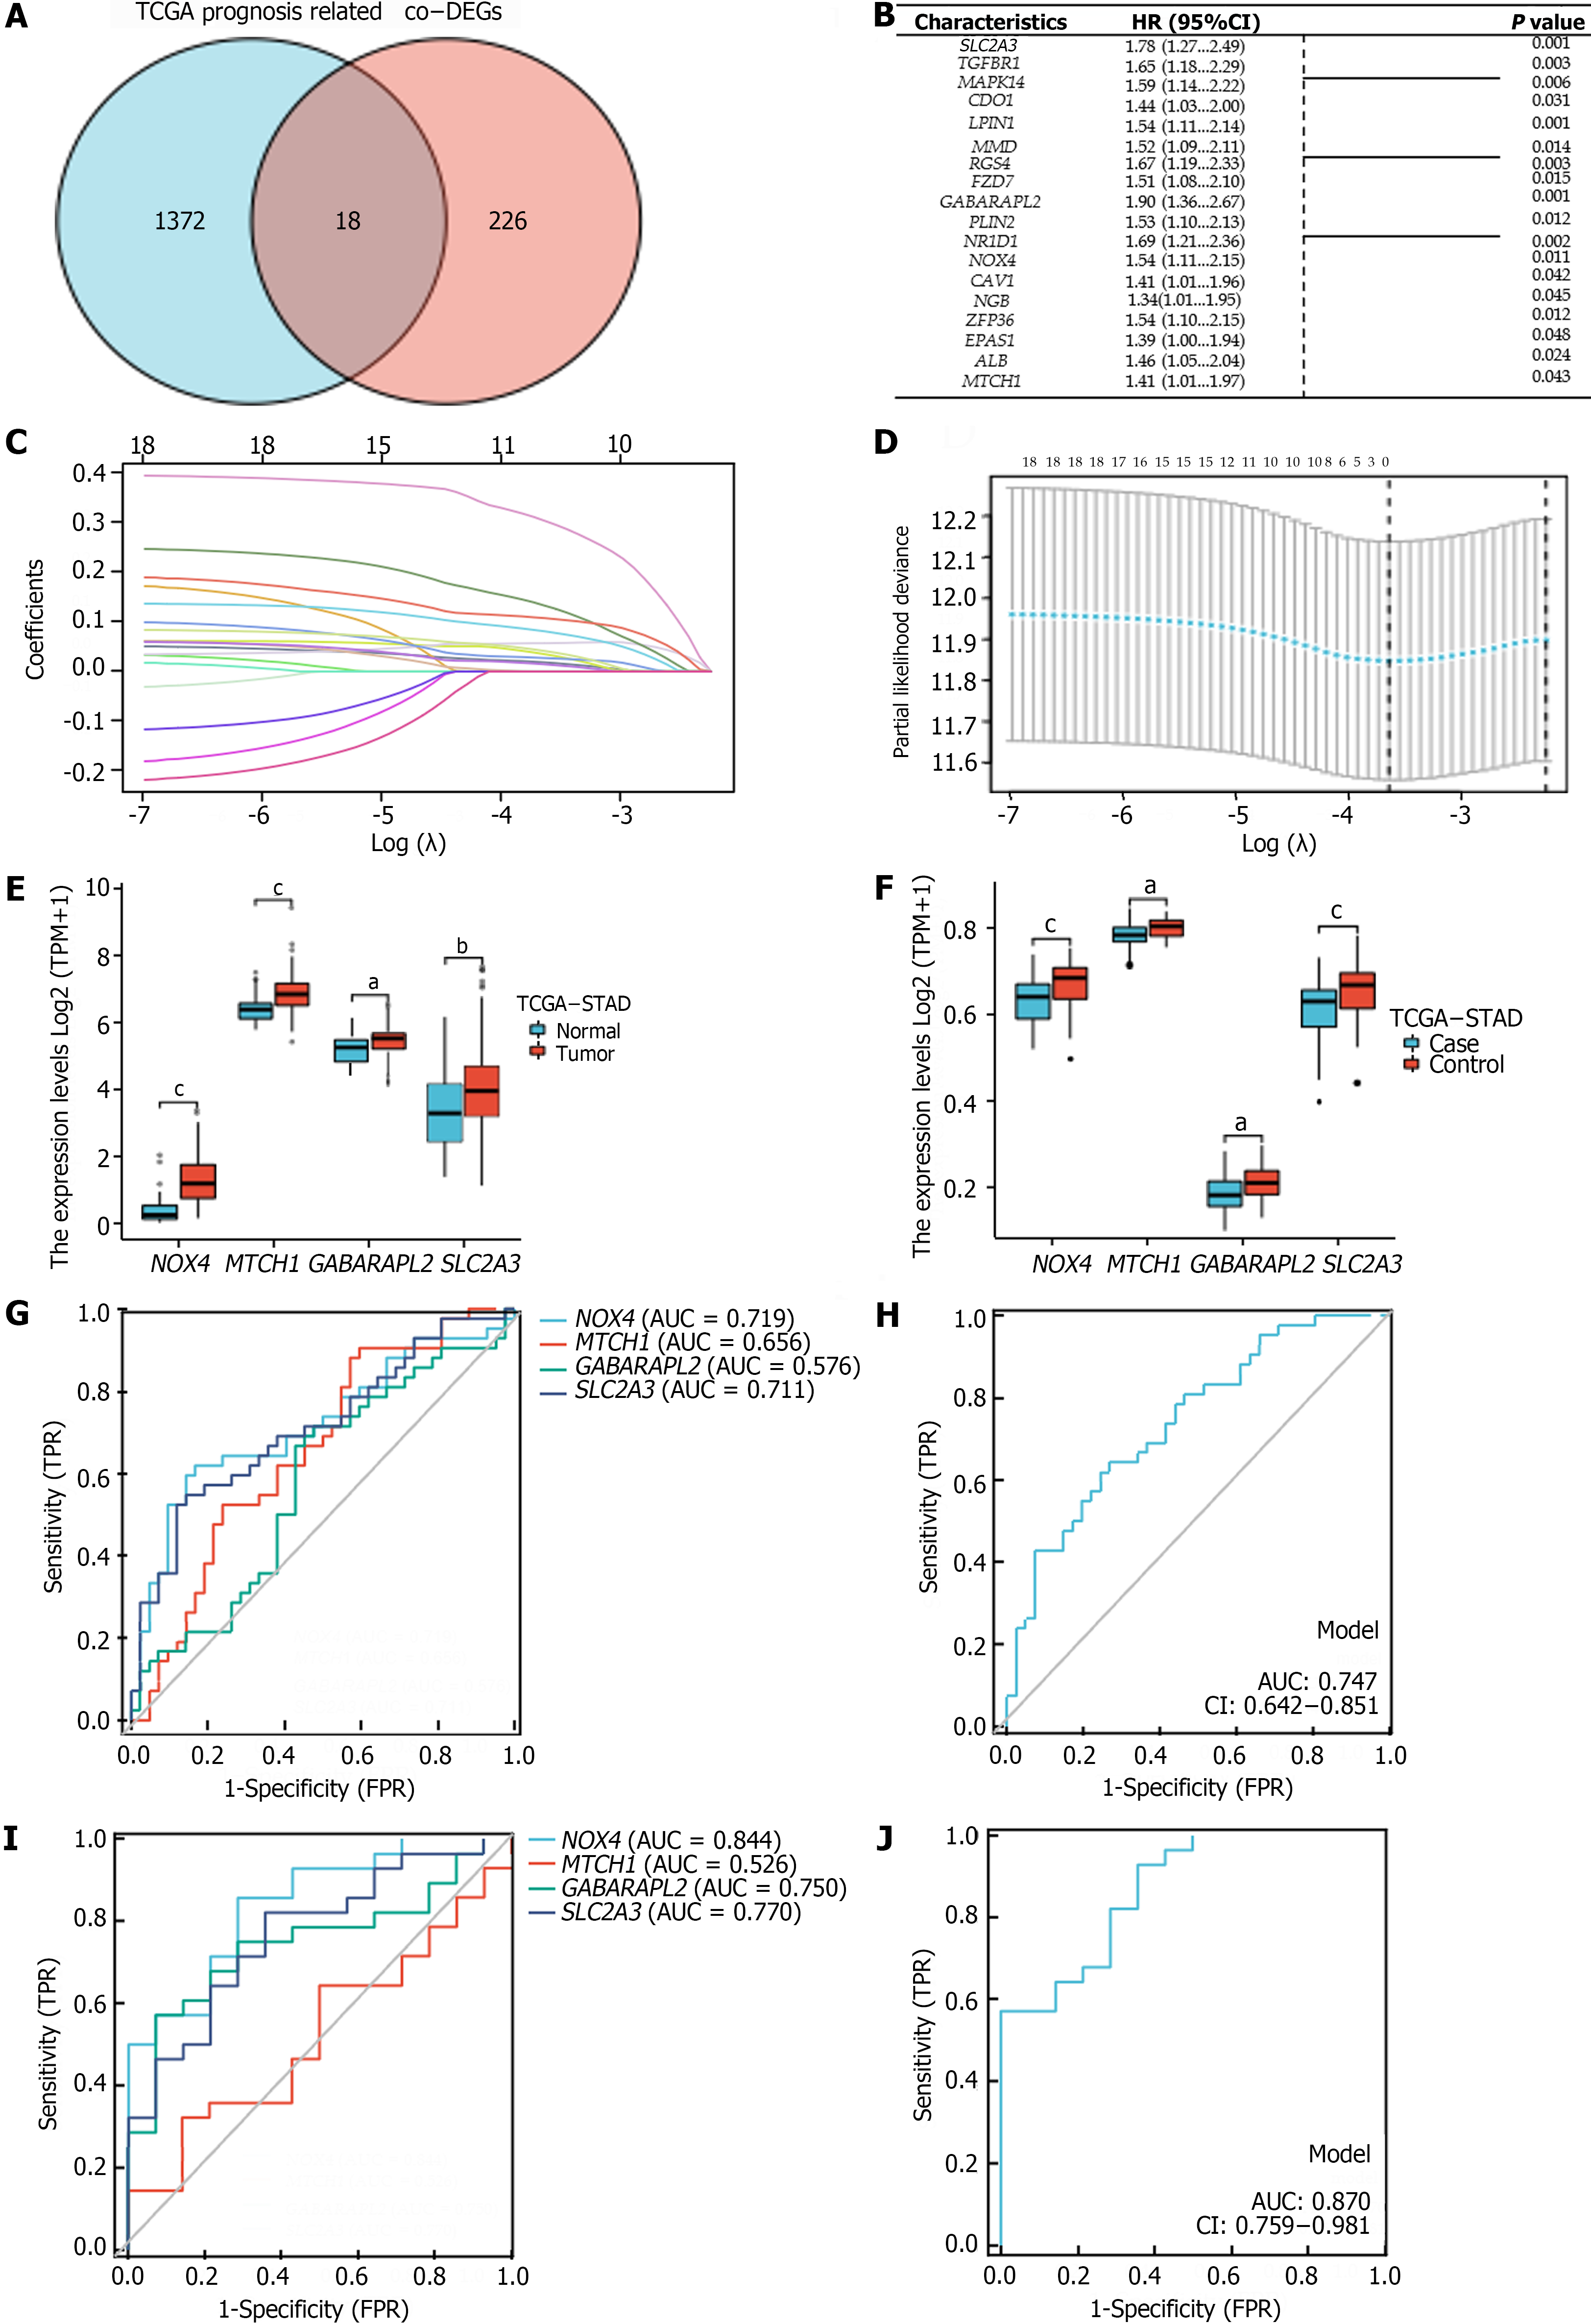
Figure 3 Construction of the ferroptosis-related genes prognostic index and its value in predicting gastric cancer.
A: Overlap of differentially expressed genes and prognostic genes; B: Forest plot showing the multivariate Cox model results for the Co-regulated differentially expressed genes; C and D: LASSO analysis of related genes; E: Expression of hub genes in gastric cancer (GC) and normal tissues (The Cancer Genome Atlas); F: Expression of hub genes in GC and normal tissues (GSE99553); G: Receiver operating characteristic curves (ROC) of hub genes for predicting GC (GSE99553); H: H: ROC curves of hub genes combined detection for predicting GC (GSE99553); I: ROC curve of hub genes for predicting H. pylori infection-related GC (GSE99553); J: ROC curve of hub genes combined detection for predicting H. pylori infection-related GC (GSE99553). aP < 0.05, bP < 0.01, cP < 0.001. TCGA-STAD: The cancer genome atlas of stomach adenocarcinoma; AUC: Areas under the curve; FPR: False positive rate; HR: Hazard ratio; TPR: True positive rate.
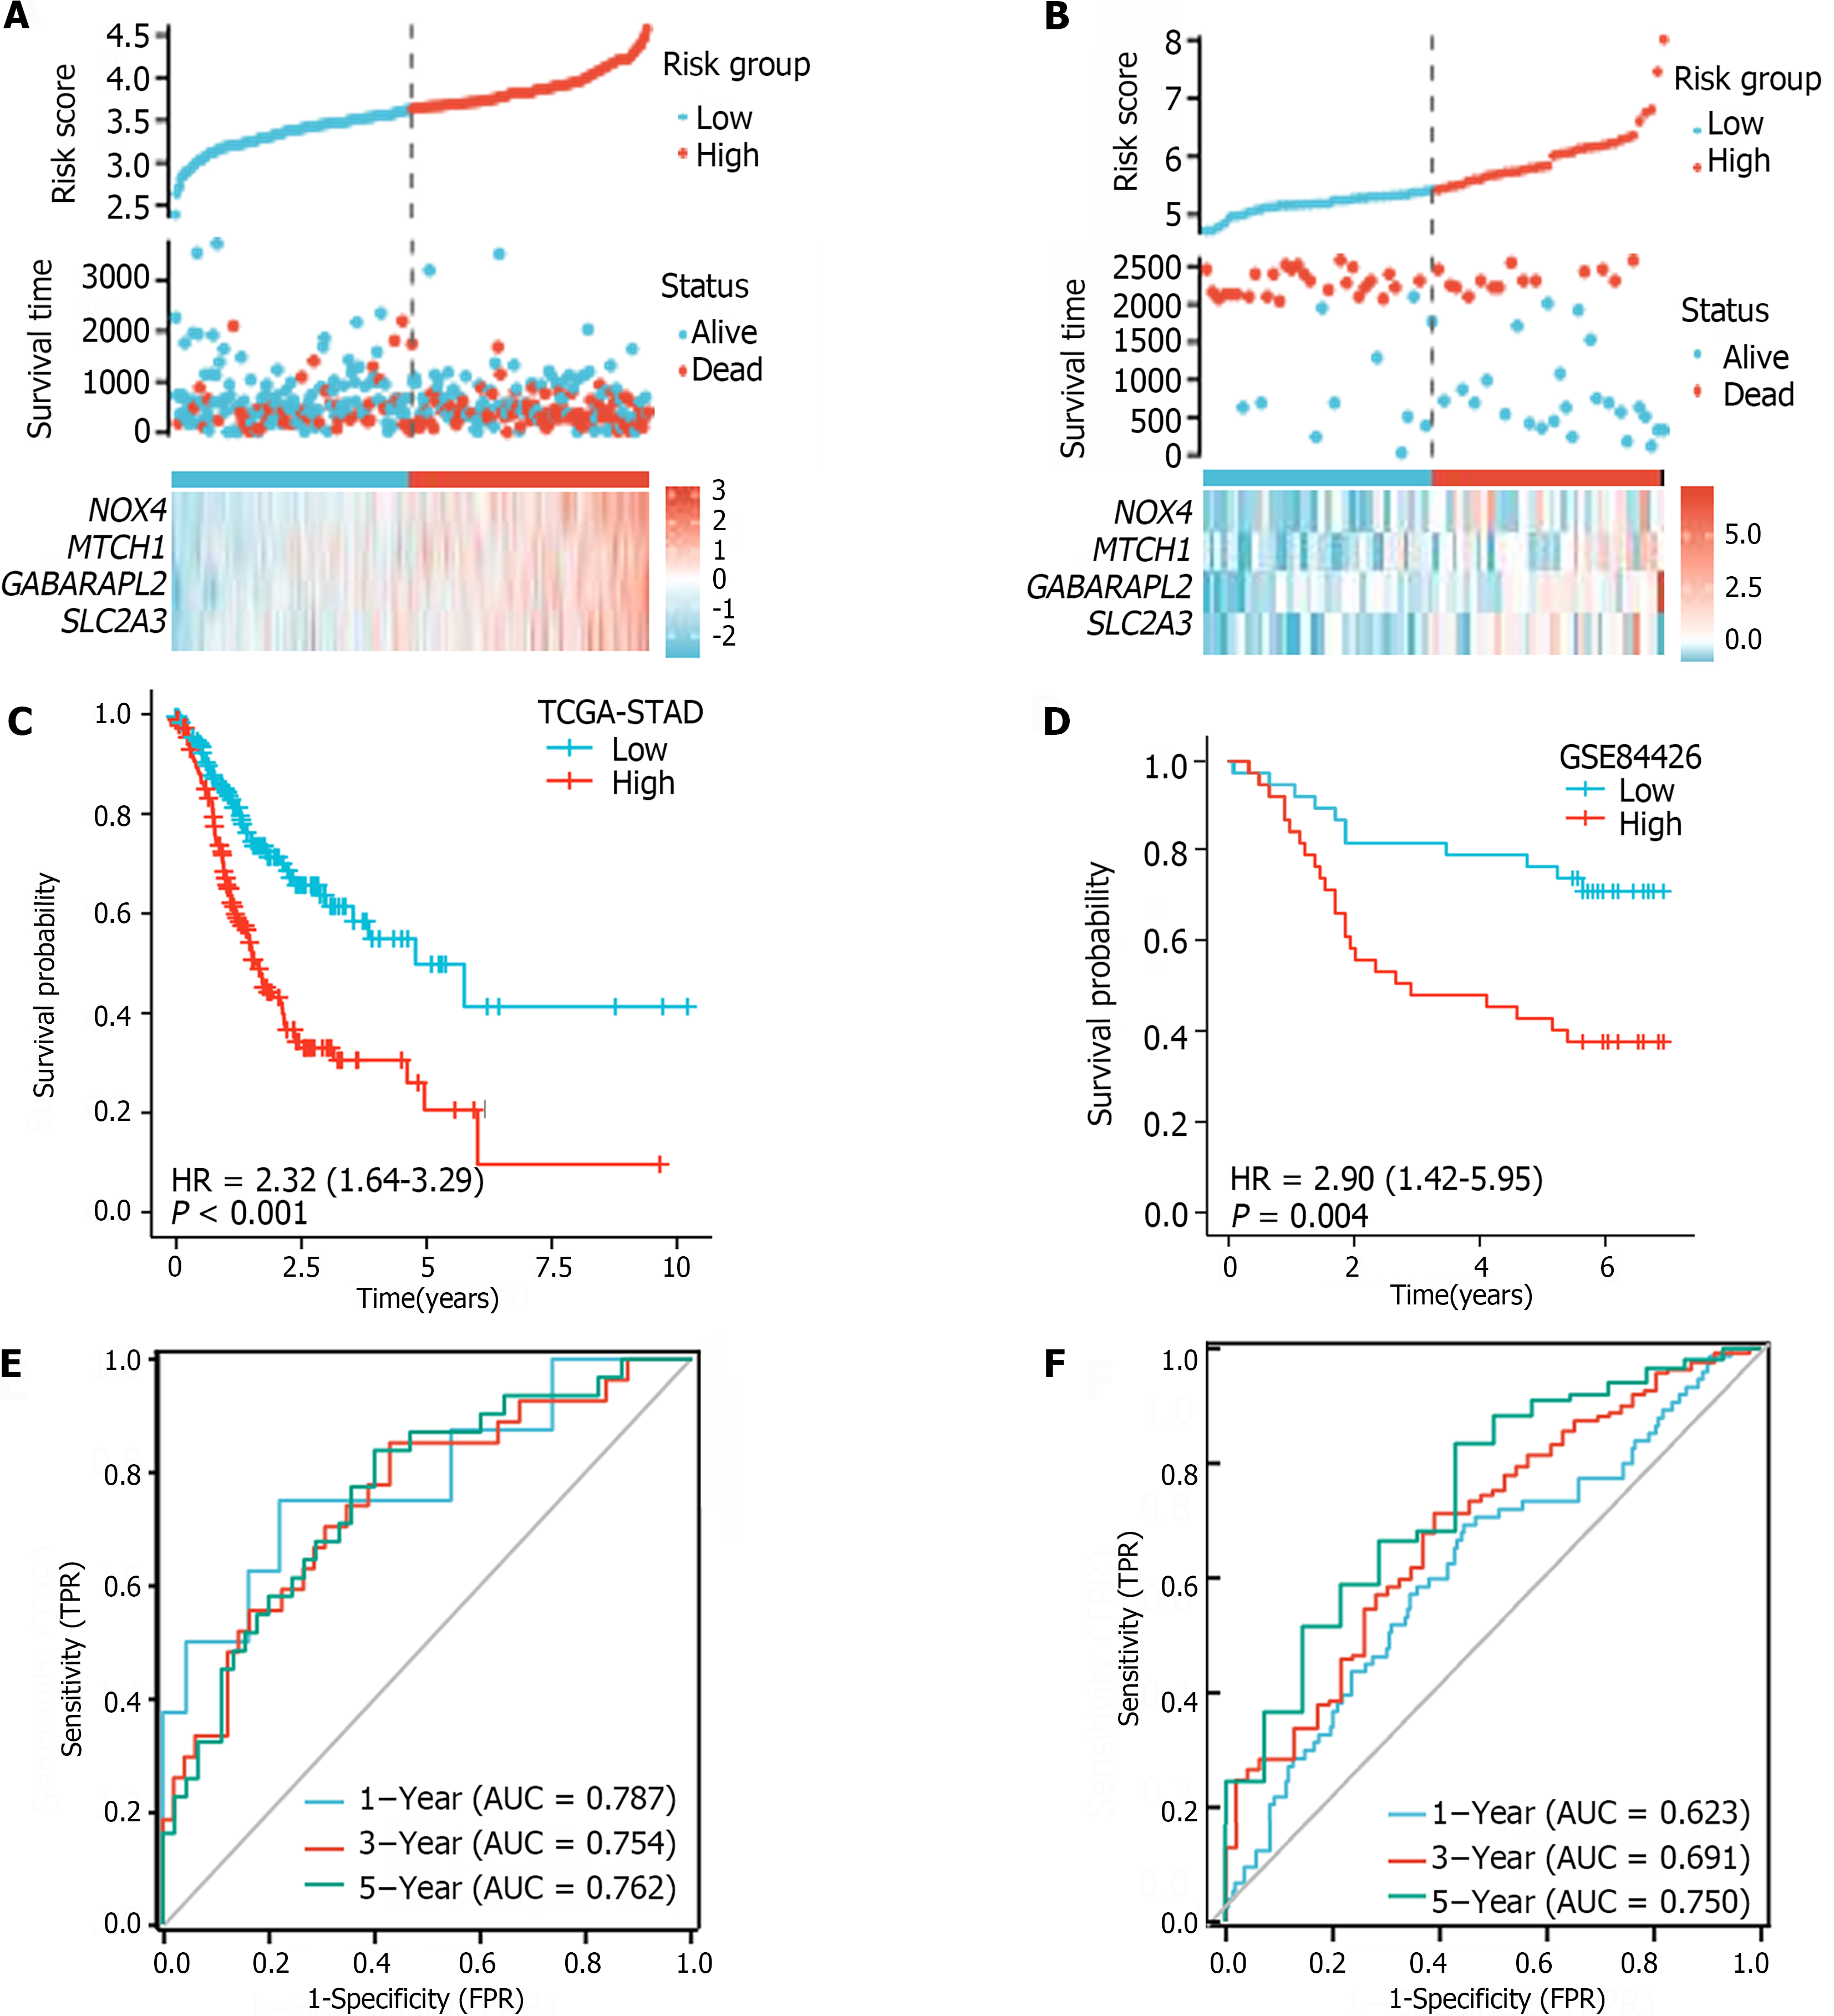
Figure 4 The ferroptosis-related genes prognostic index independently predicts gastric cancer patient survival.
A: Risk score distribution and patient survival in the low- and high-risk groups of the cancer genome atlas of stomach adenocarcinoma (TCGA-STAD); B: Risk score distribution and patient survival in the low- and high-risk groups of GSE84426 cohorts; C: K–M survival analysis of the TCGA-STAD; D: K–M survival analysis of GSE84426 cohorts; E: Areas under the curve (AUC) of the time-dependent receiver operating characteristic curves (ROC) for the ferroptosis-related gene prognostic index in the TCGA-STAD; F: AUC of the time-dependent ROC curve for the GSE84426 cohorts. FPR: False positive rate; HR: Hazard ratio; TPR: True positive rate.
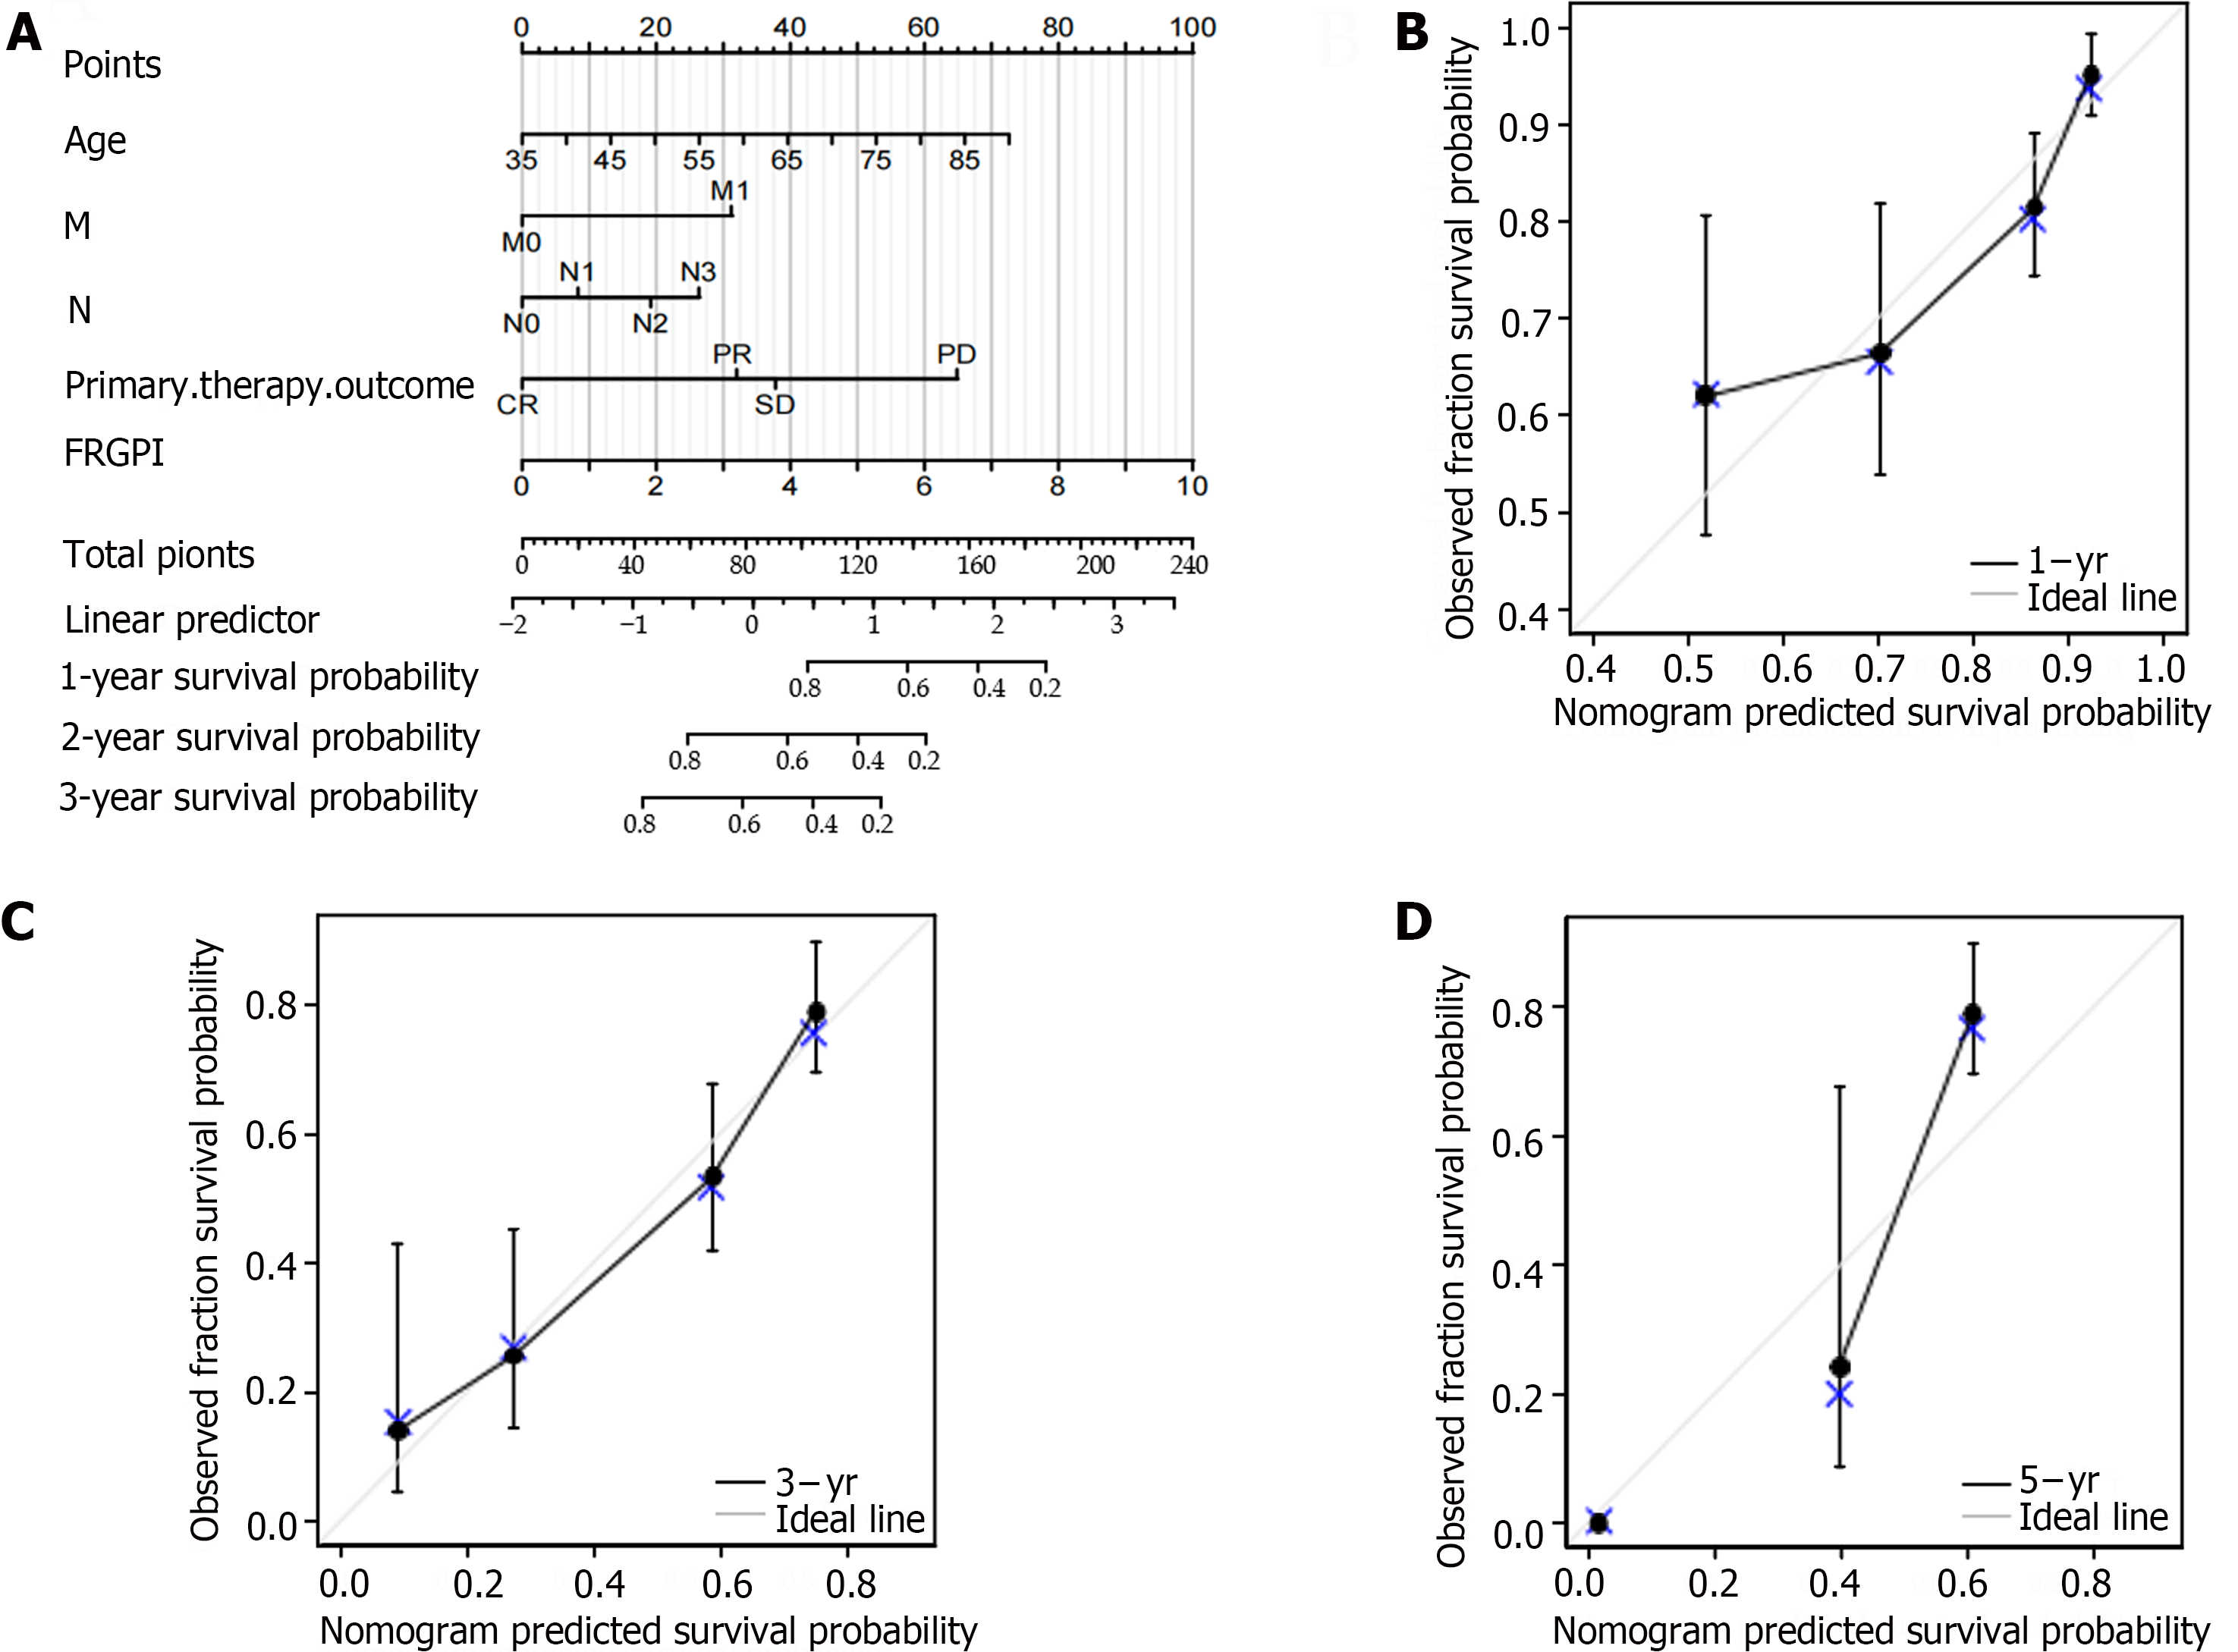
Figure 5 Construction and validation of the nomogram prediction model.
A: Prognostic nomogram for the ferroptosis-related gene prognostic index in the cancer genome atlas (TCGA); B-D: Calibration curves for predicting 1- to 5-yr survival in the TCGA-stomach adenocarcinoma cohort using the nomogram. FRGPI: Ferroptosis-related gene prognostic index.
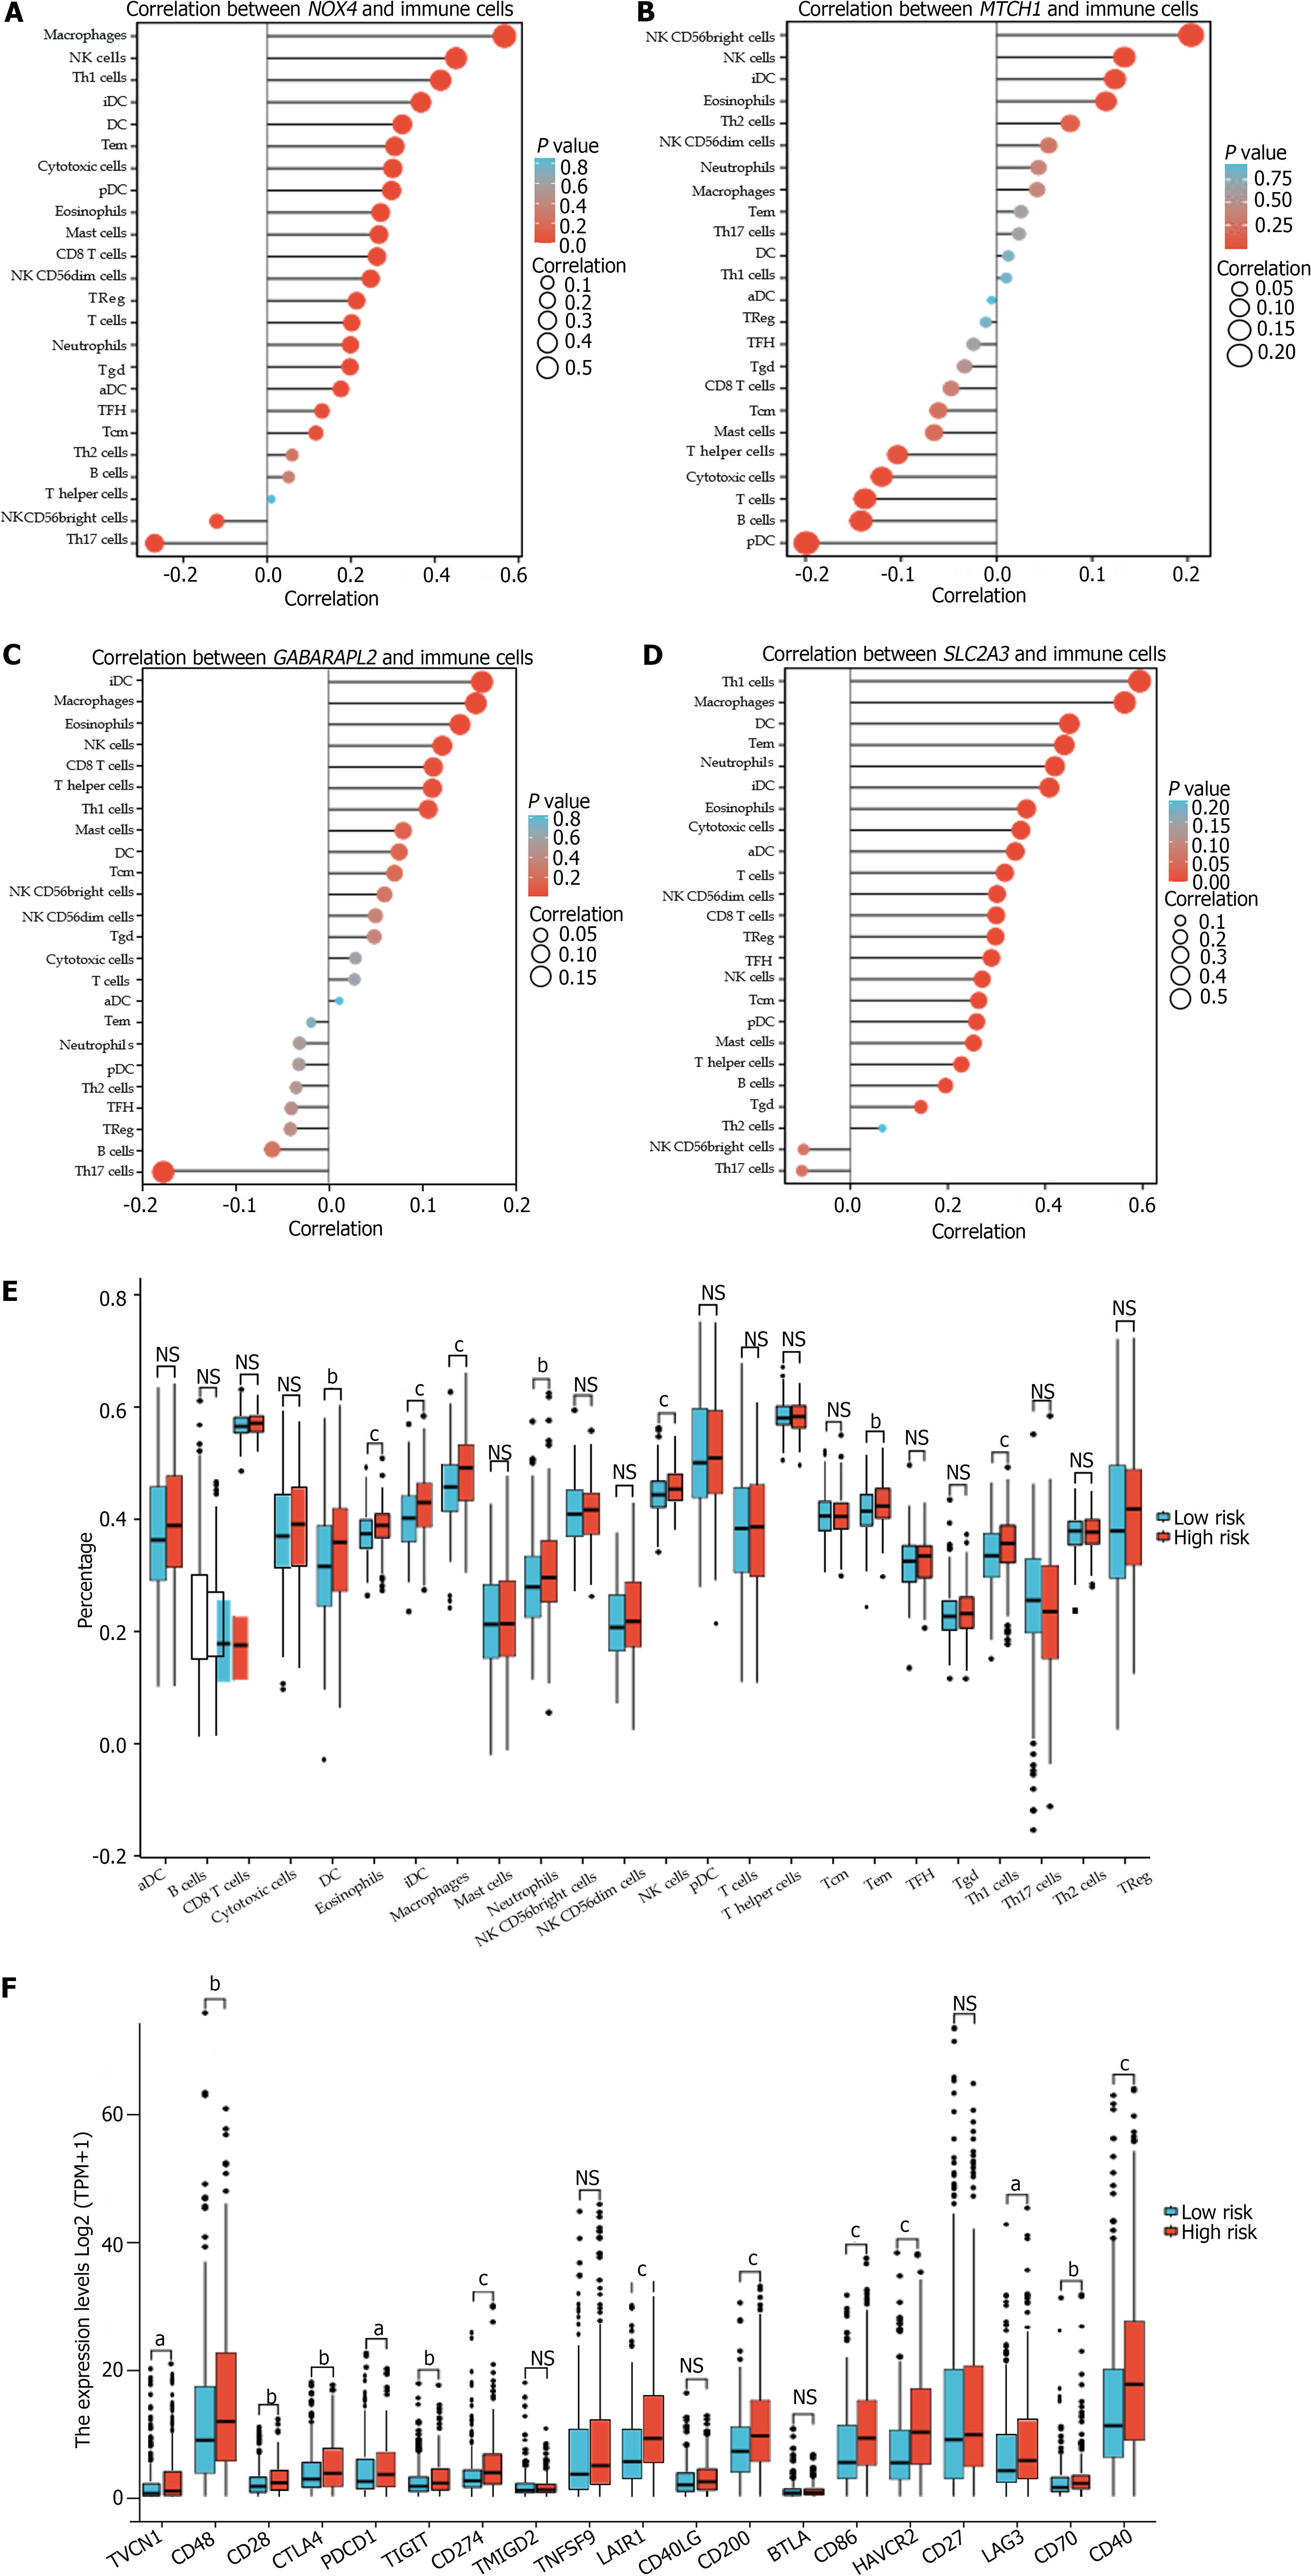
Figure 6 Correlation of hub genes with immune infiltration and immunotherapy.
A: Correlation between NOX4 and immune cells; B: Correlation between MTCH1 and immune cells; C: Correlation between GABARAPL2 and immune cells; D: Correlation between SLC2A3 and immune cells; E: Differences in the ratios of immune cells between the high- and low-risk groups in the cancer genome atlas of stomach adenocarcinoma (TCGA-STAD) cohort; F: Different expression levels of immune checkpoint proteins between the high- and low-risk groups in the TCGA-STAD cohort. aP < 0.05, bP < 0.01, cP < 0.001. NK cell: Natural killer cell; Th1: Type 1 T helper; Th2: Type 2 T helper; iDC: Interdigitating dendritic cells; pDC: Pre-dendritic cells; aDC: Activated dendritic cells; TFH: T-follicular helper; VTCN1: T-cell activation inhibitor-1; PDCD1: Programed cell death 1; TIGIT: T cell immunoreceptor with Ig and ITIM domains; TMIGD2: Transmembrane and immunoglobulin (Ig) domain containing 2; TNFSF9: Tumor necrosis factor superfamily member 9; LAIR1: Leukocyte-associated immunoglobulin-like receptor 1; BTLA: B- and T-lymphocyte attenuator; HAVCR2: Hepatitis A virus cellular receptor; 2LAG3: Lymphocyte activating gene 3.
Figure 7 Hub gene expression in gastric cancer cells and tissues.
A: Immunohistochemical analysis of hub genes in gastric cancer (GC) and Helicobacter pylori-associated GC. B: Statistical analysis of immunohistochemical results. (The expression of hub genes in cancer tissues was significantly higher than that in paracancer tissues); C: Expression levels of hub genes in GC cell lines; D: Statistical analysis of Western blot result; E: Immunofluorescence analysis of hub genes in GC; F: Statistical analysis of Immunofluorescence analysis of hub genes (NOX4 and GABA may have colocatable regions). GC: Gastric cancer; Hp GC: Helicobacter pylori-associated gastric cancer; Hp GC-pa: Helicobacter pylori-associated gastric cancer paracancer; GC-pa: Gastric cancer paracancer.
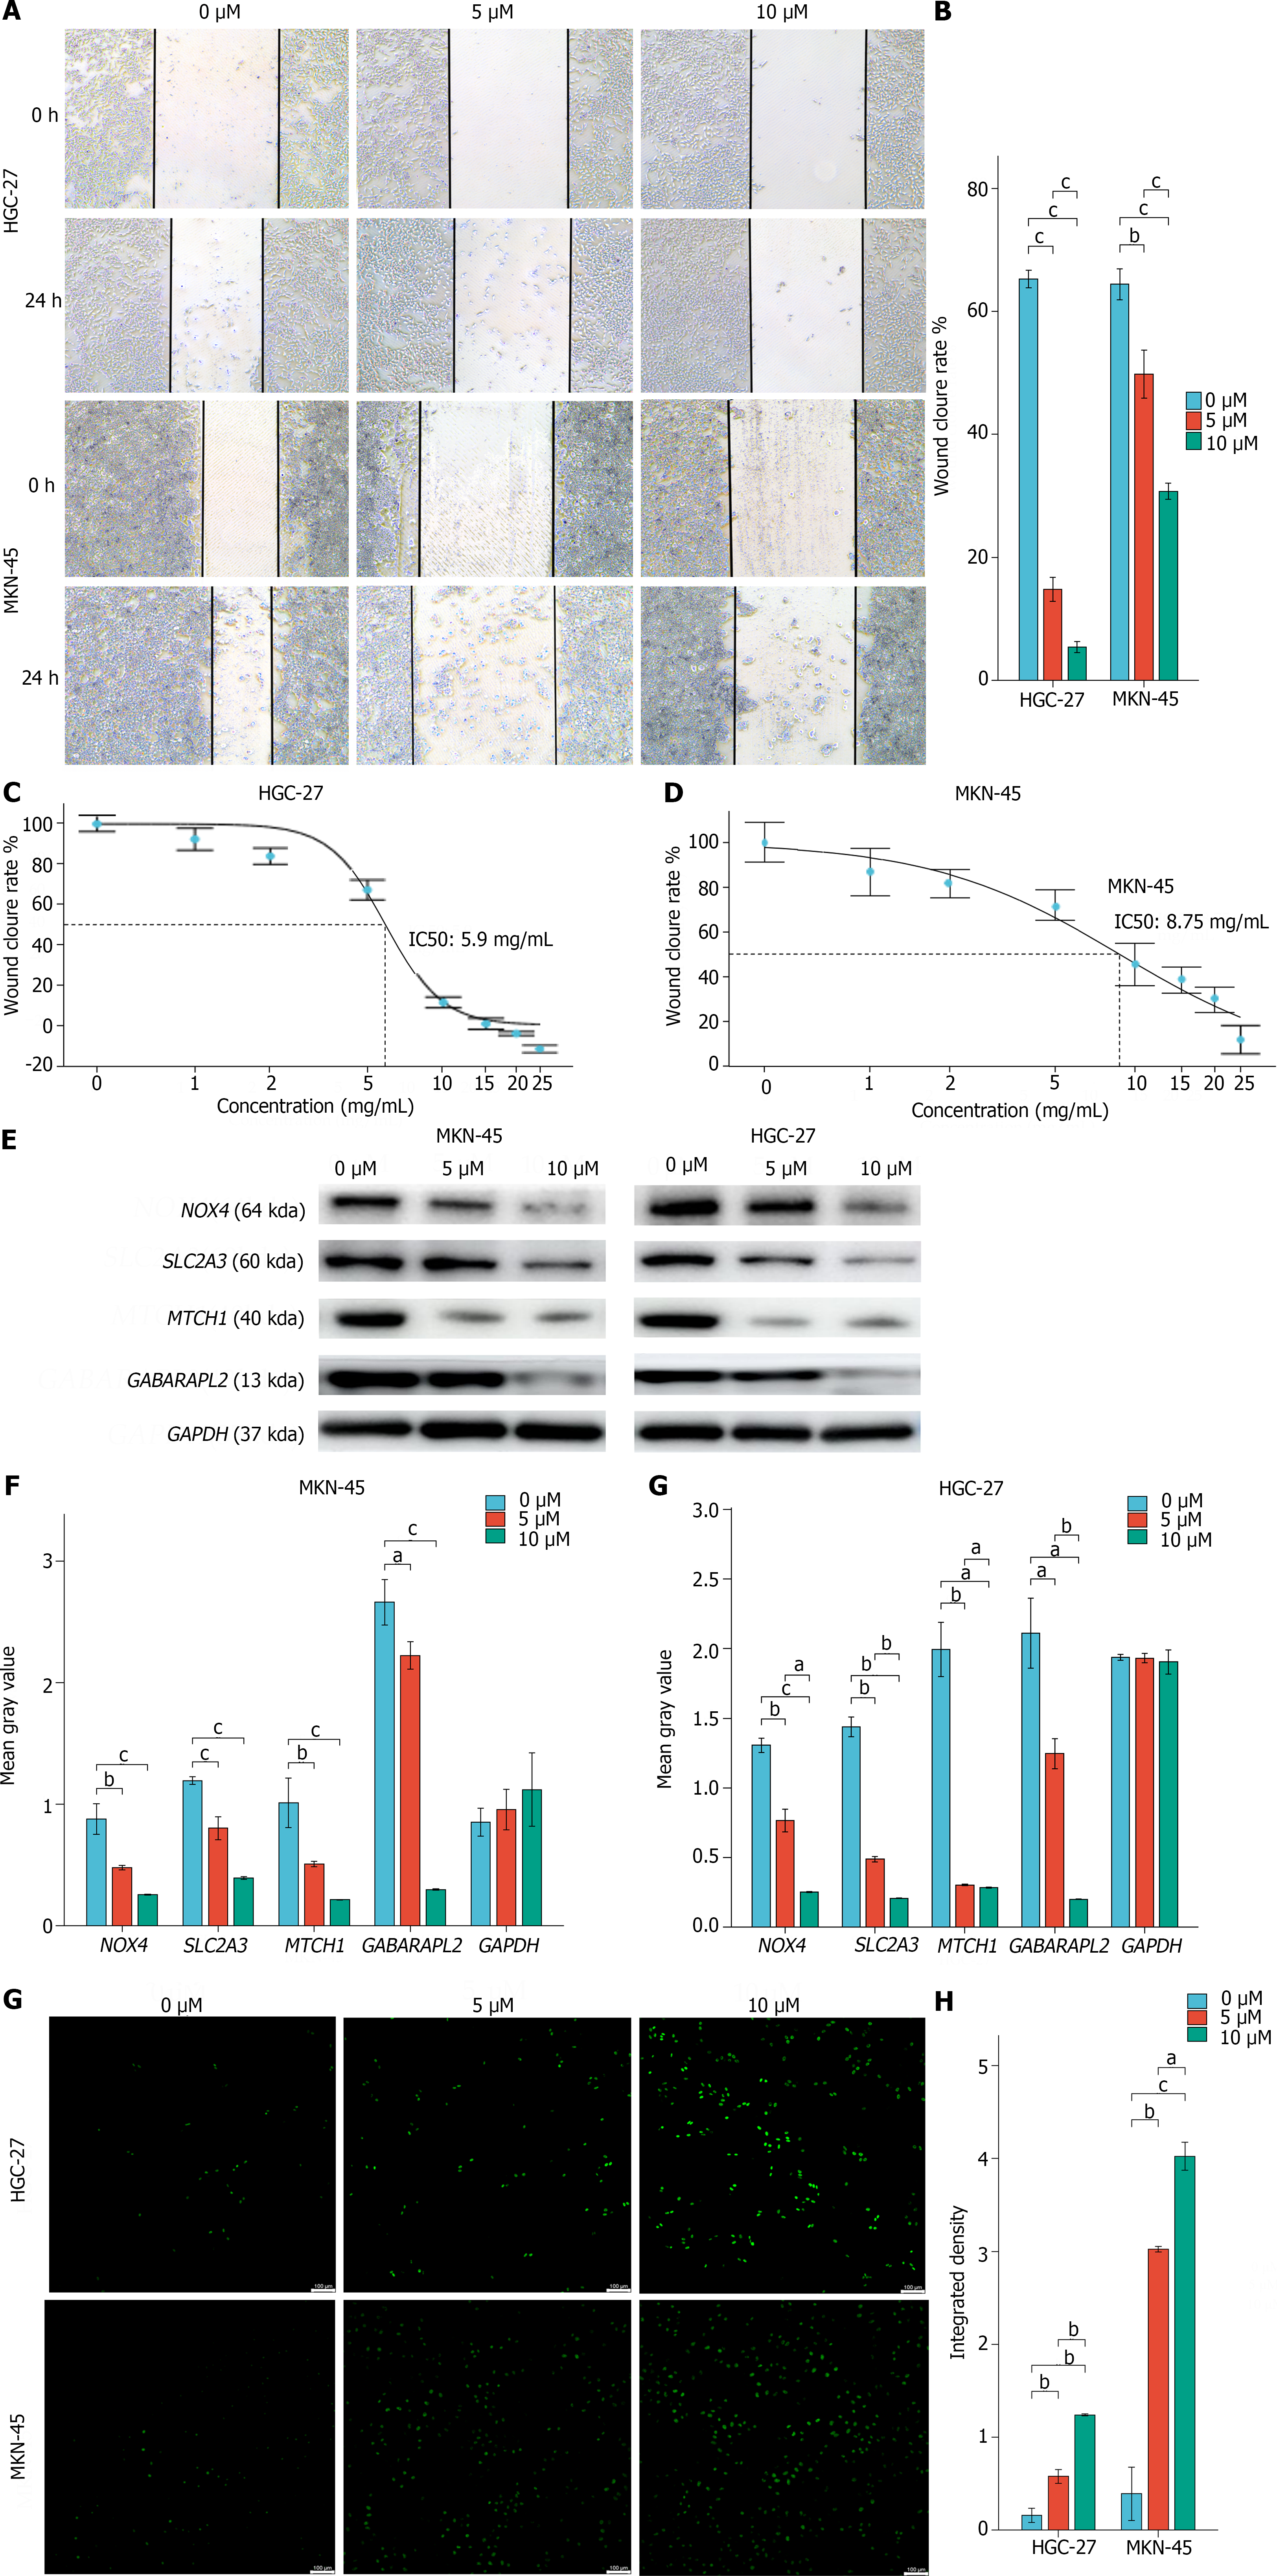
Figure 8 Effects of FIN56 on hub genes in gastric cancer cell lines.
A and B: Scratch assays to assess HGC-27 and MKN-45 cell migration after FIN56 treatment; C and D: Cytotoxicity assays of FIN56-treated HGC-27 (A) and MKN-45 (B) cells; E: Expression of hub genes in HGC-27 and MKN-45 cells after FIN56 treatment; F: Statistical analysis of Western blot result; G: Reactive oxygen species (ROS) levels in HGC-27 and MKN-45 cells treated with FIN56; H: Statistical analysis of ROS result. aP < 0.05, bP < 0.01, cP < 0.001.
- Citation: Wang L, Gong WH. Predictive model using four ferroptosis-related genes accurately predicts gastric cancer prognosis. World J Gastrointest Oncol 2024; 16(5): 2018-2037
- URL: https://www.wjgnet.com/1948-5204/full/v16/i5/2018.htm
- DOI: https://dx.doi.org/10.4251/wjgo.v16.i5.2018


