Copyright
©The Author(s) 2024.
World J Gastrointest Oncol. May 15, 2024; 16(5): 1965-1994
Published online May 15, 2024. doi: 10.4251/wjgo.v16.i5.1965
Published online May 15, 2024. doi: 10.4251/wjgo.v16.i5.1965
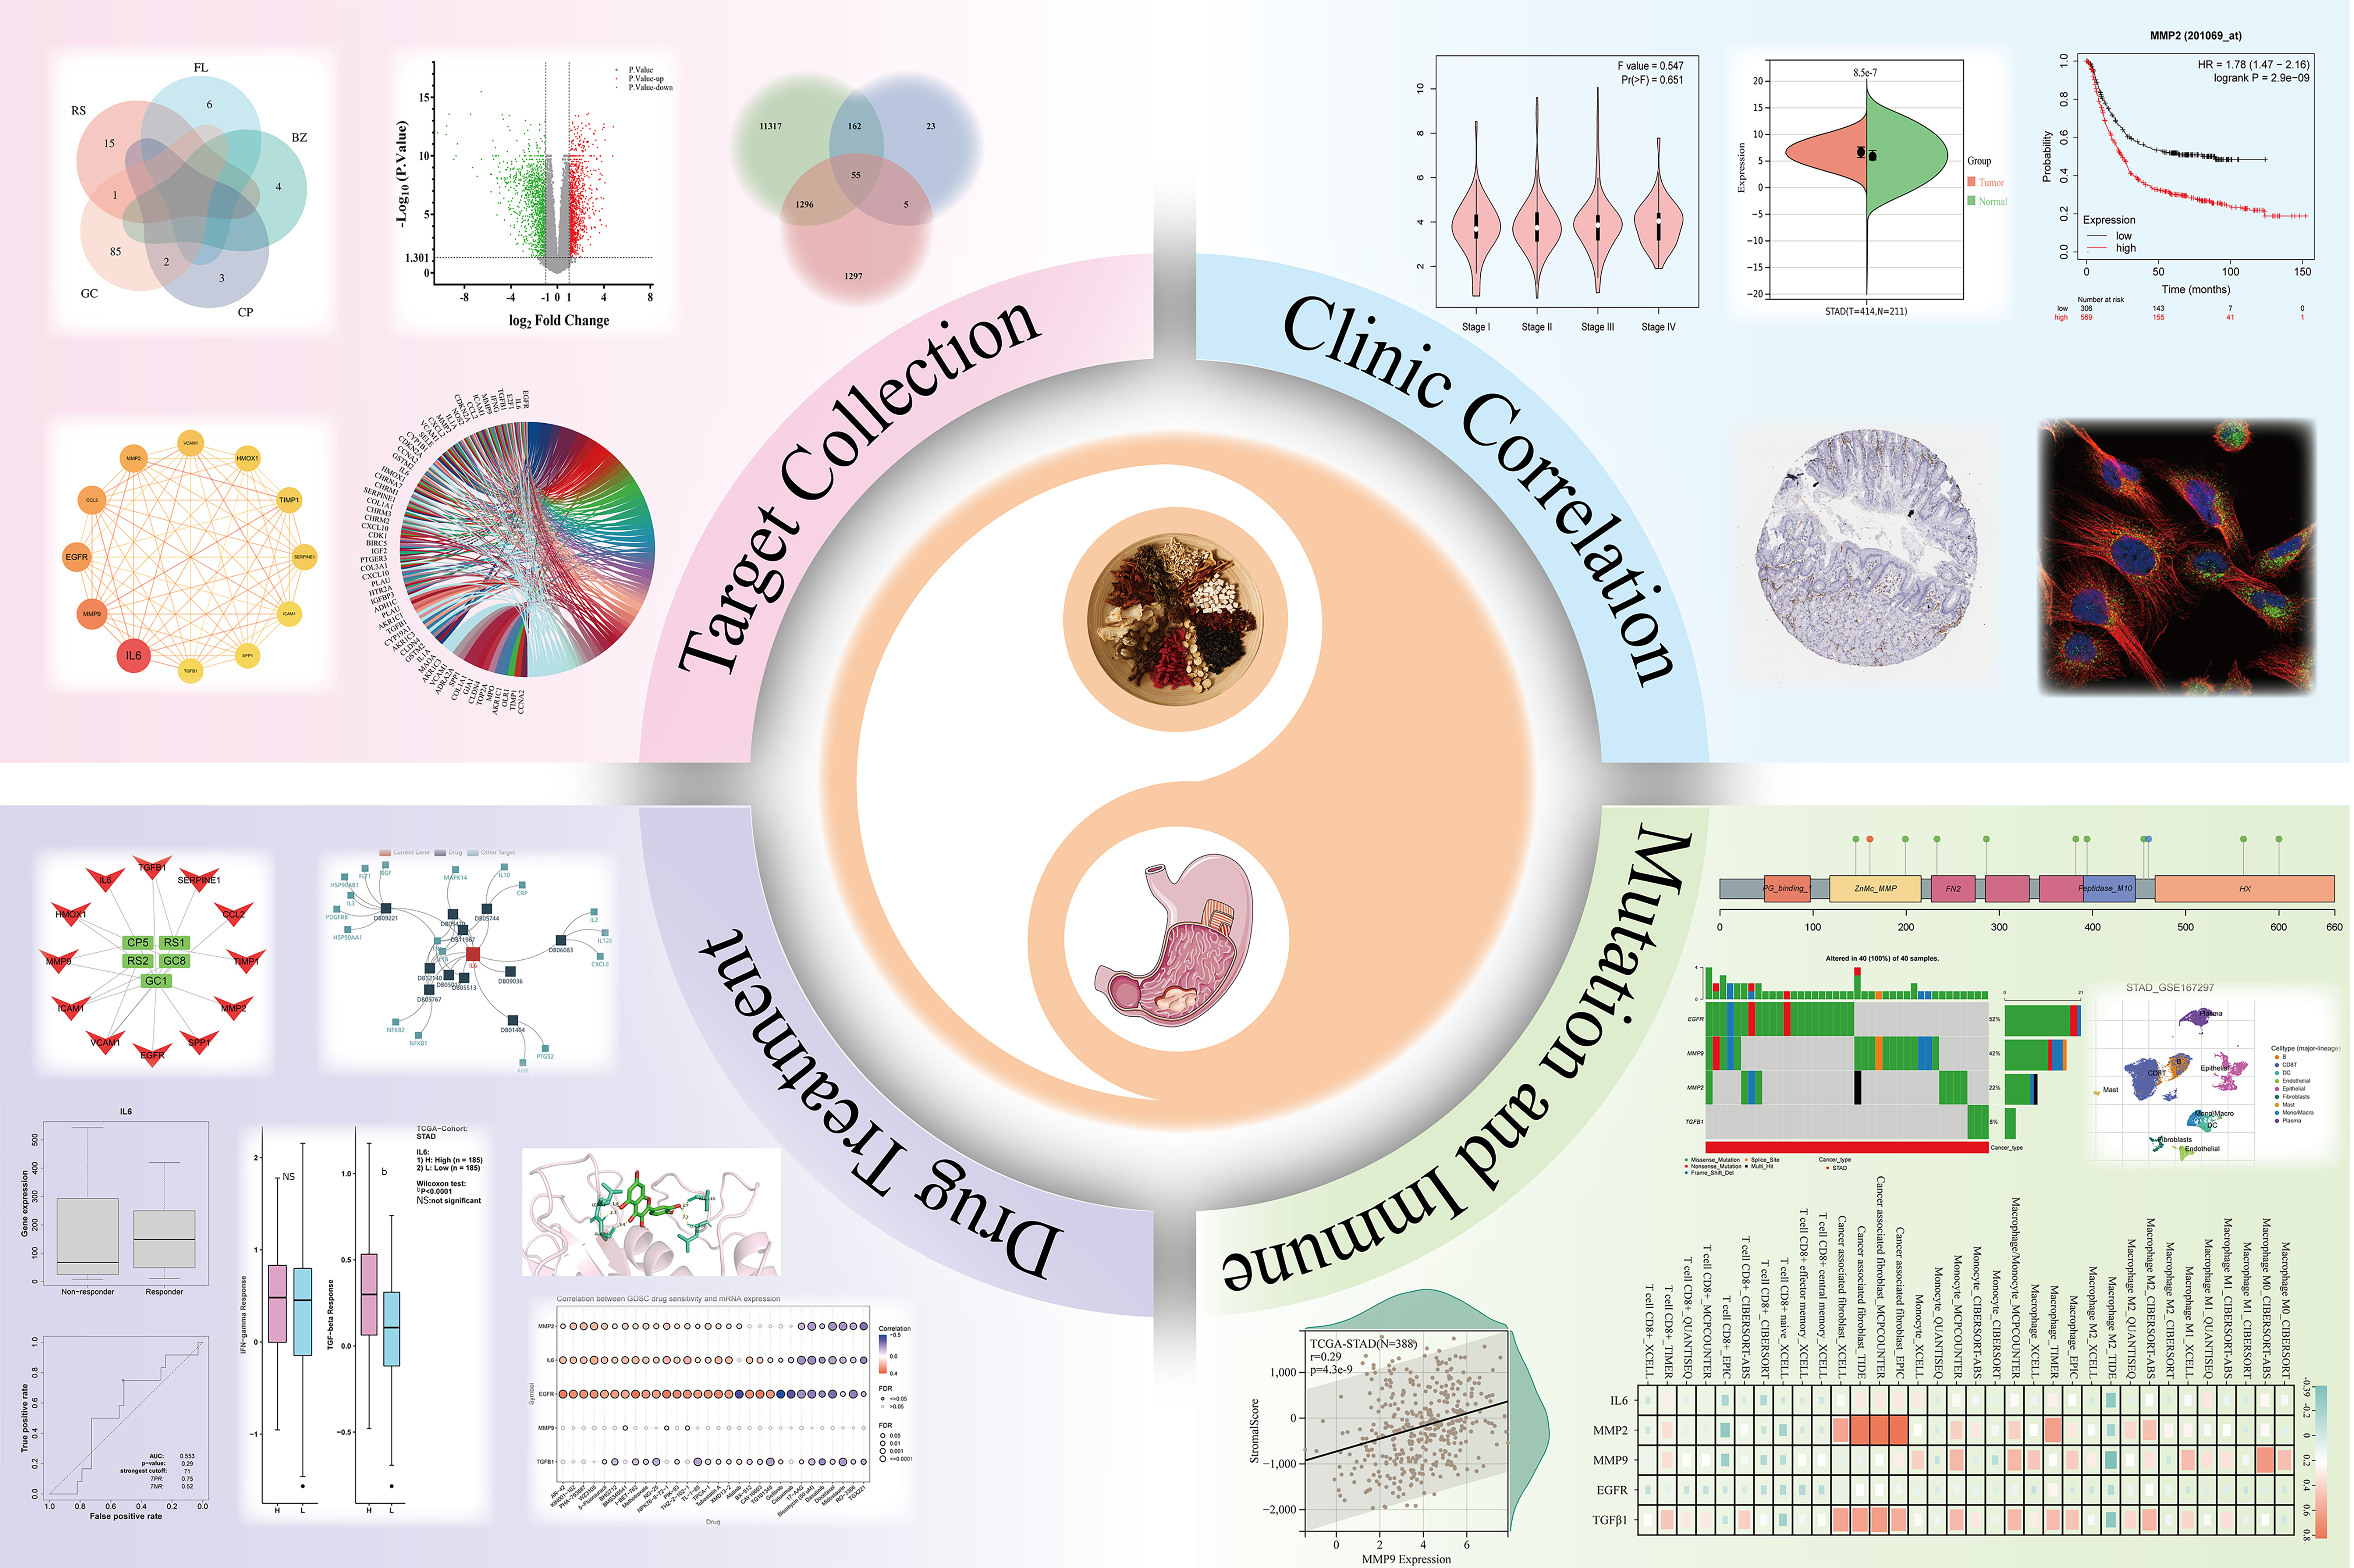
Figure 1 The flow chart of this study.
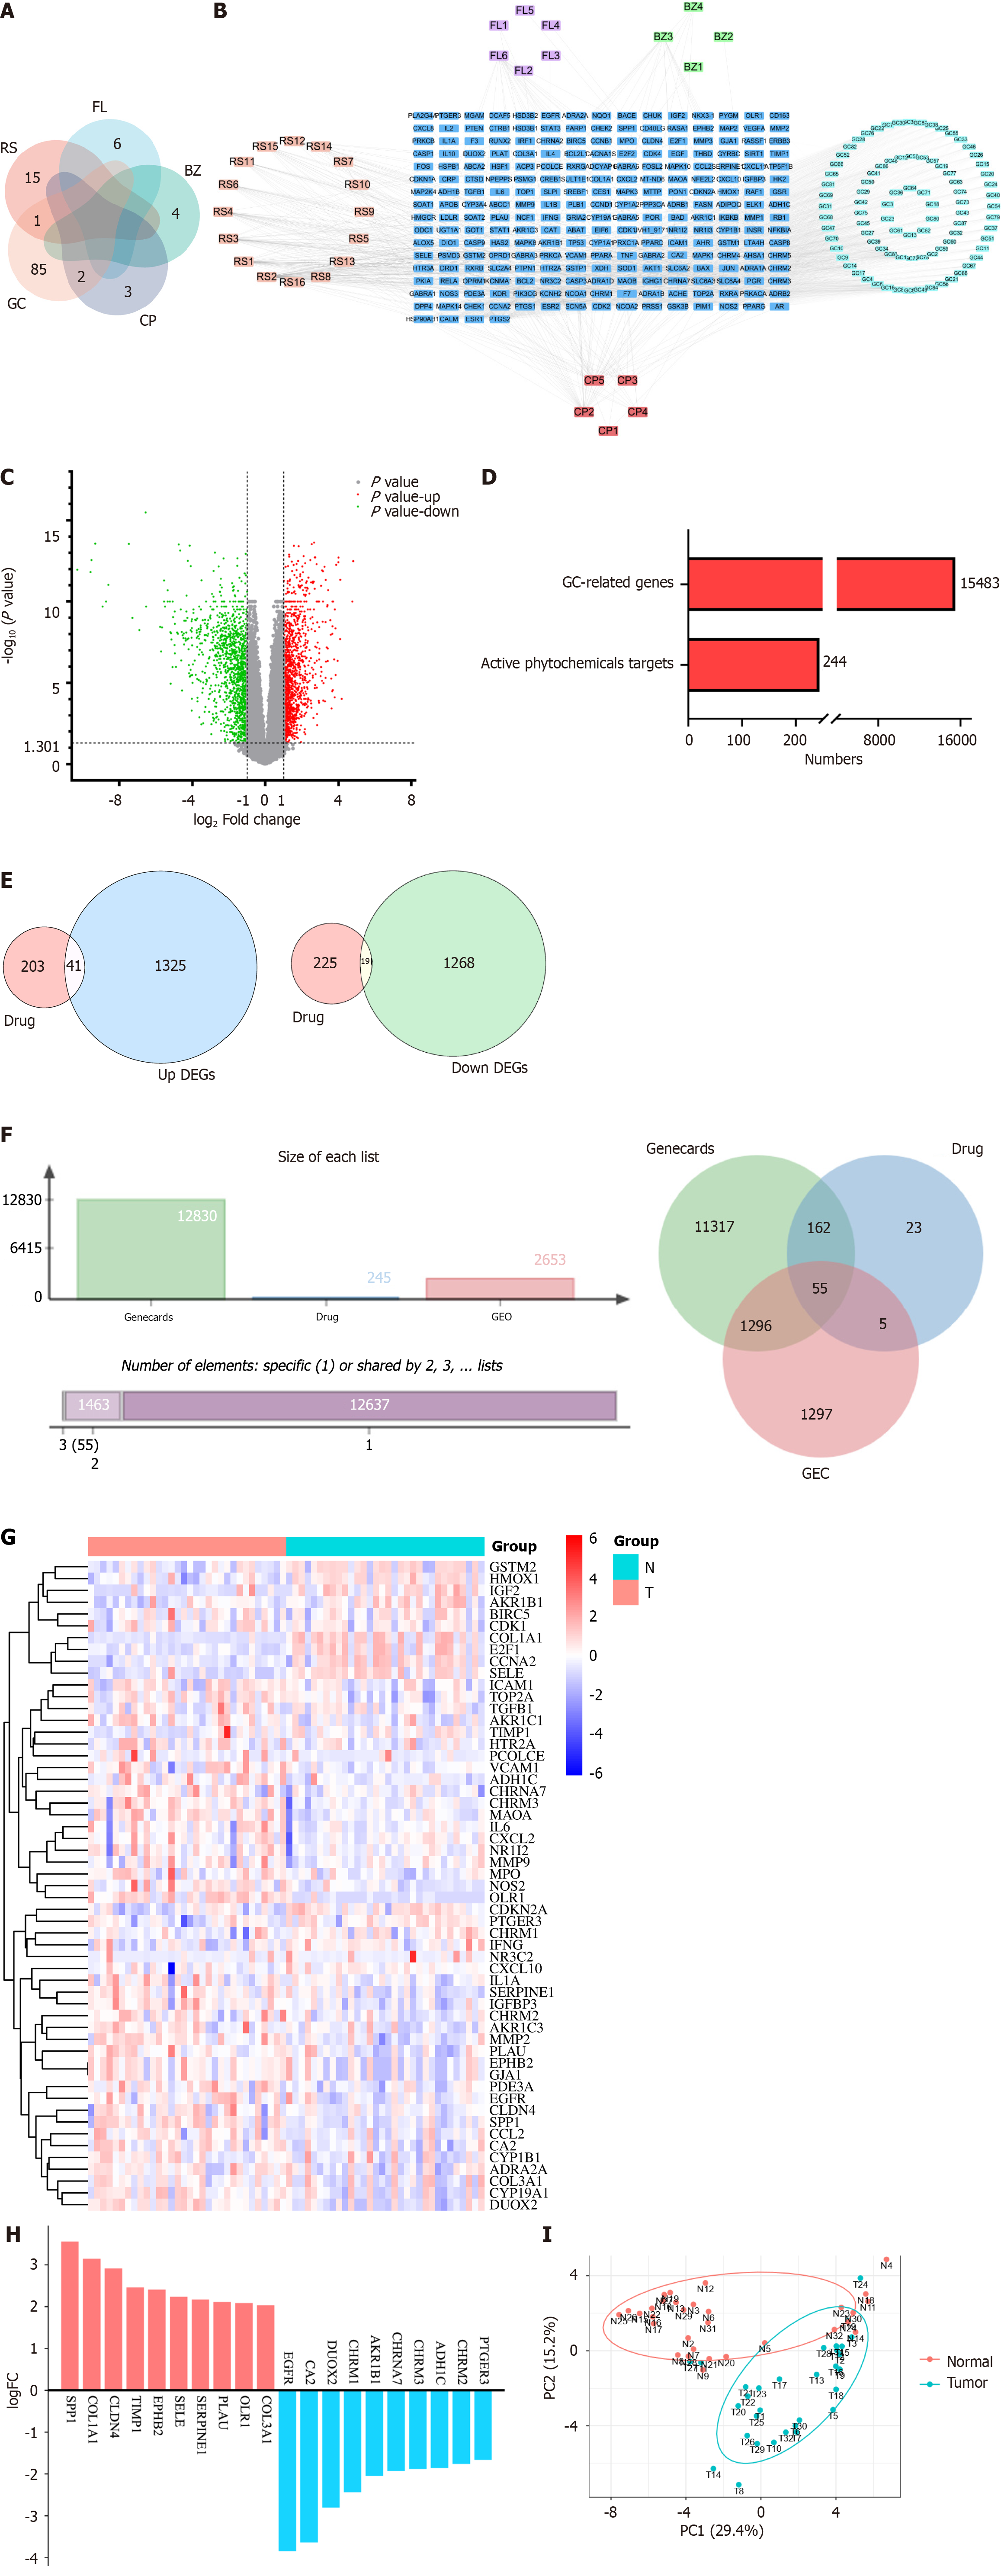
Figure 2 The targets of Yigong San ingredients and differentially expressed genes in gastric cancer.
A: Intersection plot of the number of active ingredients of Yigong San (YGS); B: Network diagram of YGS active ingredient-targets. Pink, purple, green, light green and red colors represent Renshen, Fuling, Baizhu, Gancao and Chenpi, respectively, and blue color represents all the targets of active ingredients; C: Volcano plot of differentially expressed genes of GSE65801; D: All genes of gastric cancer and the number of targets of YGS active ingredients; E: Intersection of up- and down-regulated genes of gastric cancer and targets of YGS; F: Intersection plot of YGS and gastric cancer targets; G: Heatmap of intersecting targets; H: Log-fold change values of the top 10 up- and down-regulated genes in the intersection targets; I: Principal co-ordinates analysis plots of the samples of the intersecting targets. RS: Renshen; FL: Fuling; BZ: Baizhu; GC: Gancao; CP: Chenpi; DEG: Differentially expressed gene; LogFC: Log-fold change; PCoA: Principal co-ordinates analysis.
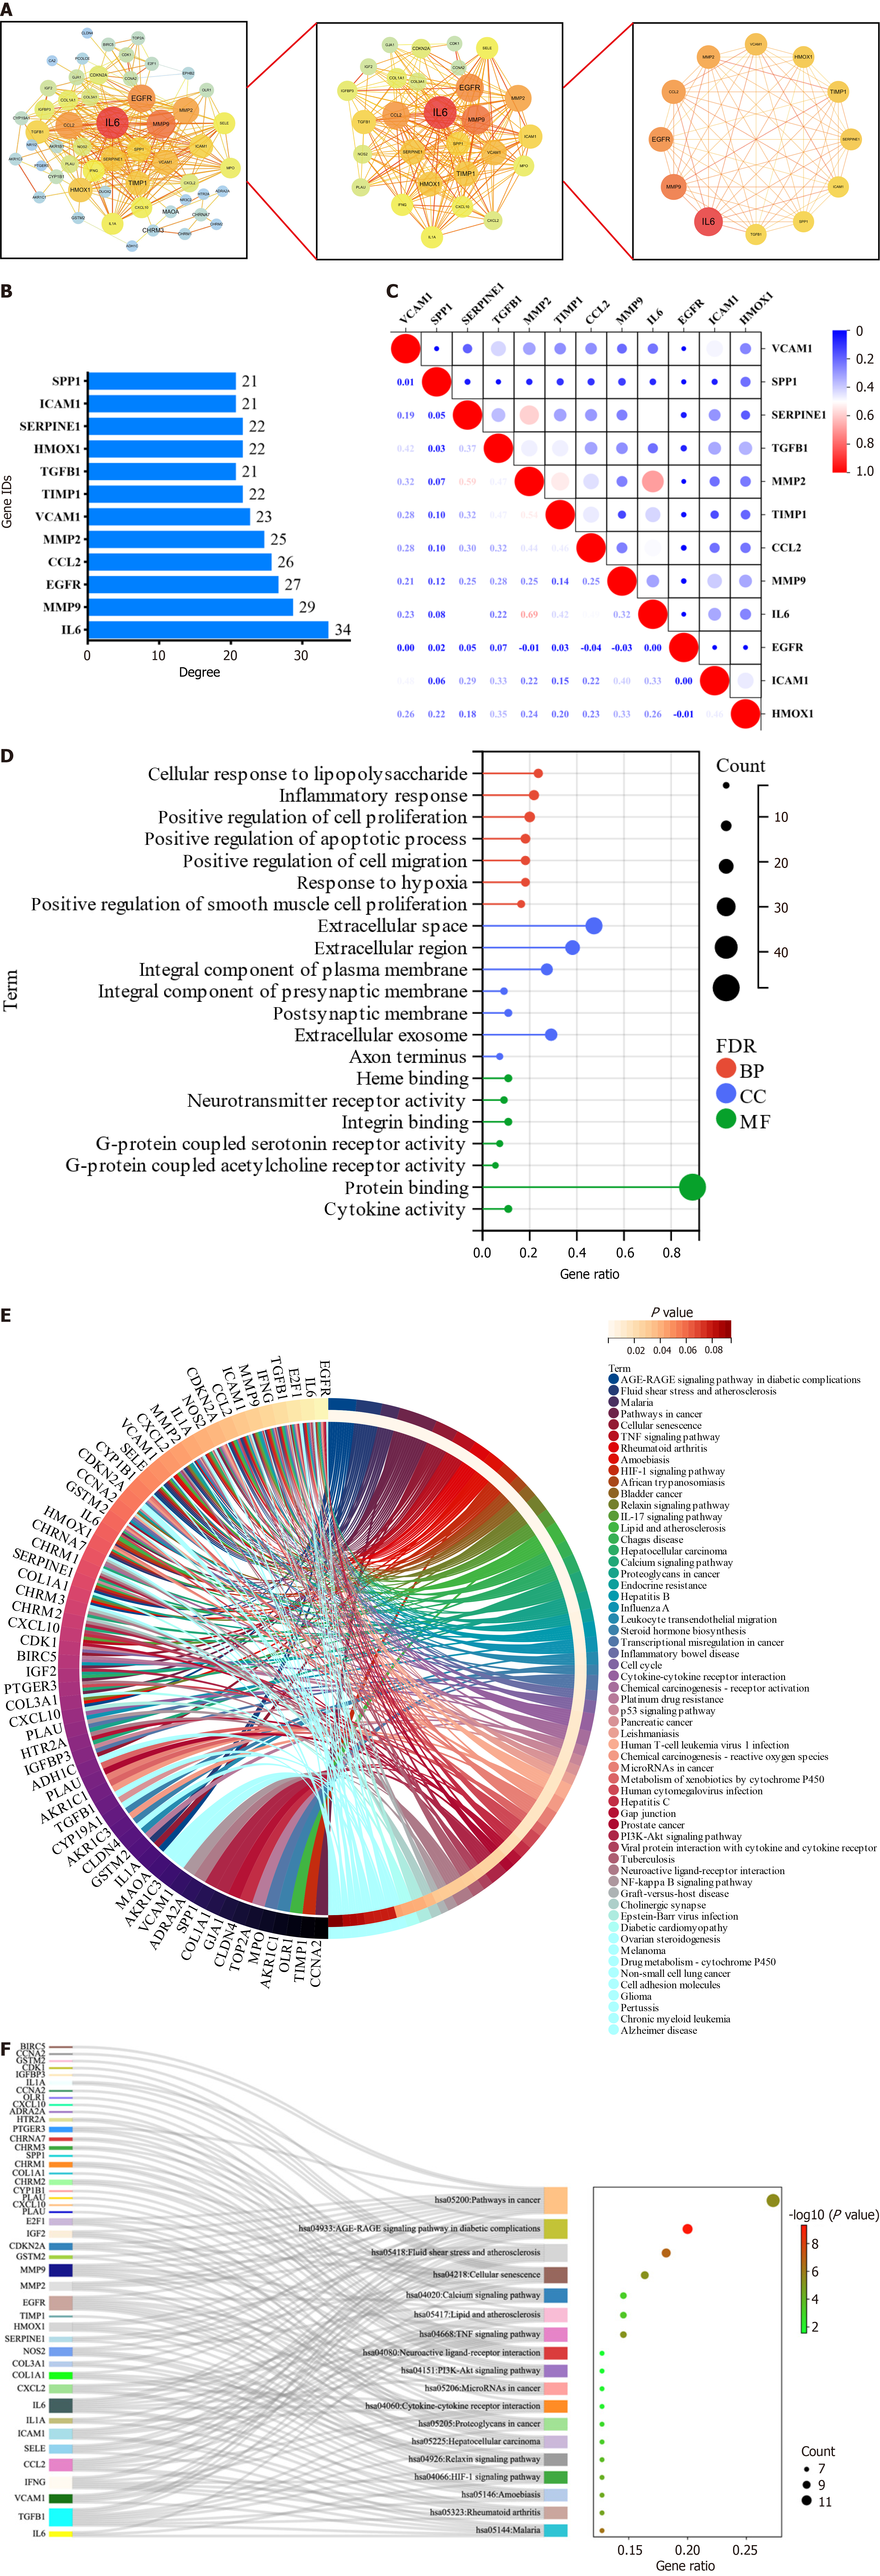
Figure 3 Screening and enrichment analysis of core targets.
A: Screening process of protein-protein interaction network; B: Degree value of core targets; C: Correlation heatmap of the core targets; D: Gene ontology plot of intersecting targets; E: Kyoto Encyclopedia of Genes (KEGG) And Genomes diagram of intersecting targets; F: Ranking of the front KEGG Sankey diagram. BP: Biological process; CC: Cellular localization; MF: Molecular function.
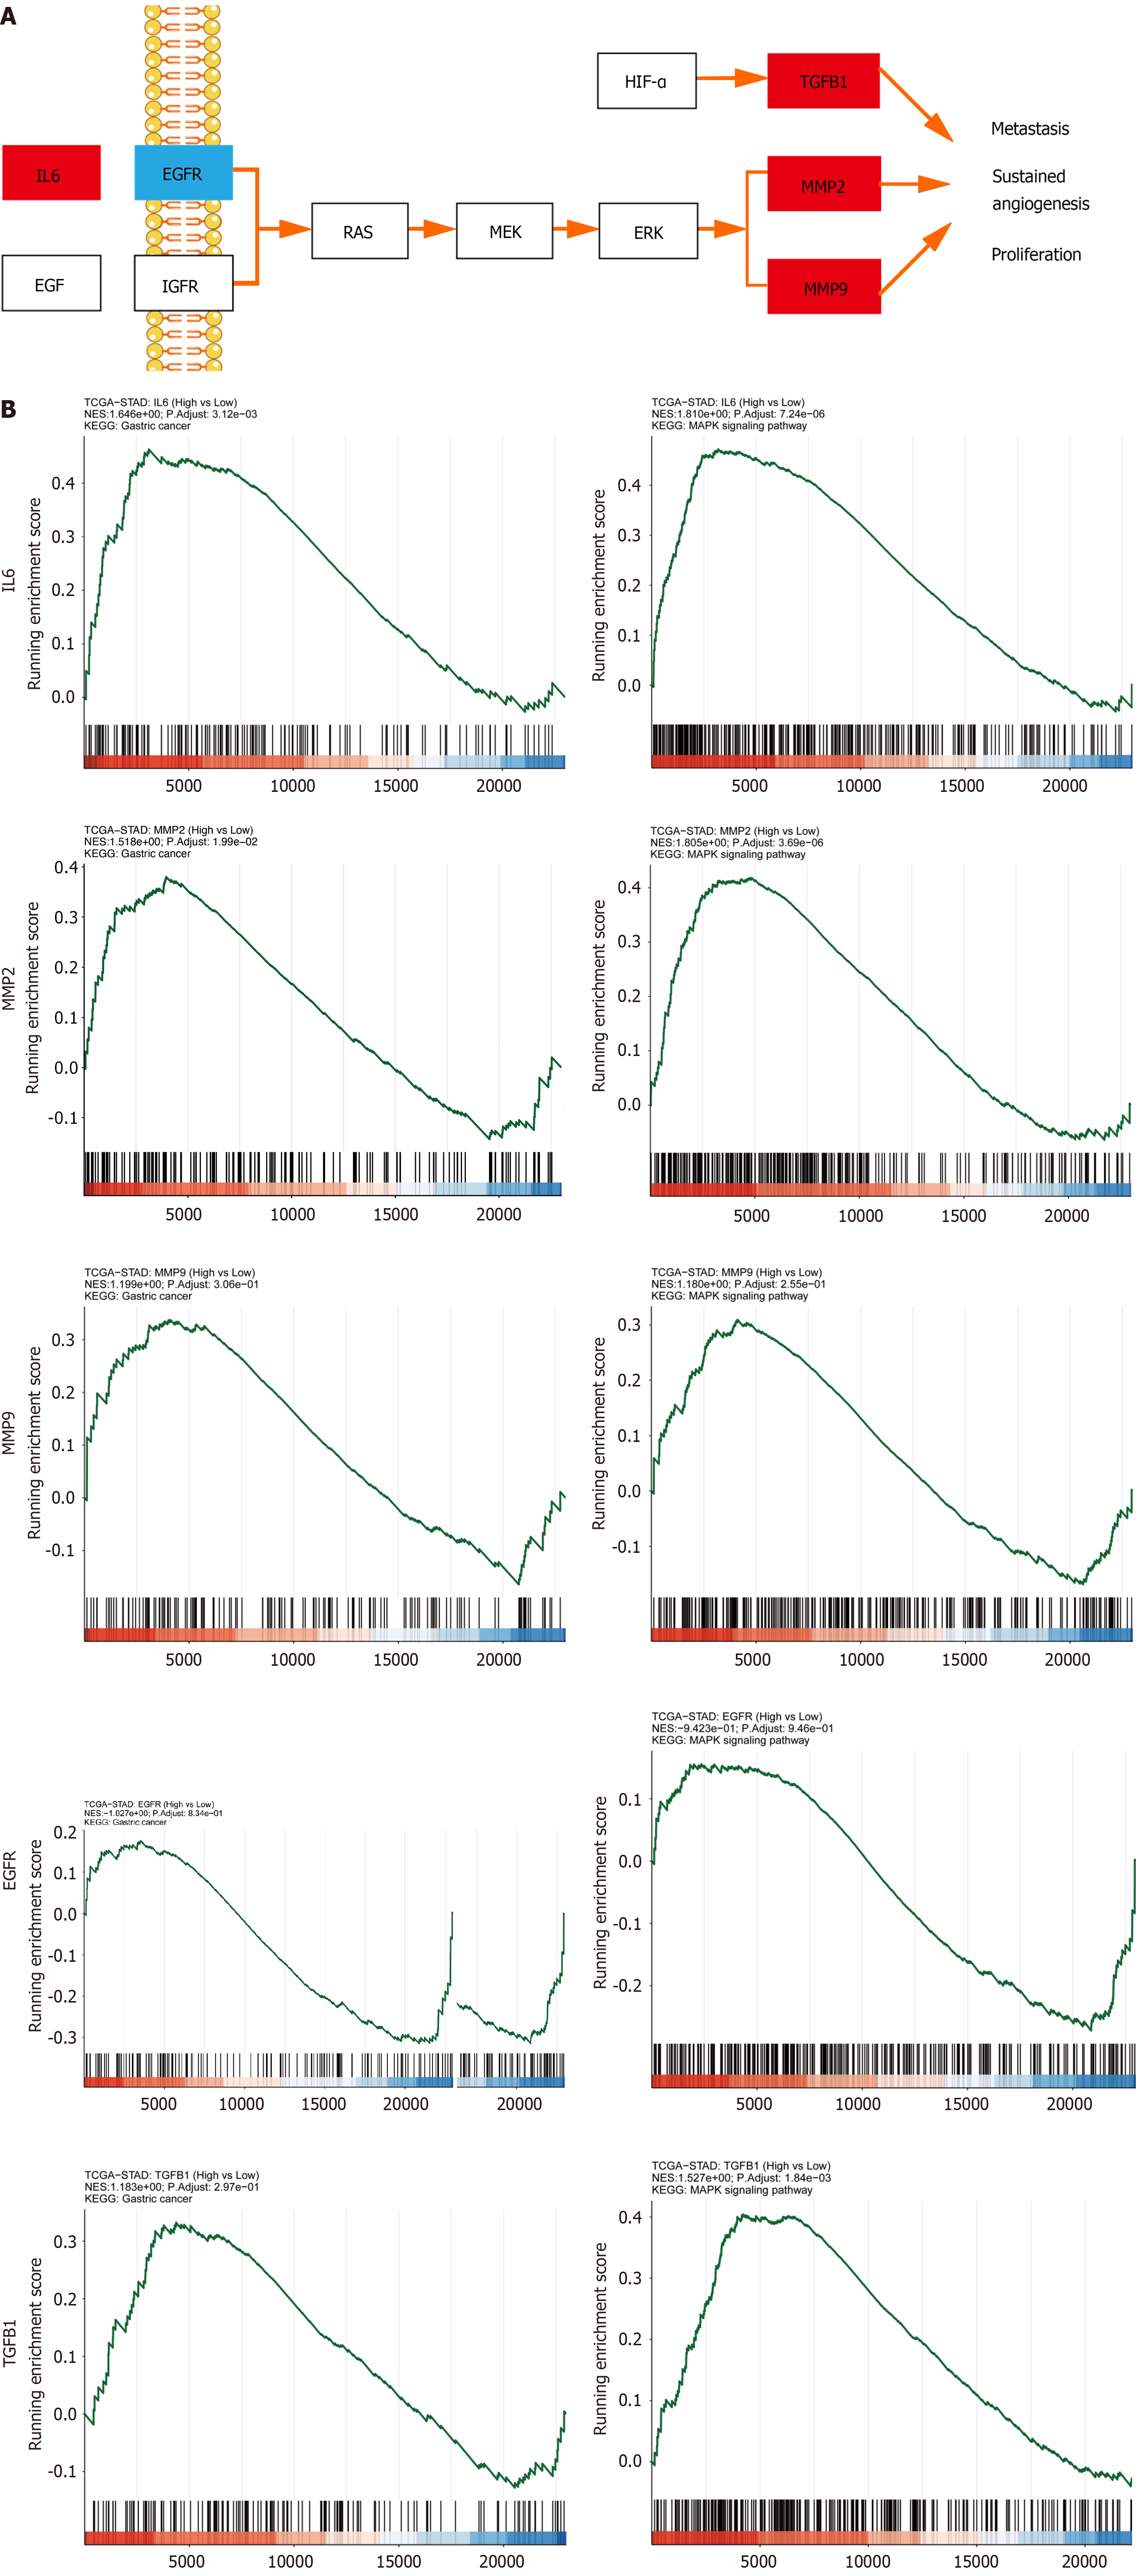
Figure 4 Screening the hub genes.
A: Predicting and screening the hub genes in the MAPK signaling pathway; B: Gene Set Enrichment Analysis analysis of hub genes.
Figure 5 Clinical correlation analysis of hub genes.
A: Expression levels of hub genes mRNA; B: Expression levels of hub genes copy number. Red represents the tumor group and green represents the normal group; C: Expression level of hub genes protein; D: Expression levels of hub genes in gastric cancer subtypes; E: Correlation between hub genes and clinical stage of gastric cancer.
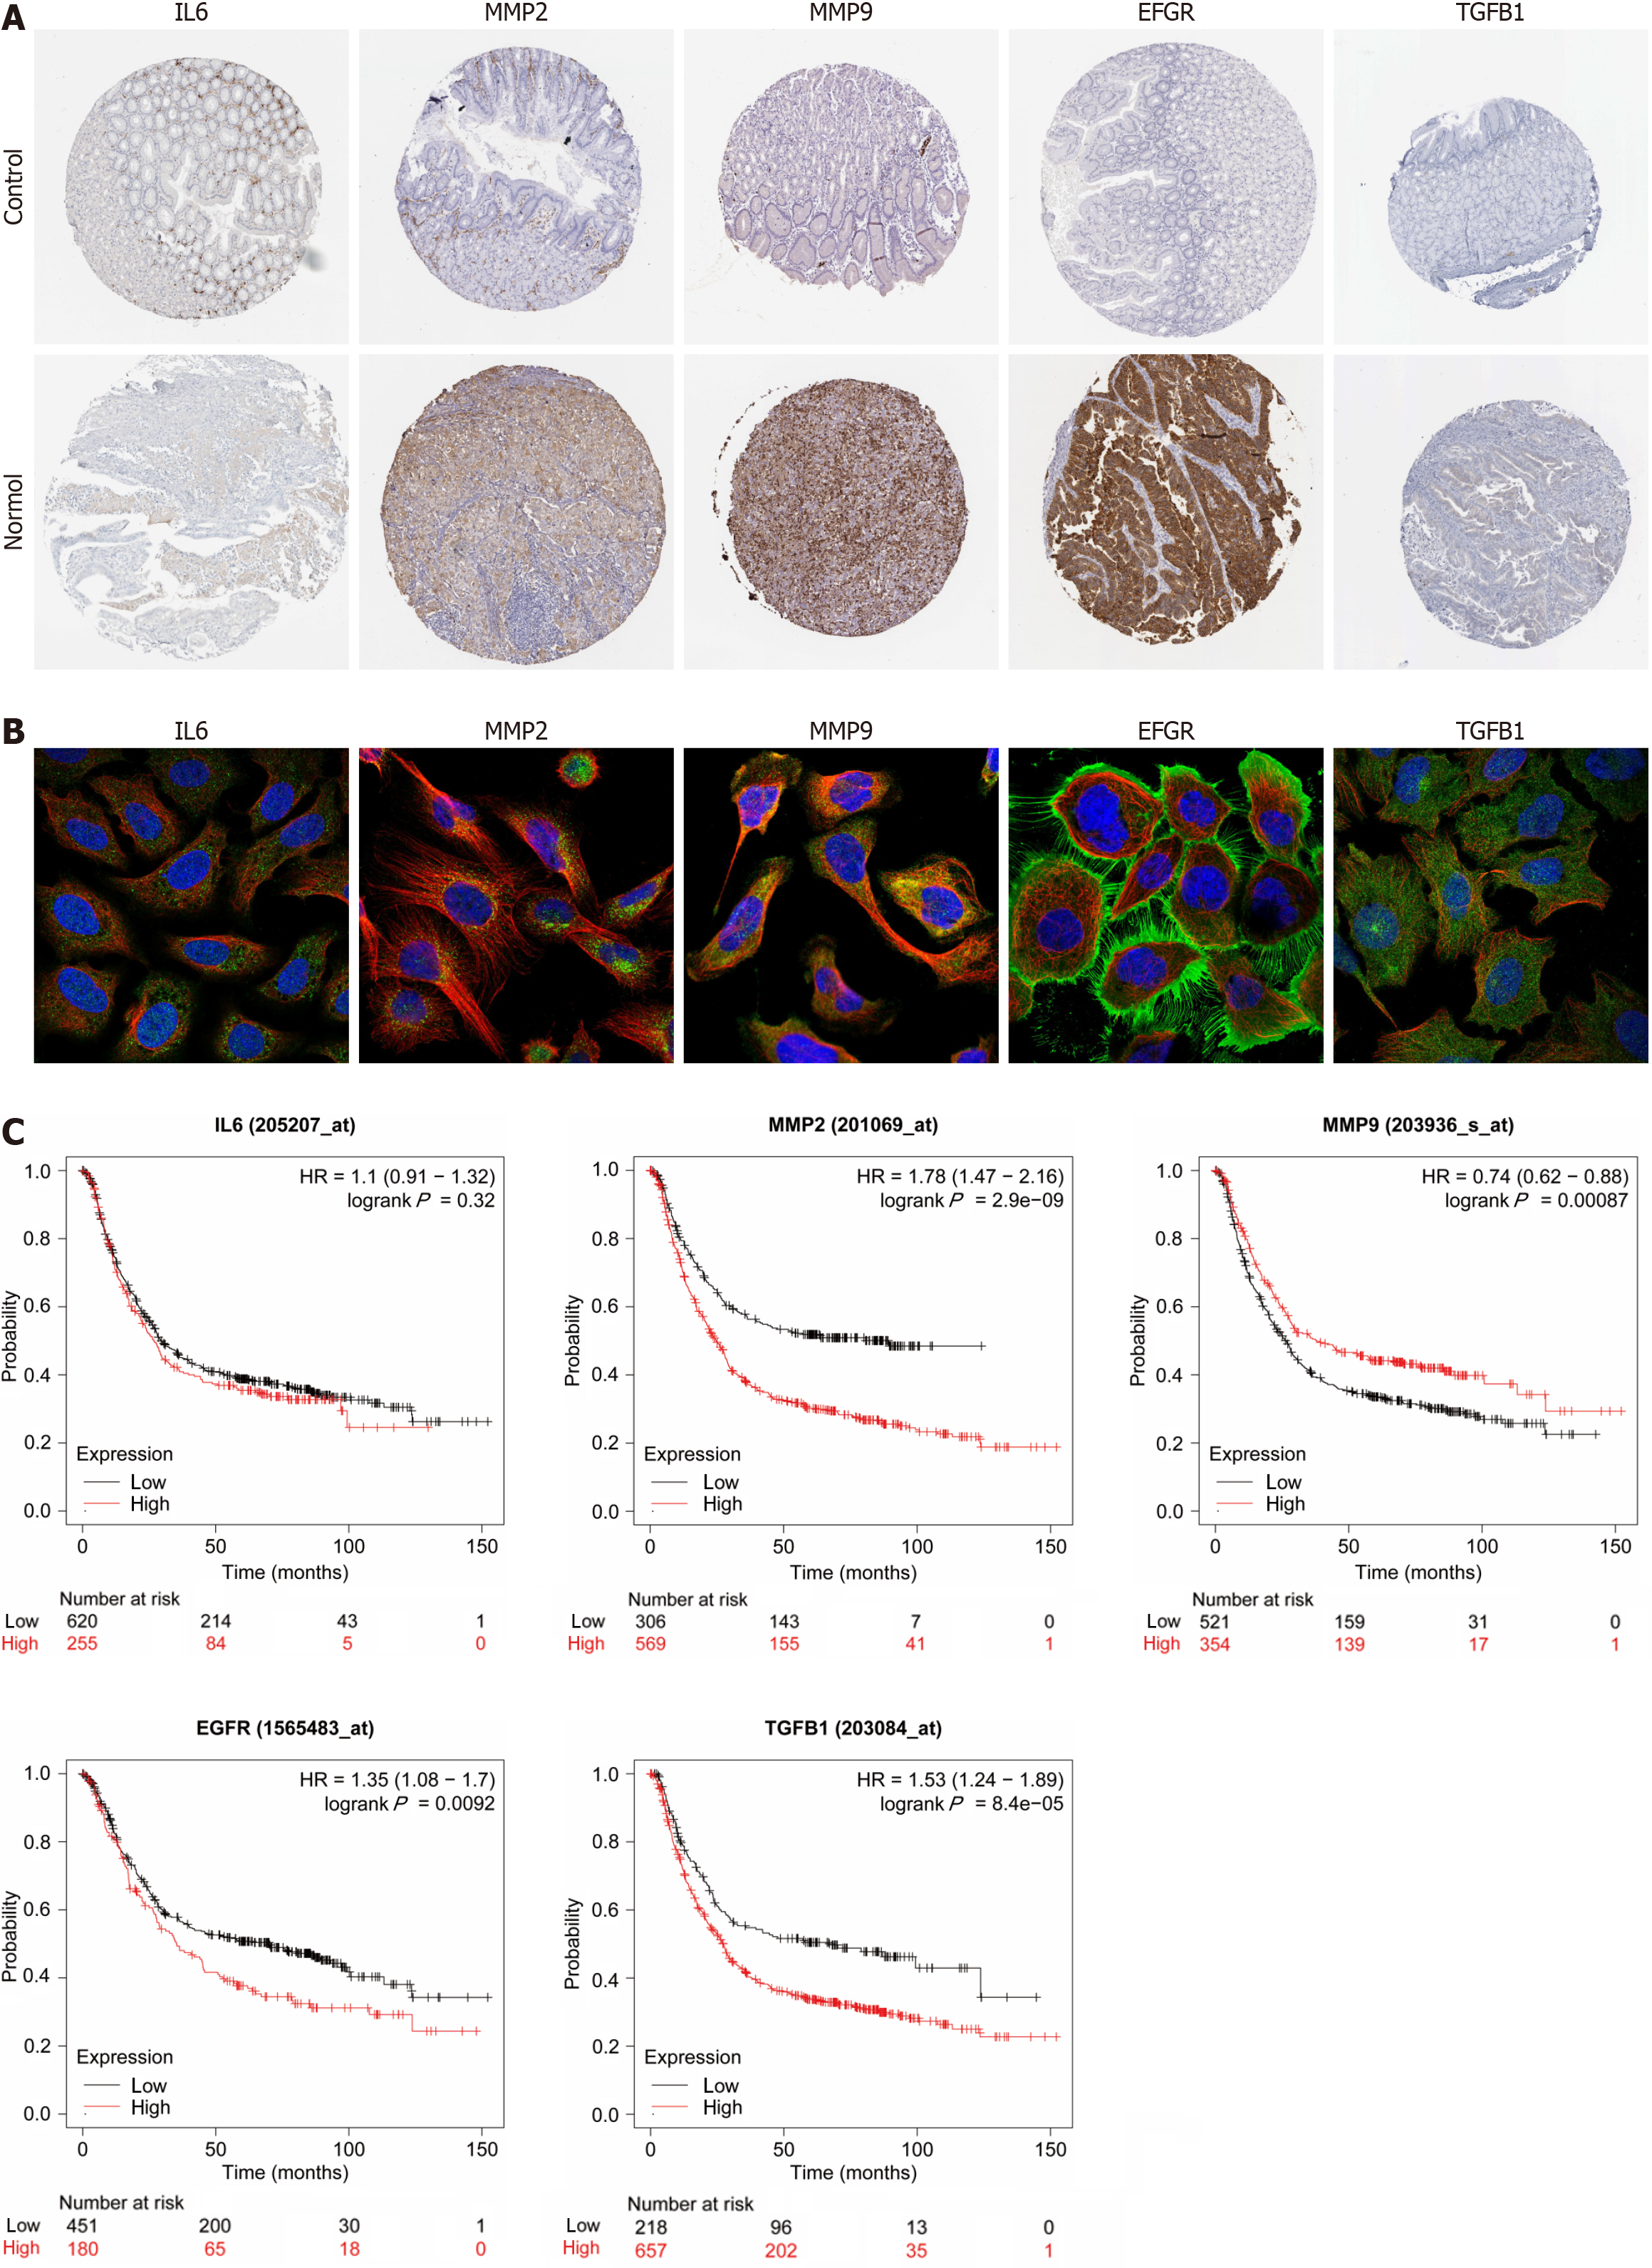
Figure 6 Expression and prognostic analysis of hub genes.
A: Immunohistochemistry of hub gene in normal and gastric adenocarcinoma tissue; B: Fluorescence localization map of hub genes in tumor tissues. Blue represents nucleus, red represents microtubule organization, and green represents hub genes; C: Survival curve diagram of hub genes. HR: Hazard ratio.
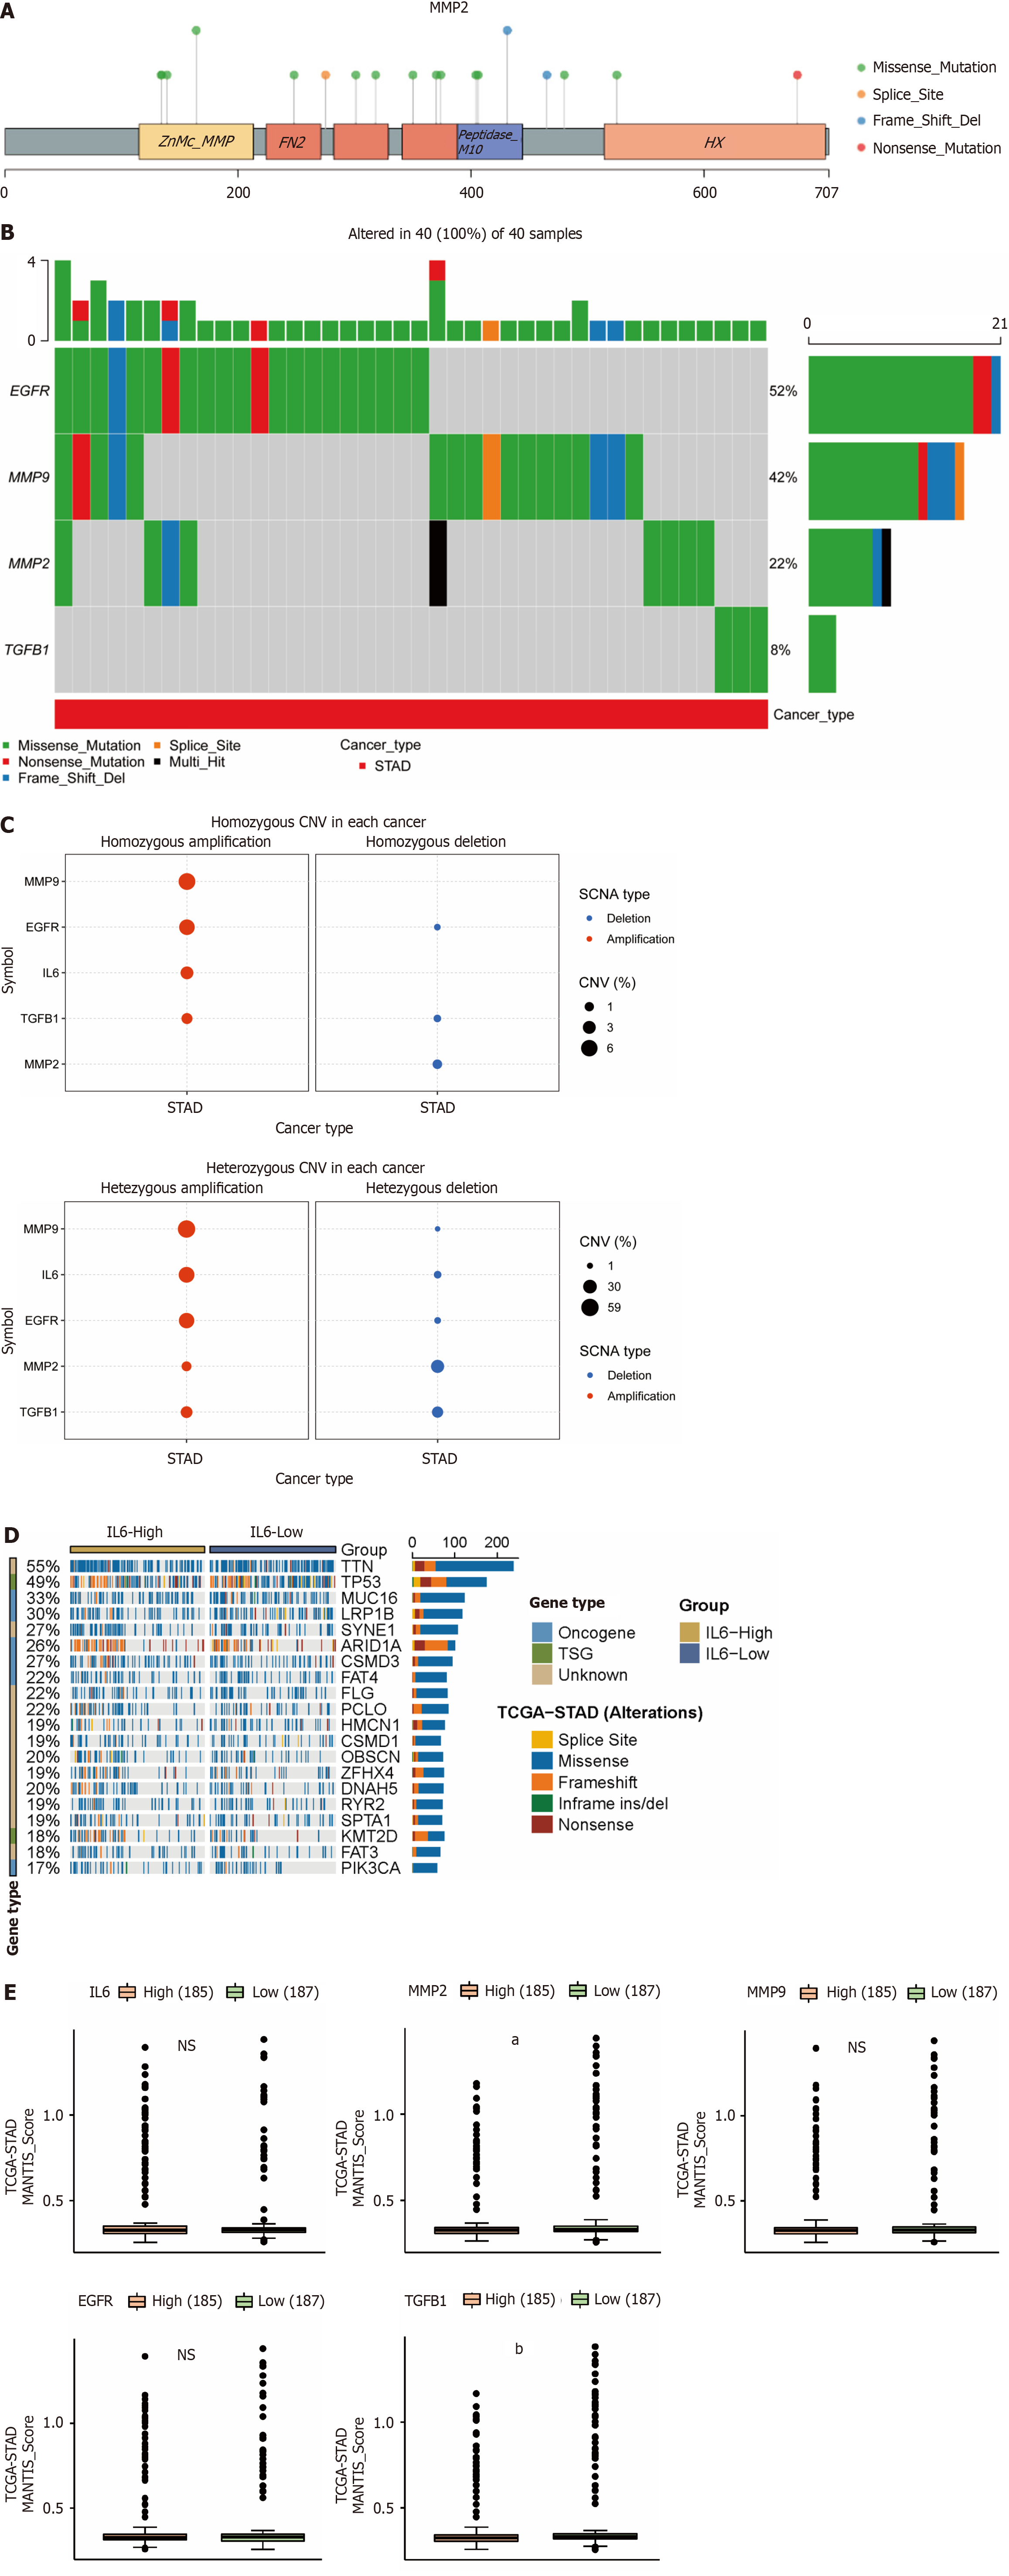
Figure 7 Effect of mutations in the hub genes on gastric cancer.
A: Single nucleotide variations (SNVs) mutation sites and types of MMP2; B: Waterfall plot of SNVs mutation frequency of hub genes; C: Bubble plots of heterozygous and pure heterozygous copy number variations mutations in the hub genes; D: Mutational associations of driver genes with IL6; E: Box plot of microsatellite instability expression levels of hub genes. aP ≤ 0.05; bP ≤ 0.001.
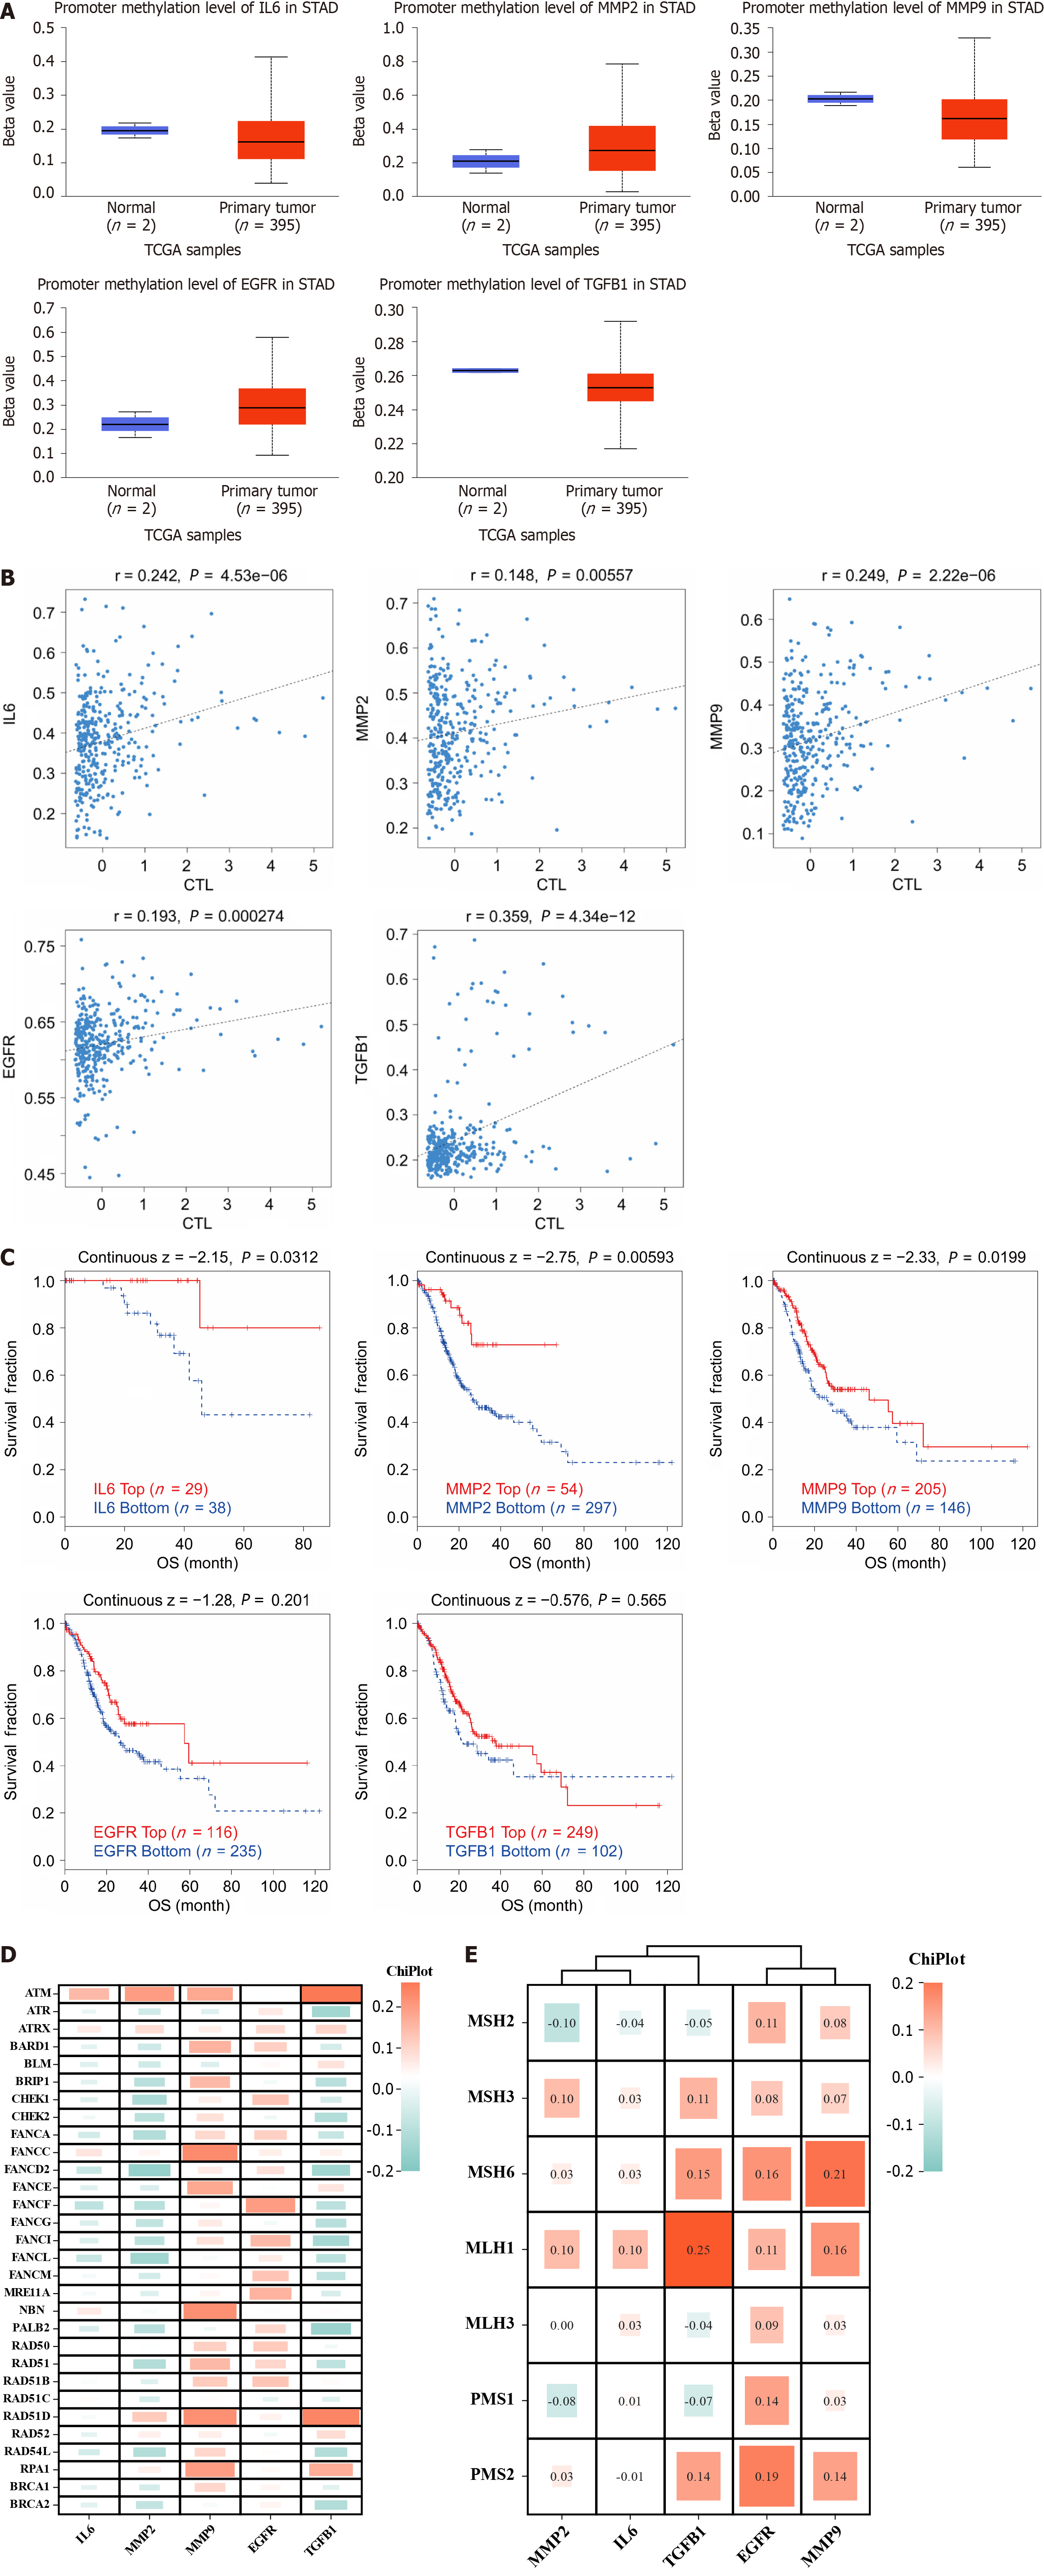
Figure 8 Hub genes are involved in epigenetic regulation and repair of damaged genes.
A: Expression level map of hub genes methylation. Blue and red represent the normal and cancer groups, respectively; B: Correlation between hub genes methylation levels and CTL markers; C: Survival curves of hypermethylated and hypomethylated subgroups of hub genes were plotted; D and E: Heatmap of correlation between hub genes and homologous recombination repair and mismatch repair repair systems; OS: Overall survival.
Figure 9 Relationship between hub genes and immune infiltration.
A: Immune cell infiltration in gastric cancer was calculated using CIBERSORT; B: Scatter plot of Stromal Score, Immune Score, ESTIMATE Score correlation of hub genes; C: Heatmap of correlation between hub genes and immune checkpoints; D: Single-cell sequencing (top) and single-cell annotation map (bottom) of hub genes; E: Hub genes correlates with macrophage, endothelial cell, tumor-associated fibroblast, and CD8T cell infiltration. aP ≤ 0.05; bP ≤ 0.01; cP ≤ 0.001; dP ≤ 0.001.
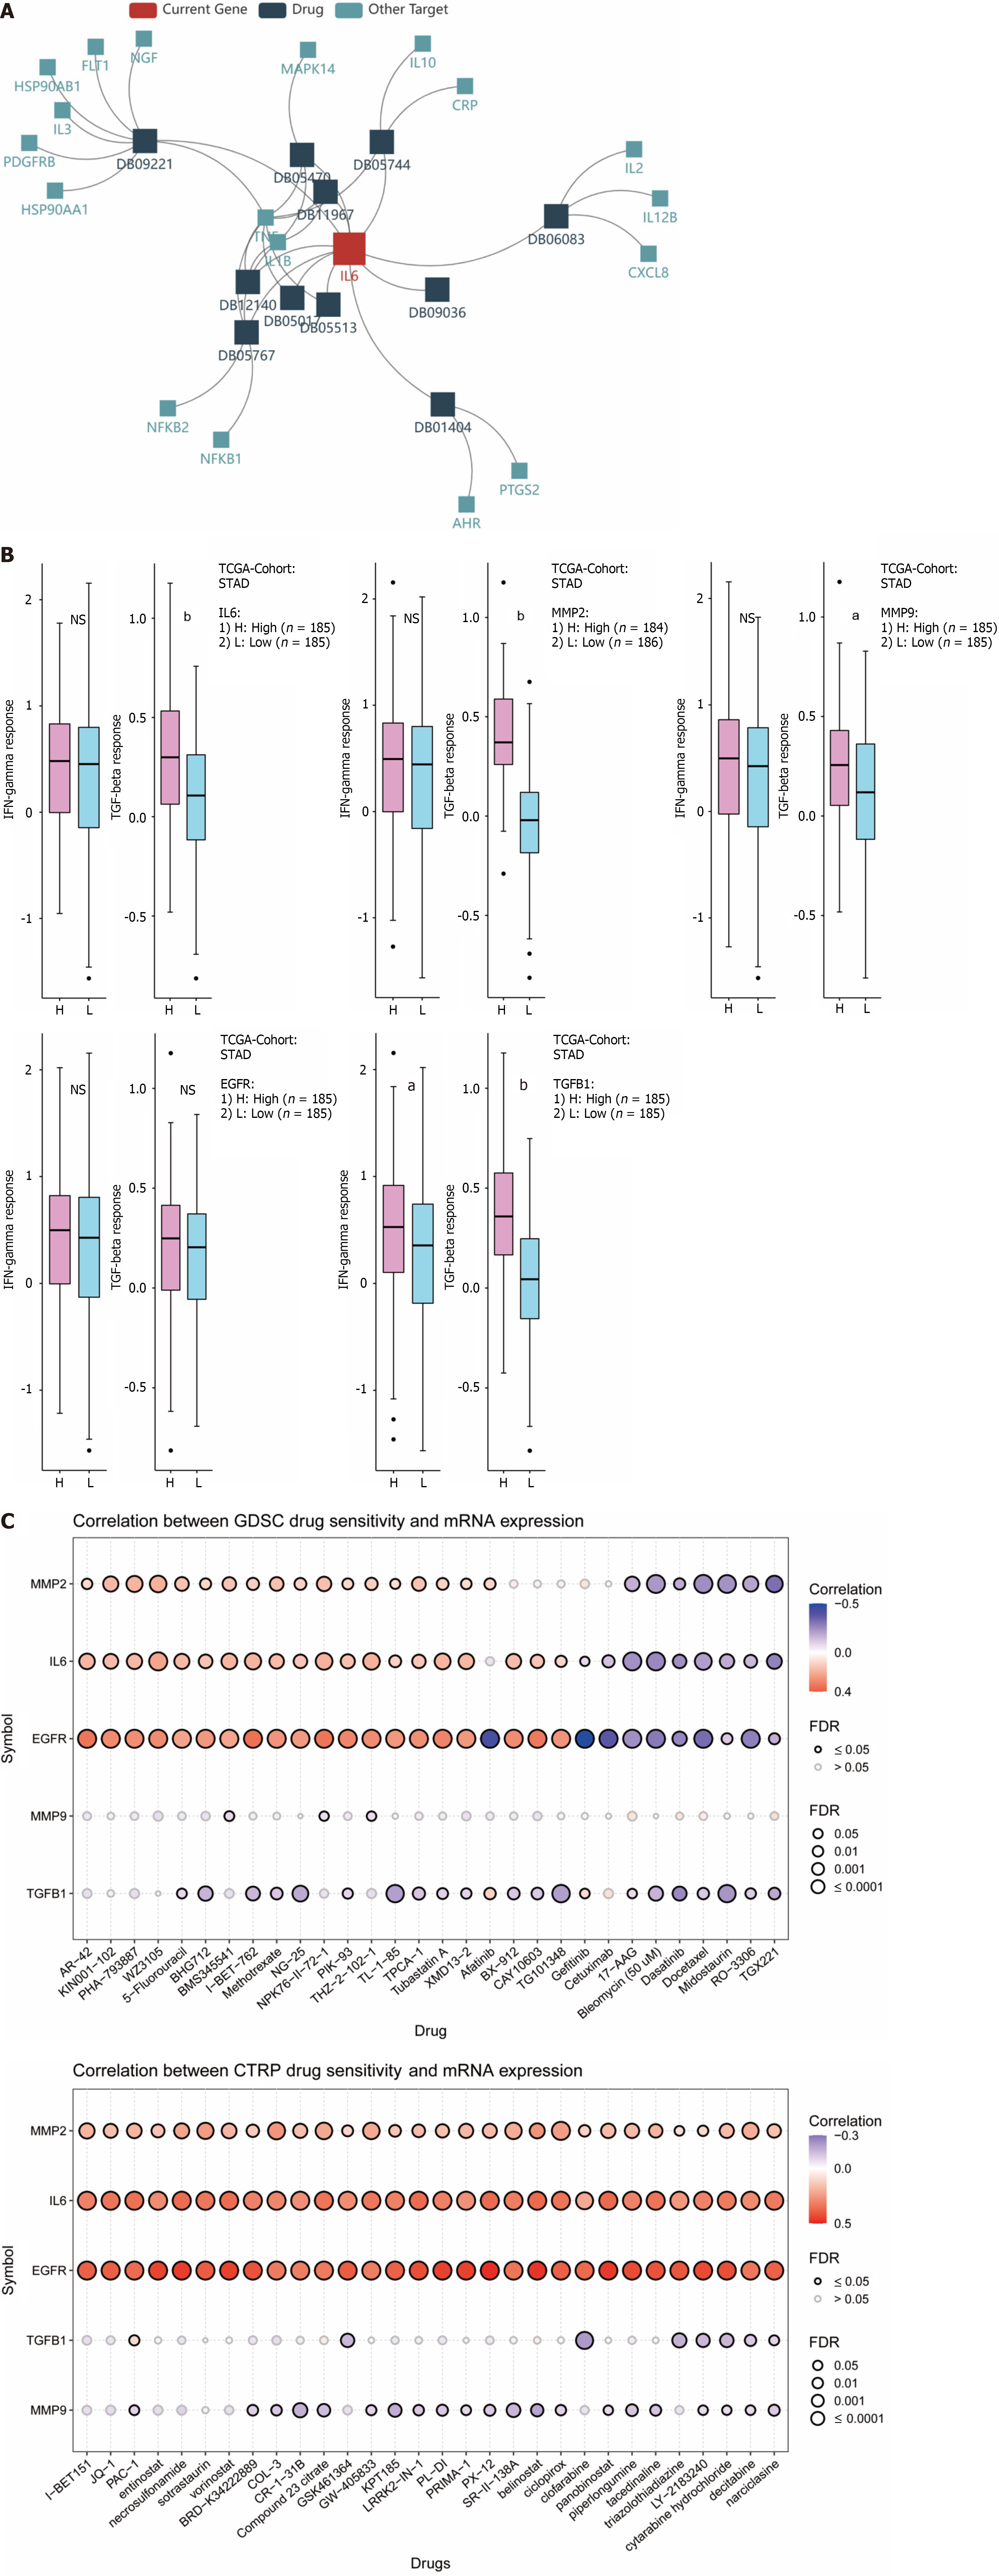
Figure 10 Association of hub genes with anti-cancer drug therapy.
A: Network diagram of IL6 and immunotherapy; B: Association of 5 hub genes expression levels with INF-γ, TGF-β; C: Correlation of hub genes with immunotherapy. aP ≤ 0.01; bP ≤ 0.0001; NS: Not significant.
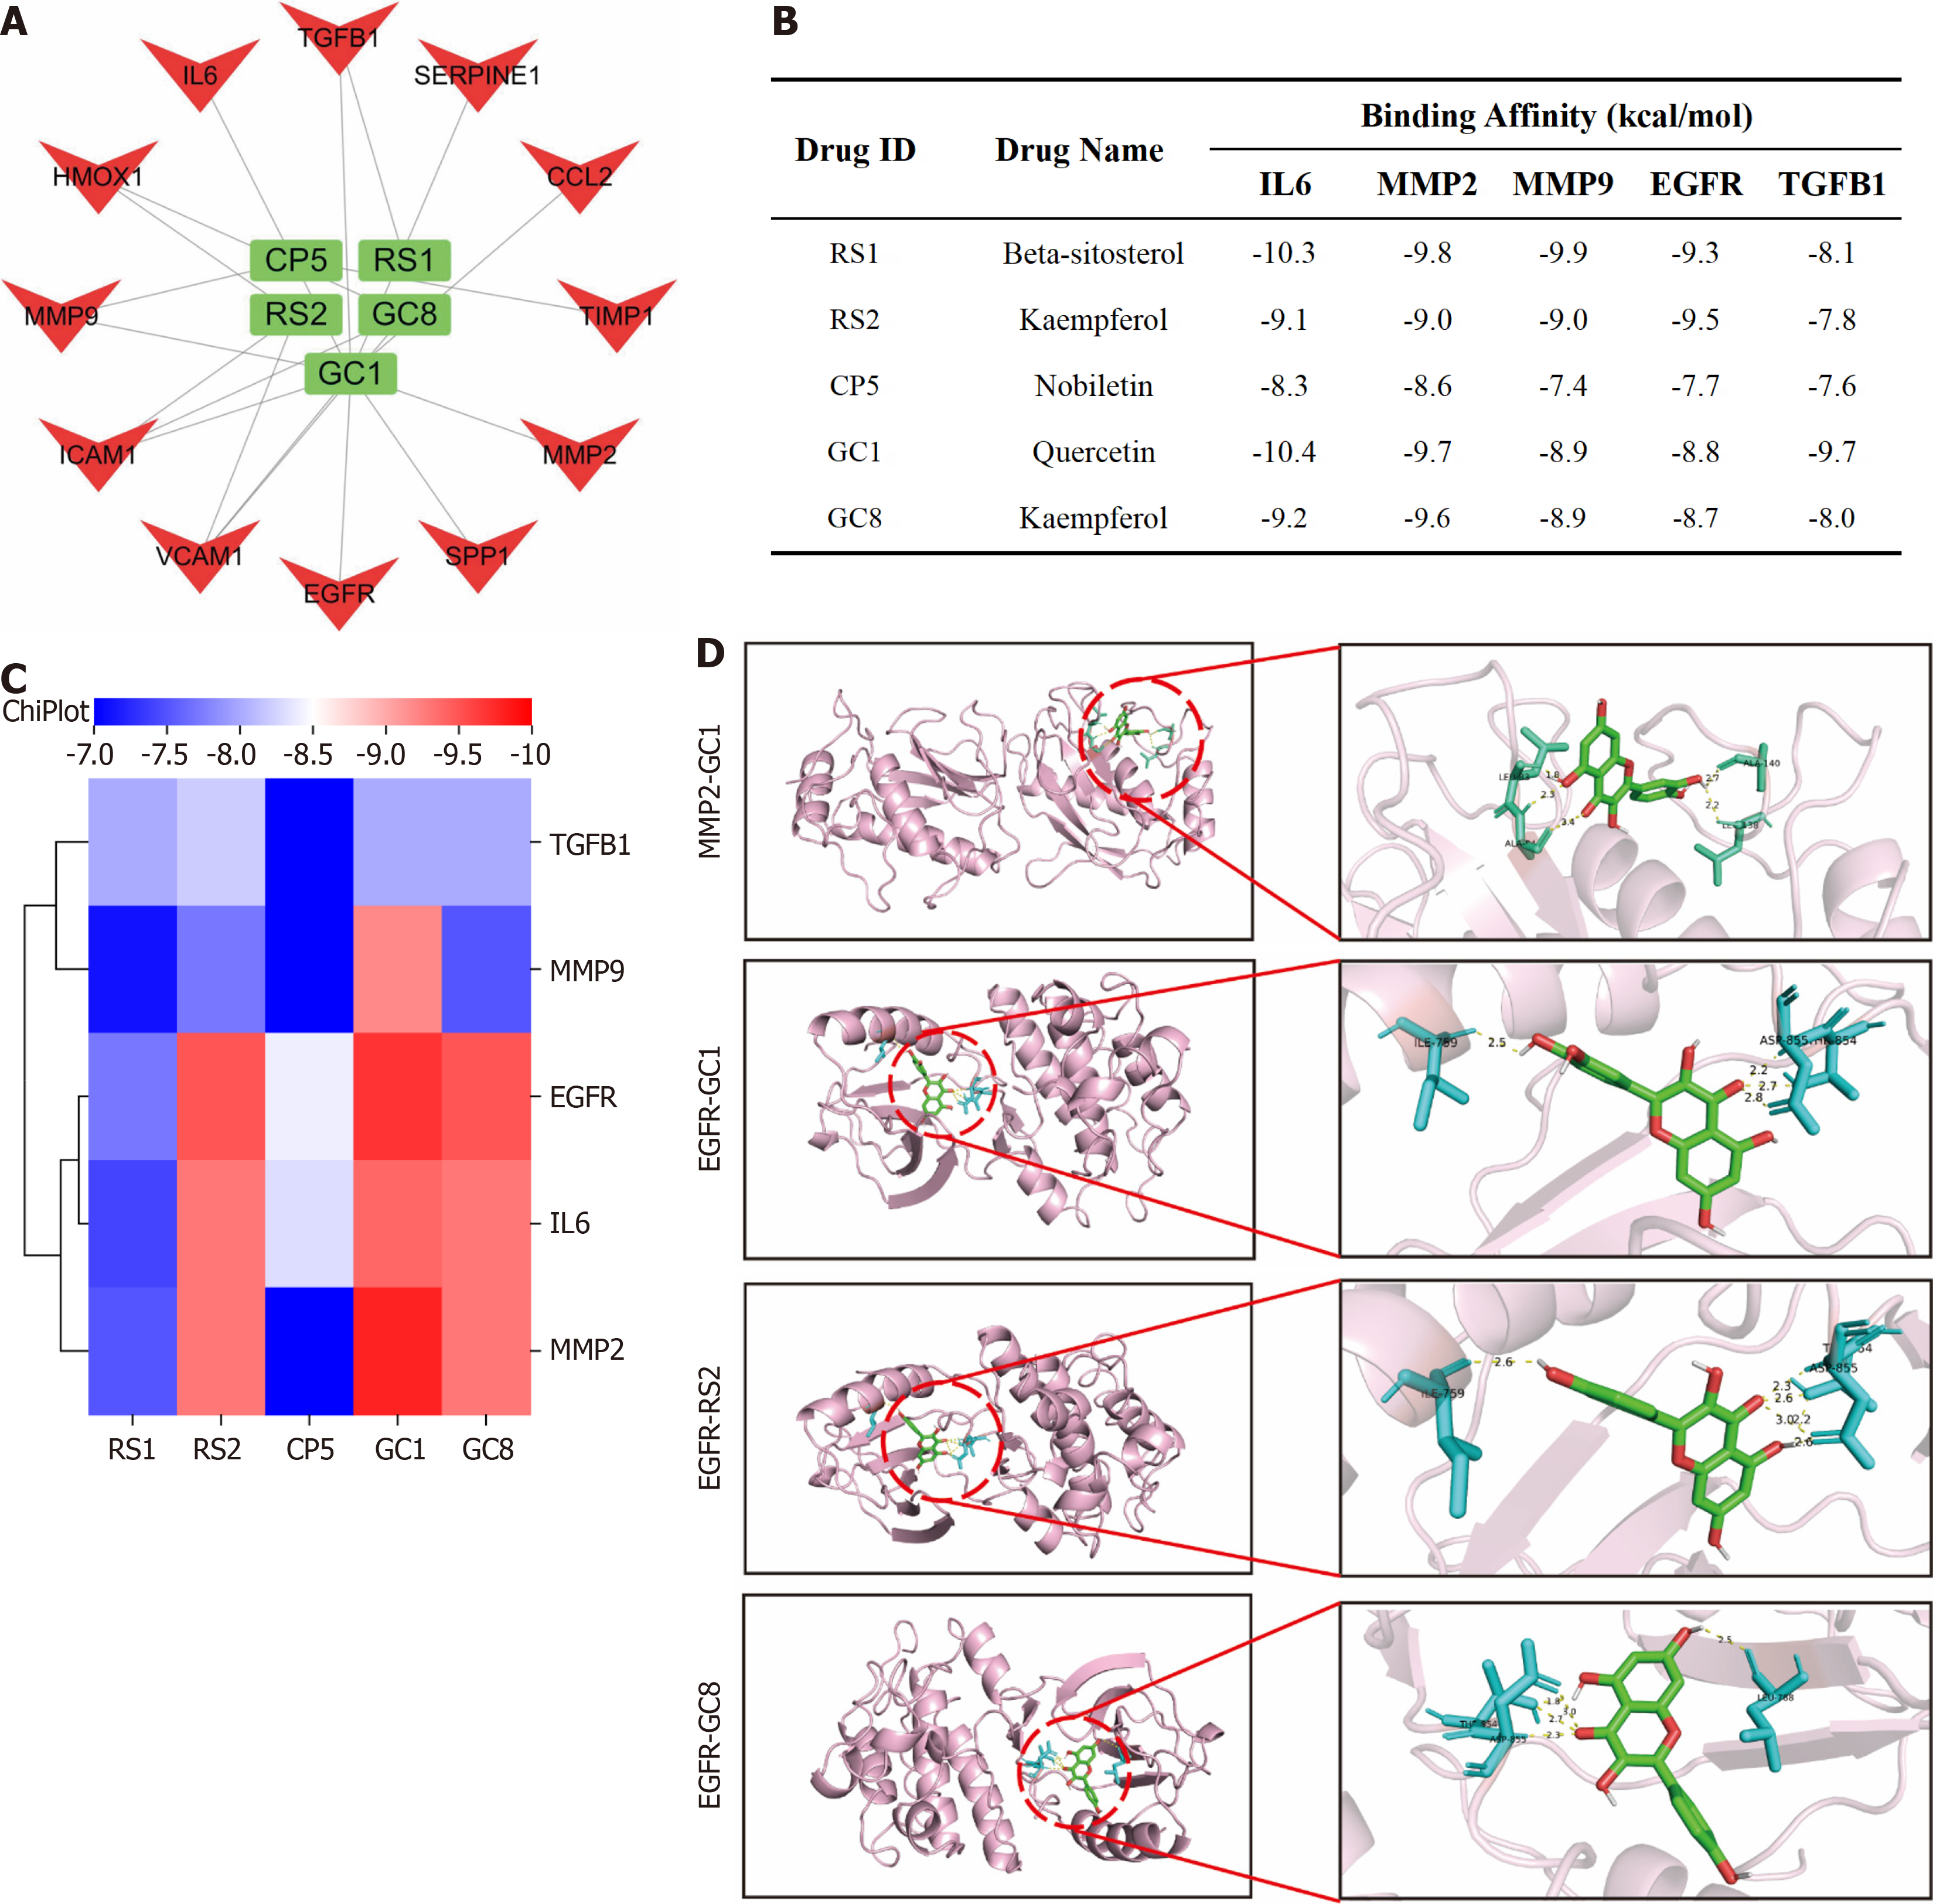
Figure 11 Molecular docking of hub genes with active ingredients.
A: Screening of core active ingredients exerting anti-gastric cancer therapeutic effects; B and C: Molecular docking binding energy of hub genes and core active ingredients; D: Visual demonstration of partial molecular docking.
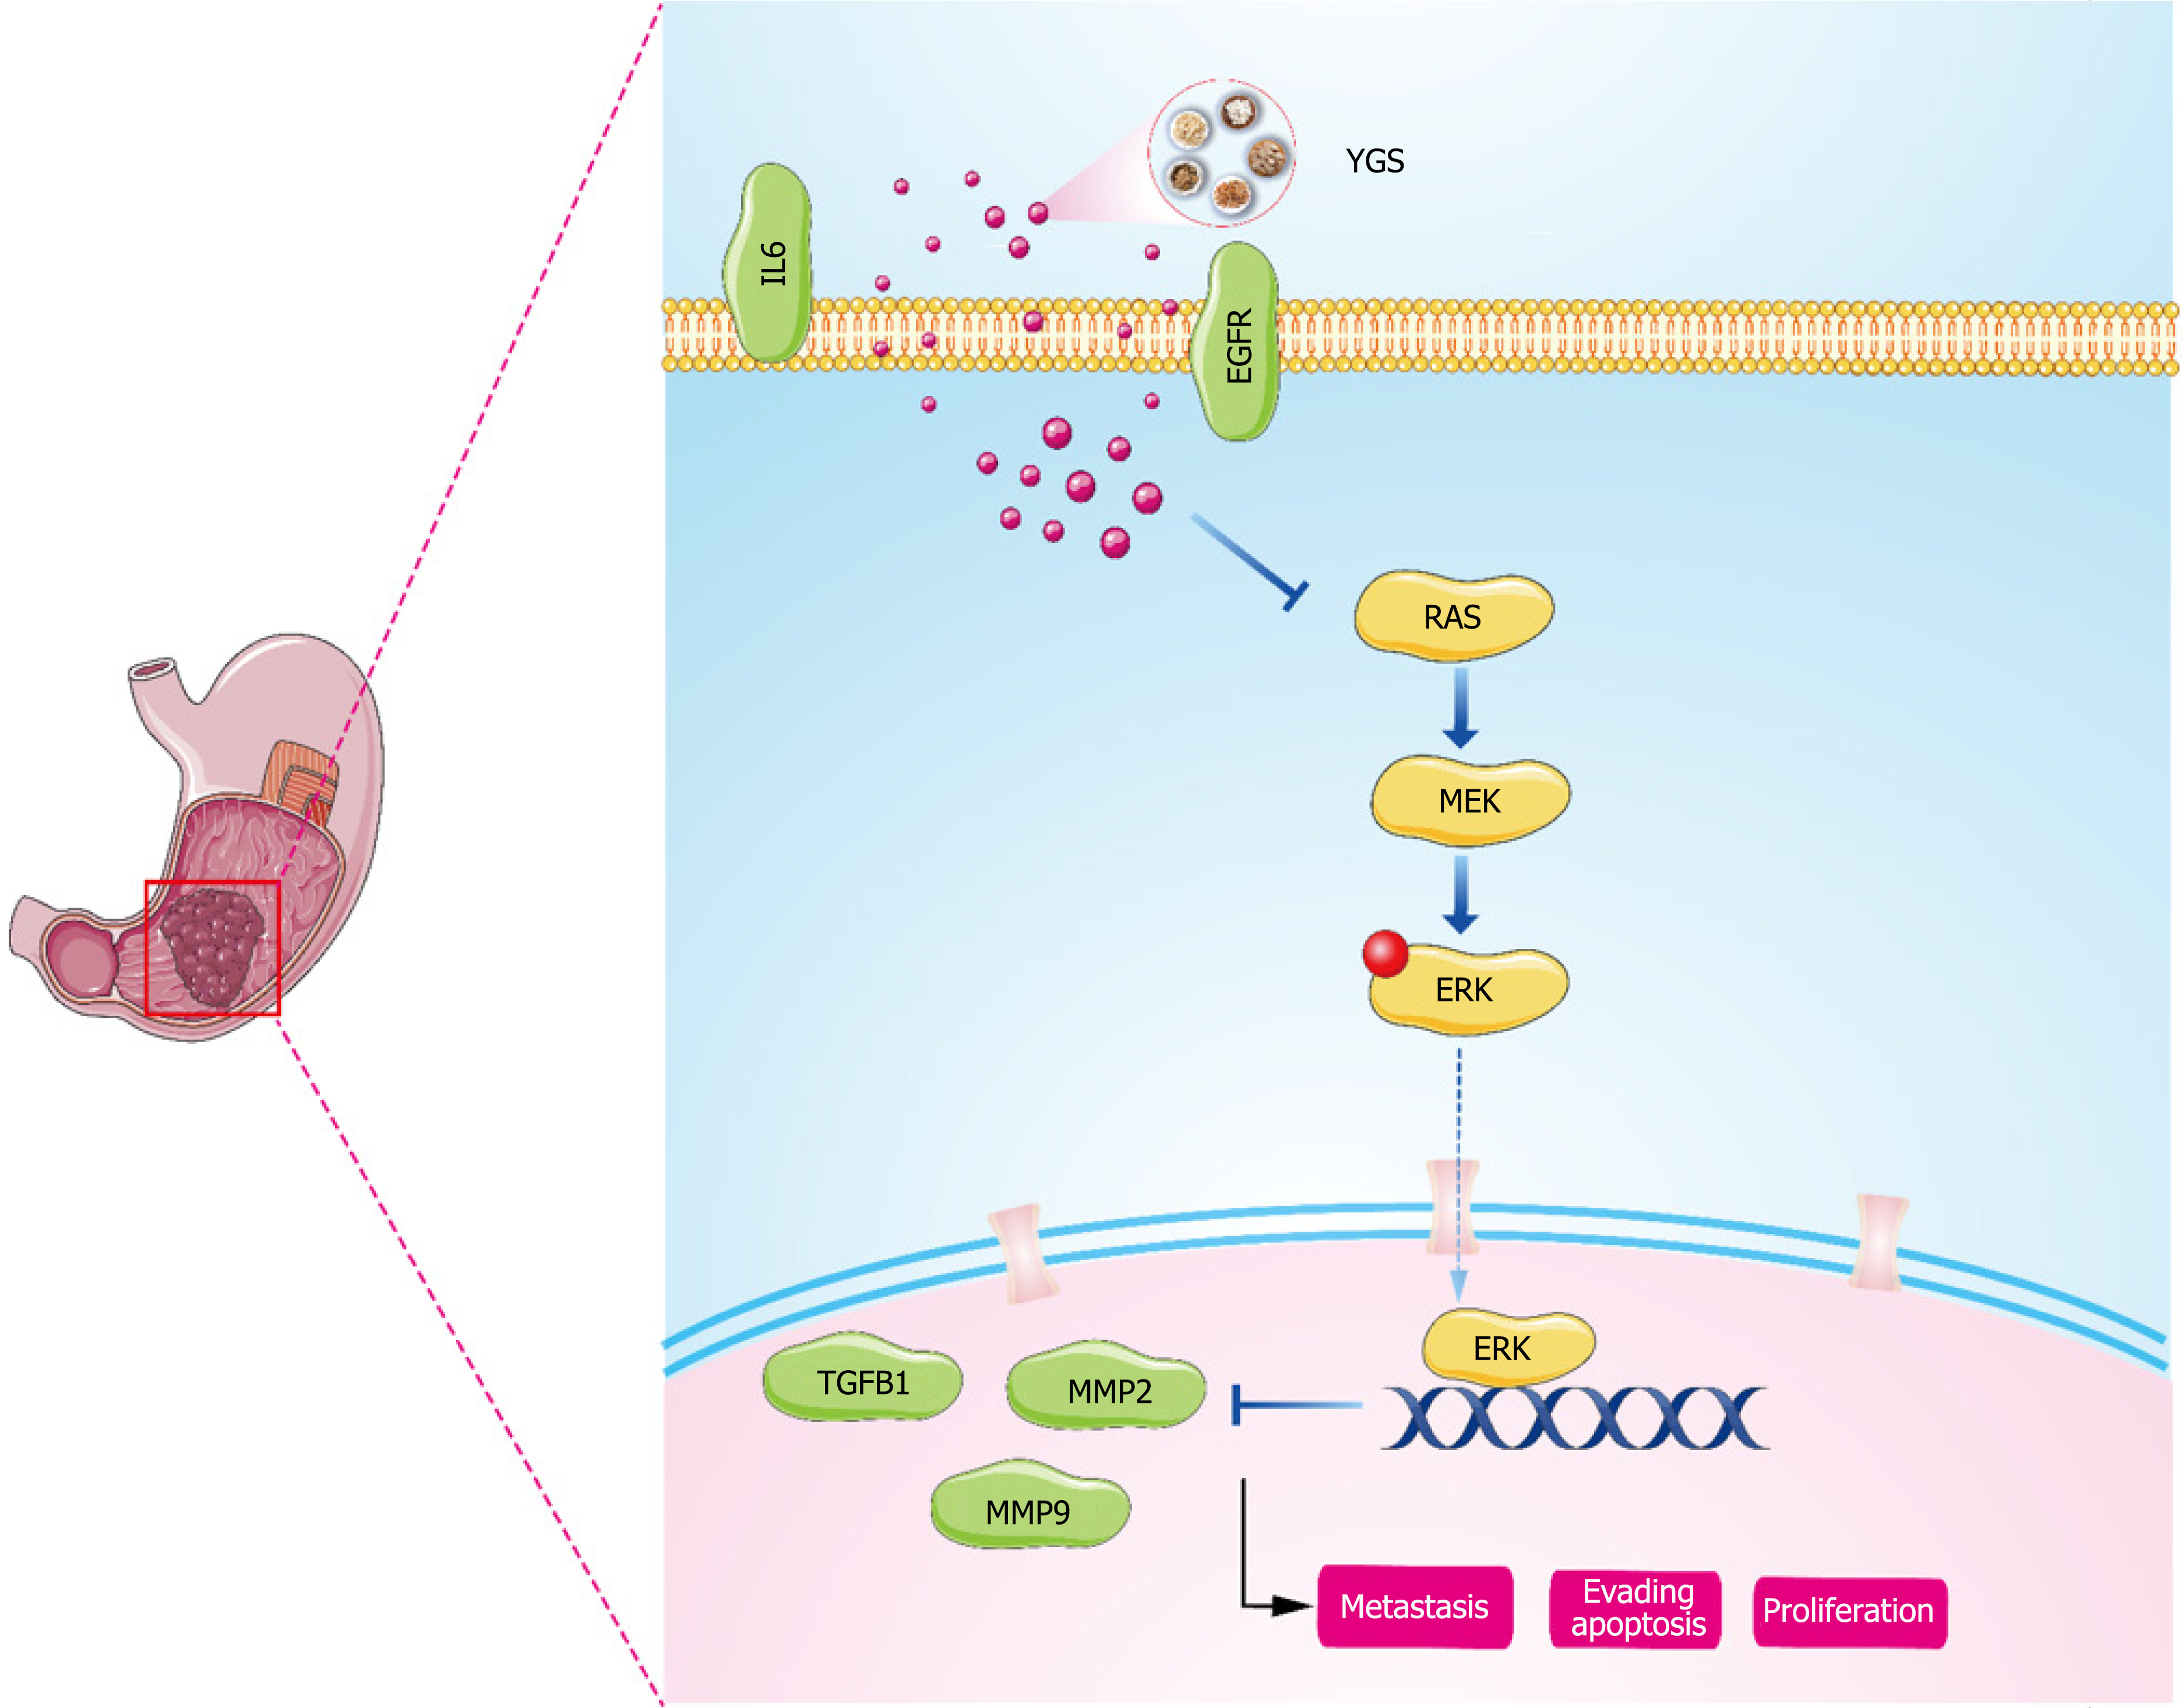
Figure 12 Mechanism diagram of Yigong San anti-gastric cancer.
YGS: Yigong San.
- Citation: Lu DD, Yuan L, Wang ZZ, Zhao JJ, Du YH, Ning N, Chen GQ, Huang SC, Yang Y, Zhang Z, Nan Y. To explore the mechanism of Yigong San anti-gastric cancer and immune regulation. World J Gastrointest Oncol 2024; 16(5): 1965-1994
- URL: https://www.wjgnet.com/1948-5204/full/v16/i5/1965.htm
- DOI: https://dx.doi.org/10.4251/wjgo.v16.i5.1965


