Copyright
©The Author(s) 2024.
World J Gastrointest Oncol. May 15, 2024; 16(5): 1947-1964
Published online May 15, 2024. doi: 10.4251/wjgo.v16.i5.1947
Published online May 15, 2024. doi: 10.4251/wjgo.v16.i5.1947
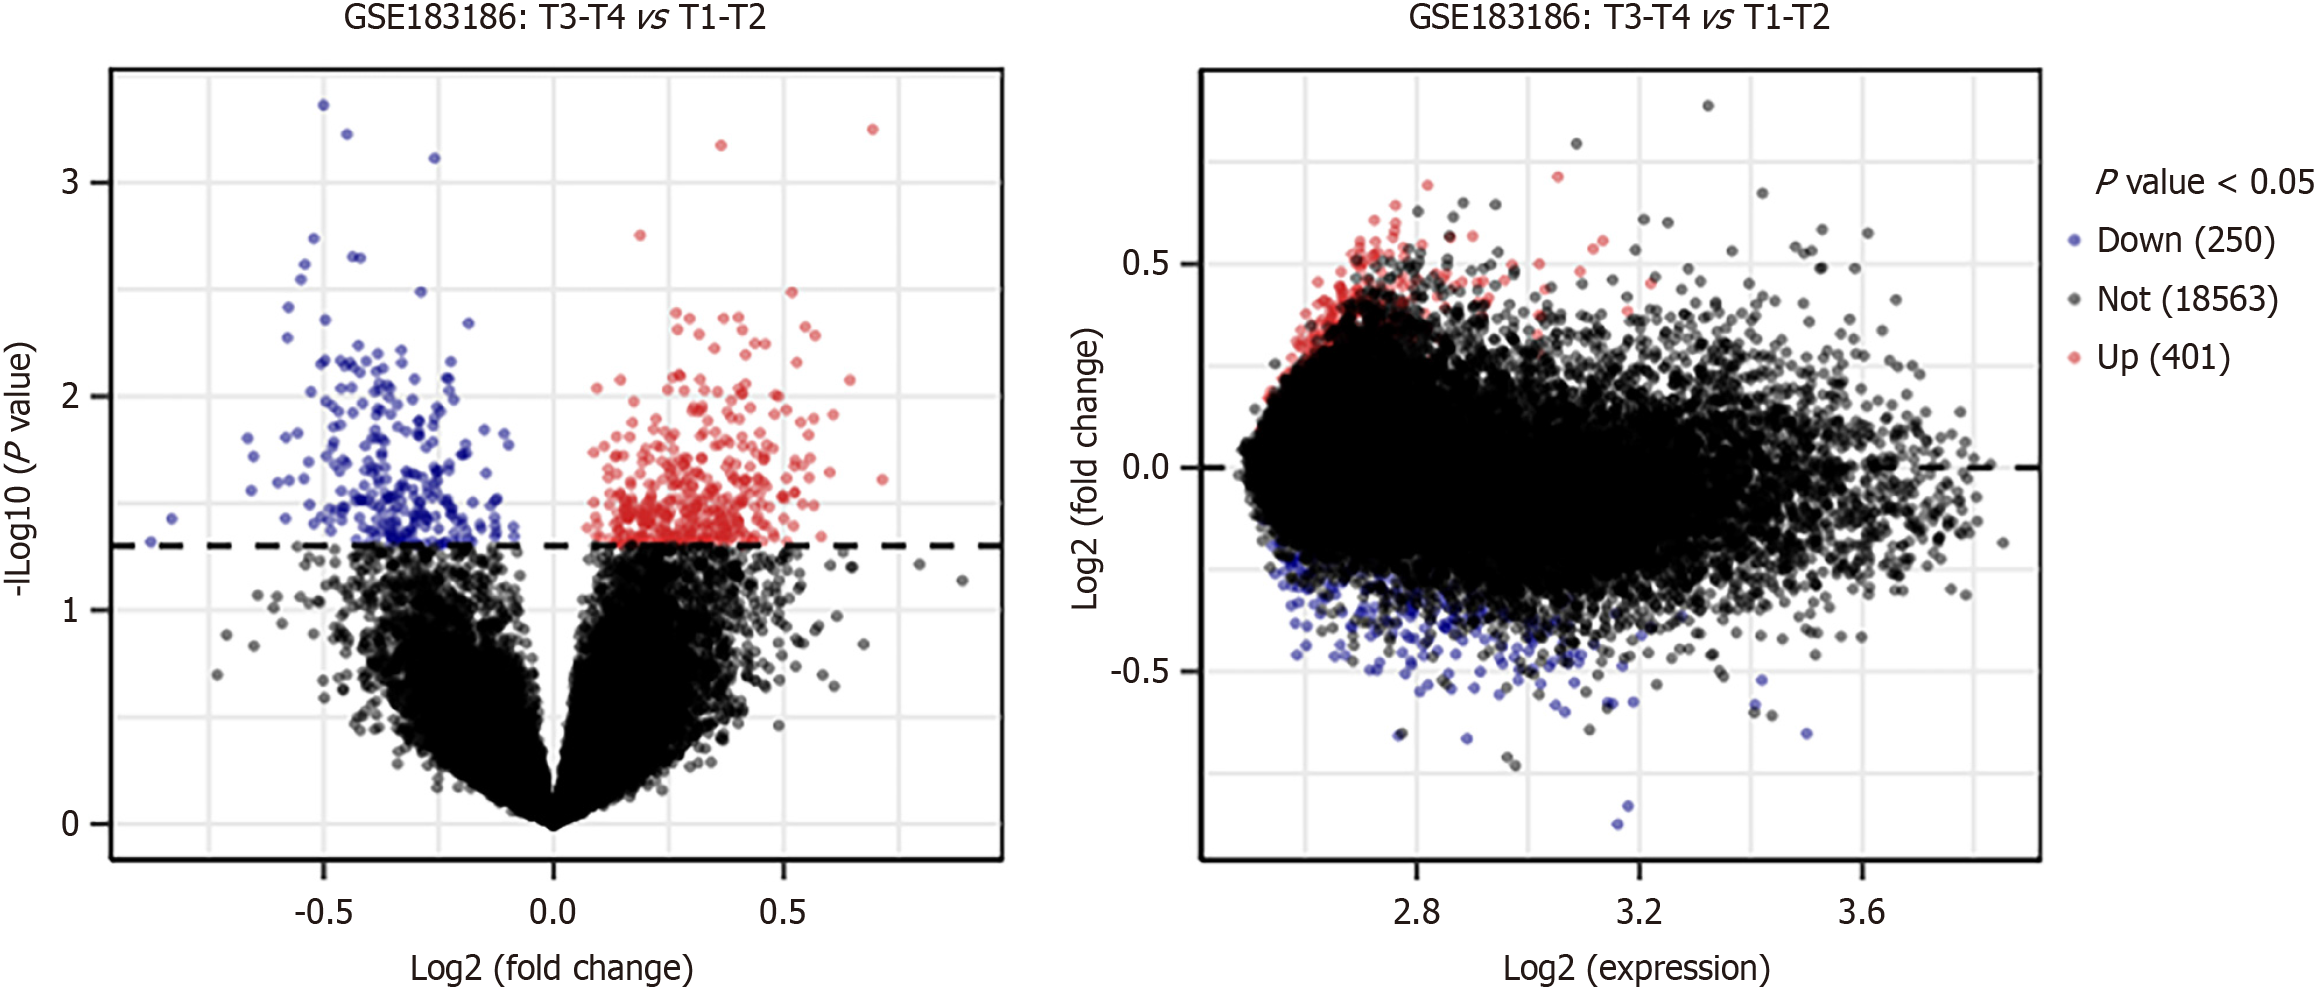
Figure 1 Volcano plots of differentially expressed genes between the tumor samples of stage III to stage IV and the tumor samples of stage I to stage II.
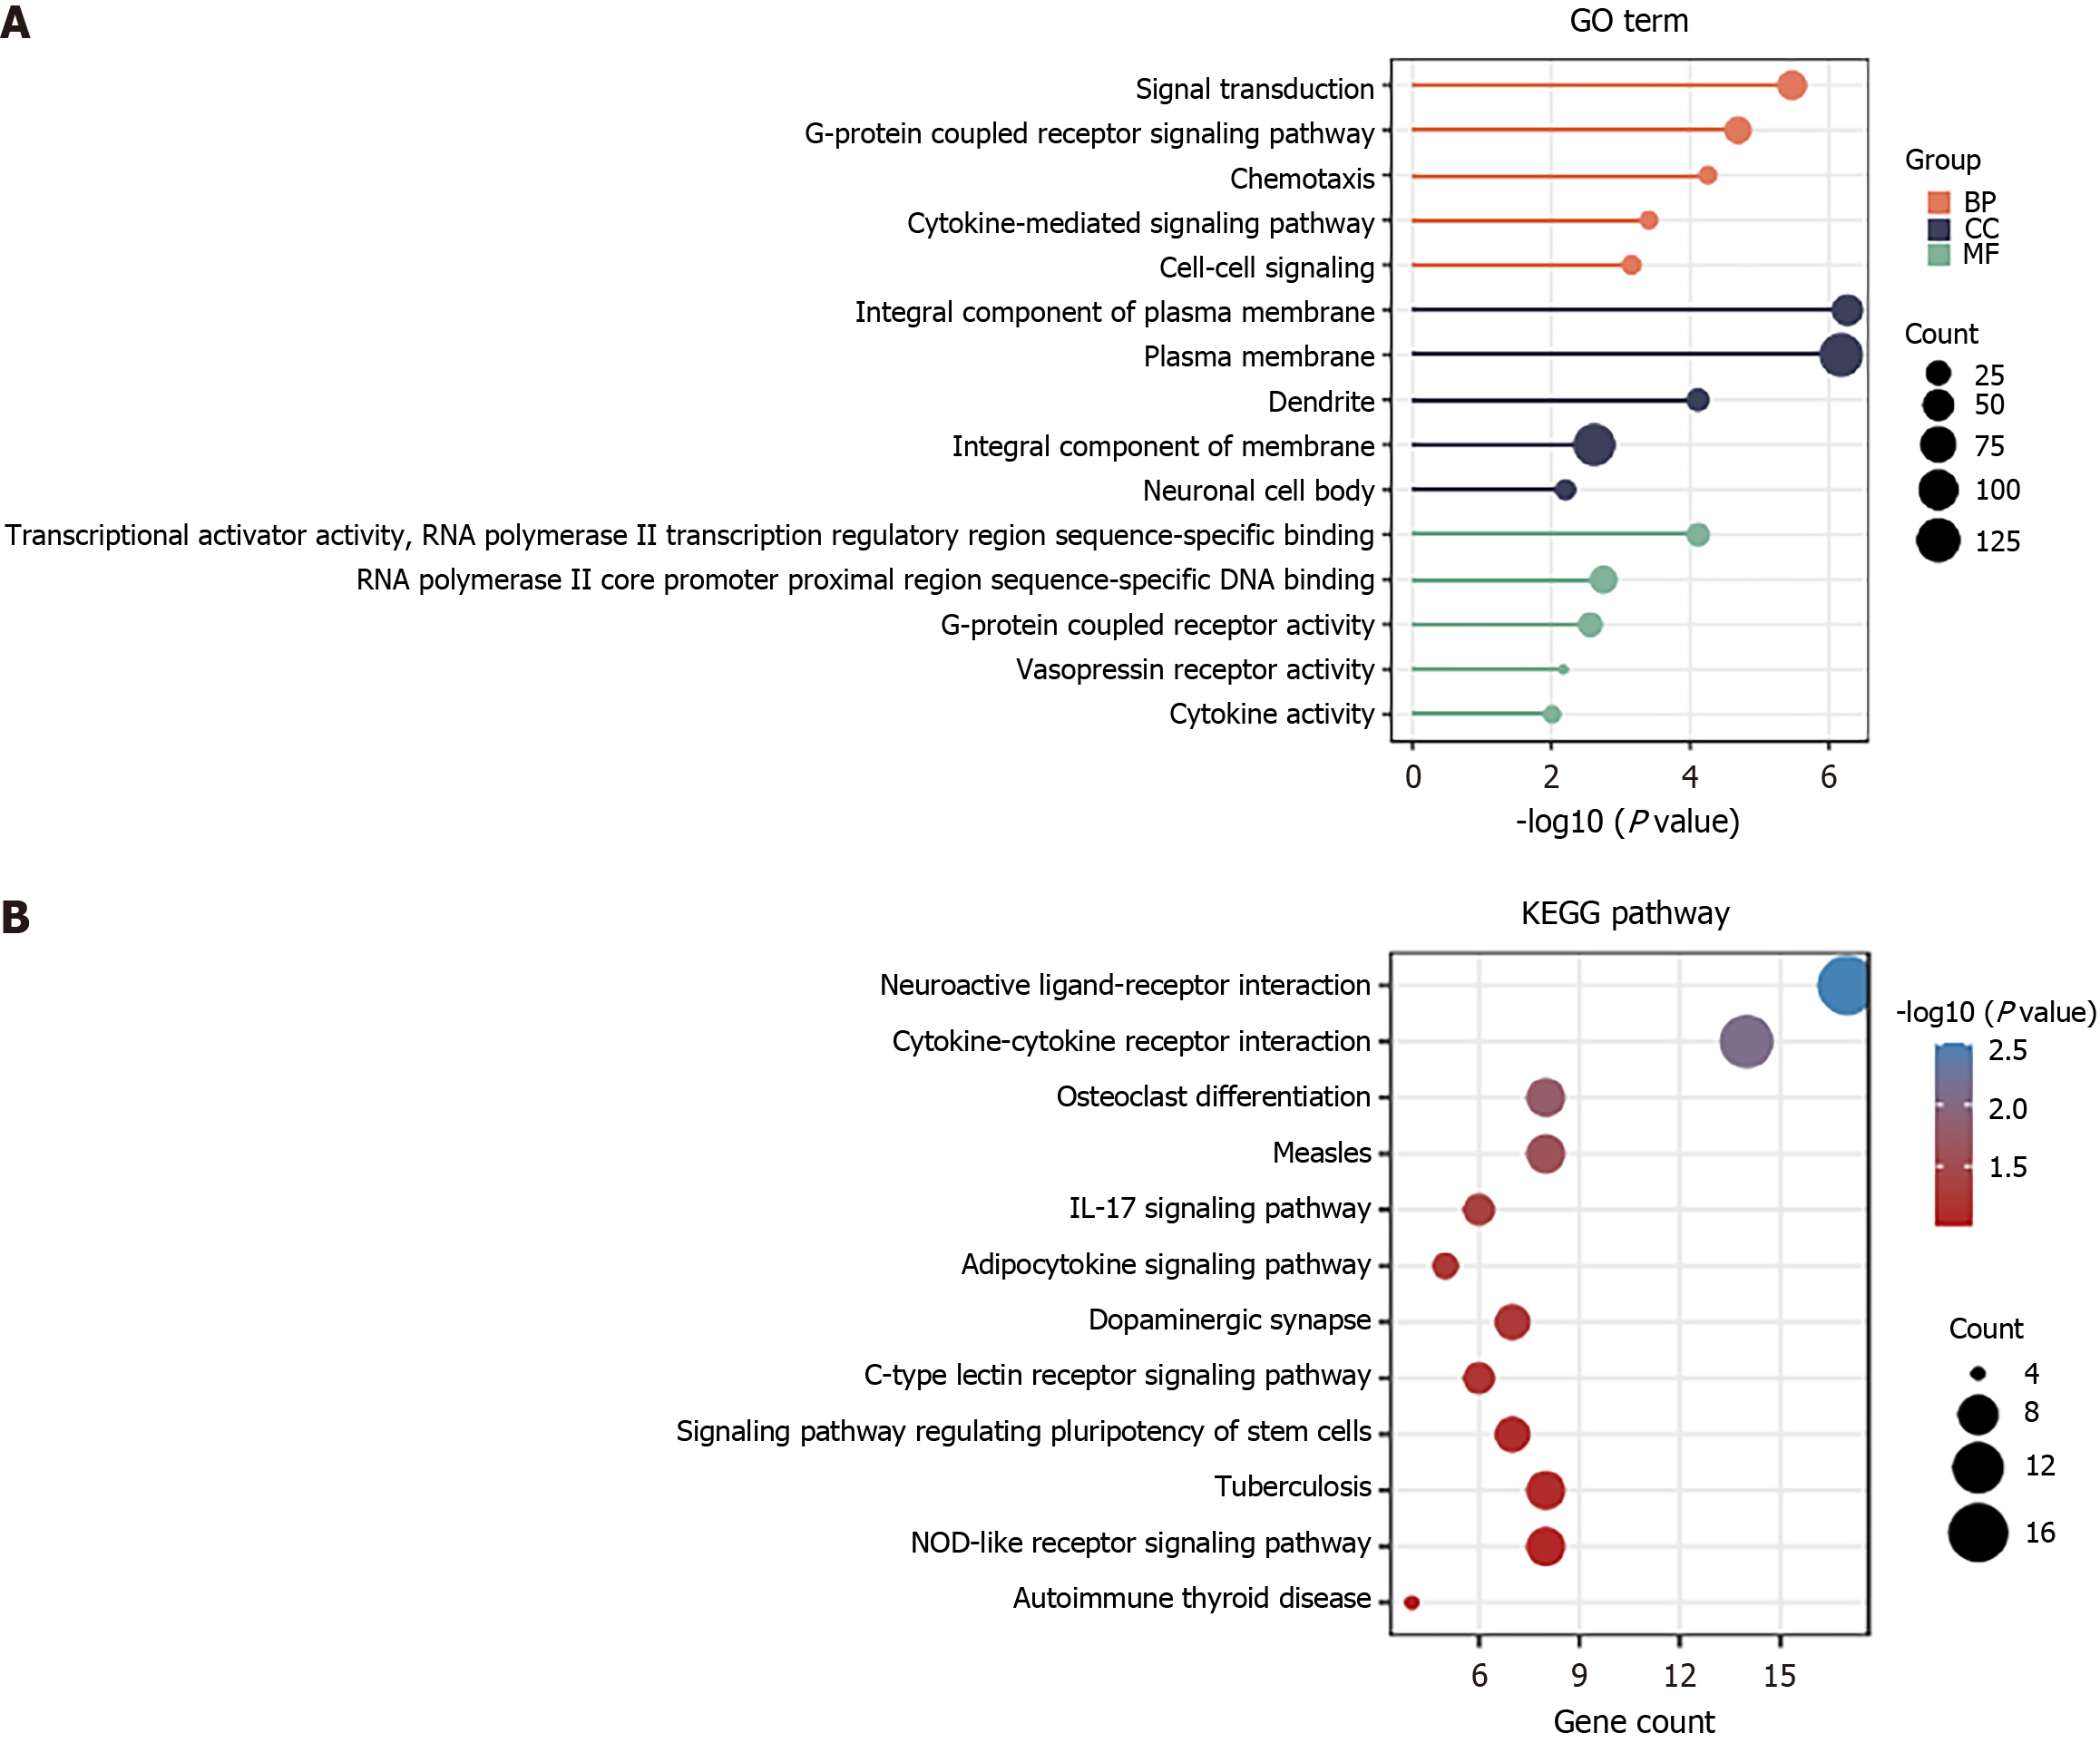
Figure 2 Functional analysis of upregulated genes.
A: Upregulated genes were analyzed by Gene Ontology terms; B: The top 12 pathways enriched with upregulated genes. BP: Biological process; CC: Cellular component; MF: Molecular function.
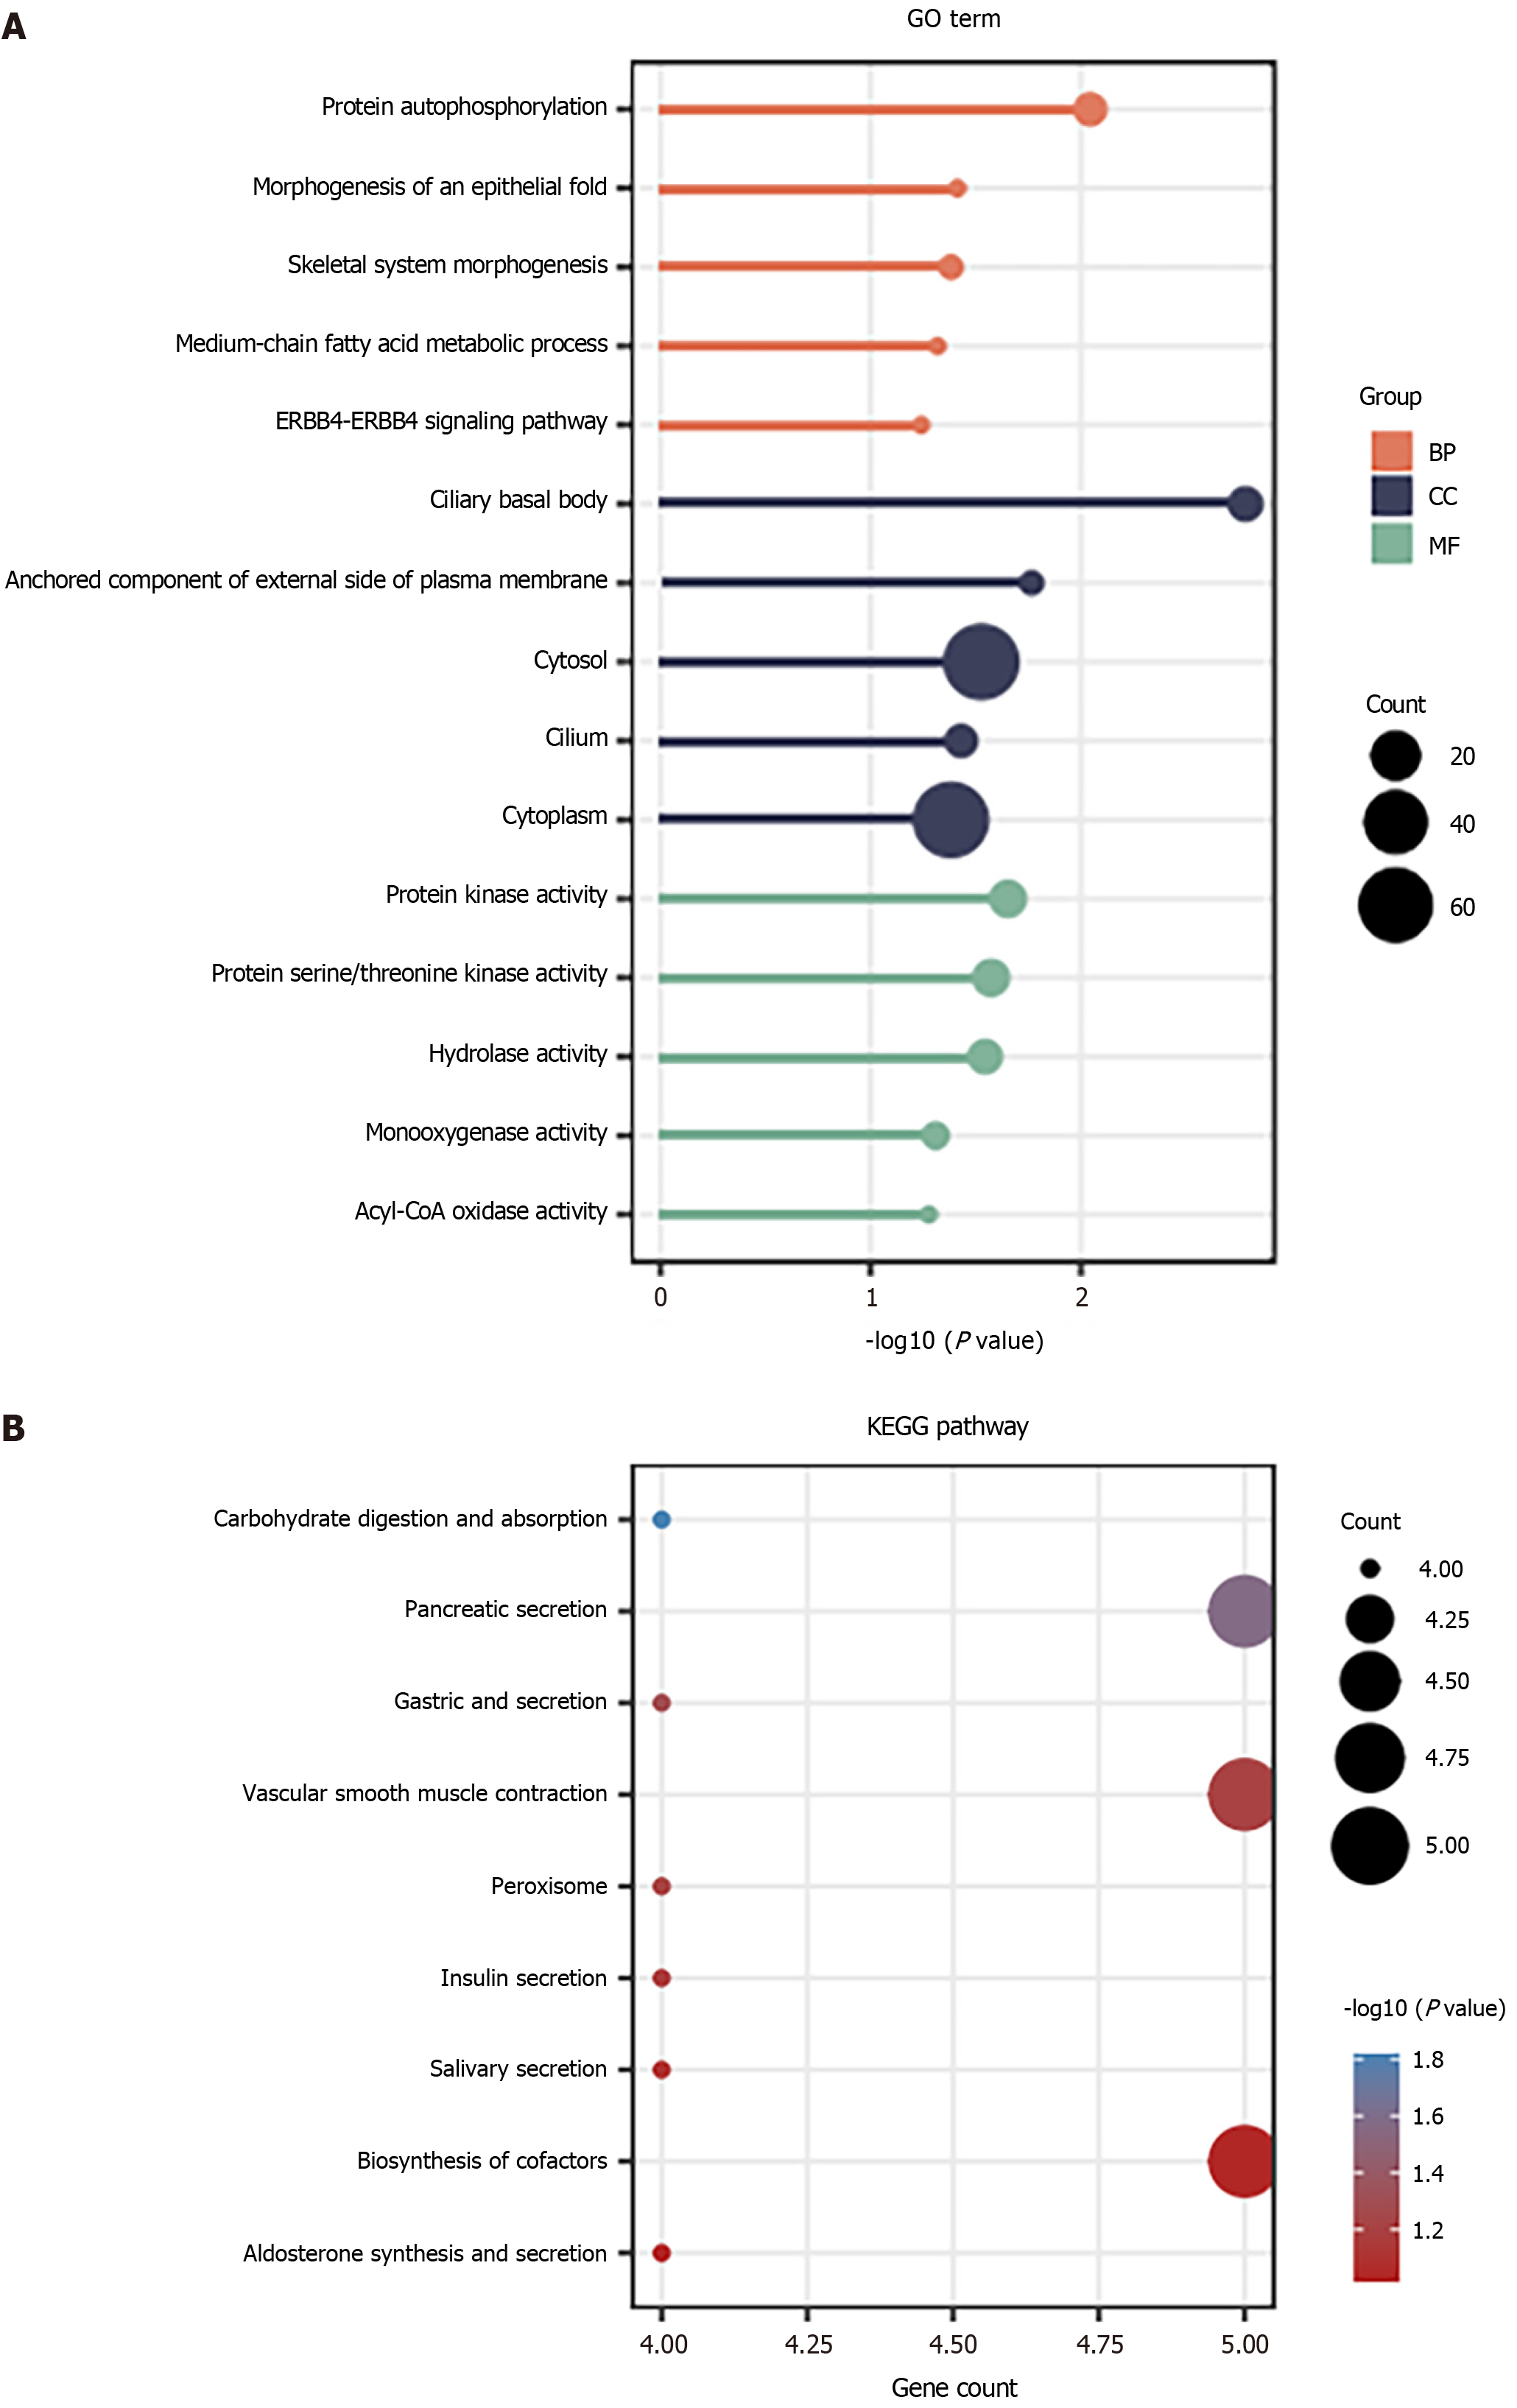
Figure 3 Functional analysis of downregulated genes.
A: Downregulated genes were analyzed by Gene Ontology terms; B: The top 9 pathways enriched with downregulated genes. BP: Biological process; CC: Cellular component; MF: Molecular function.
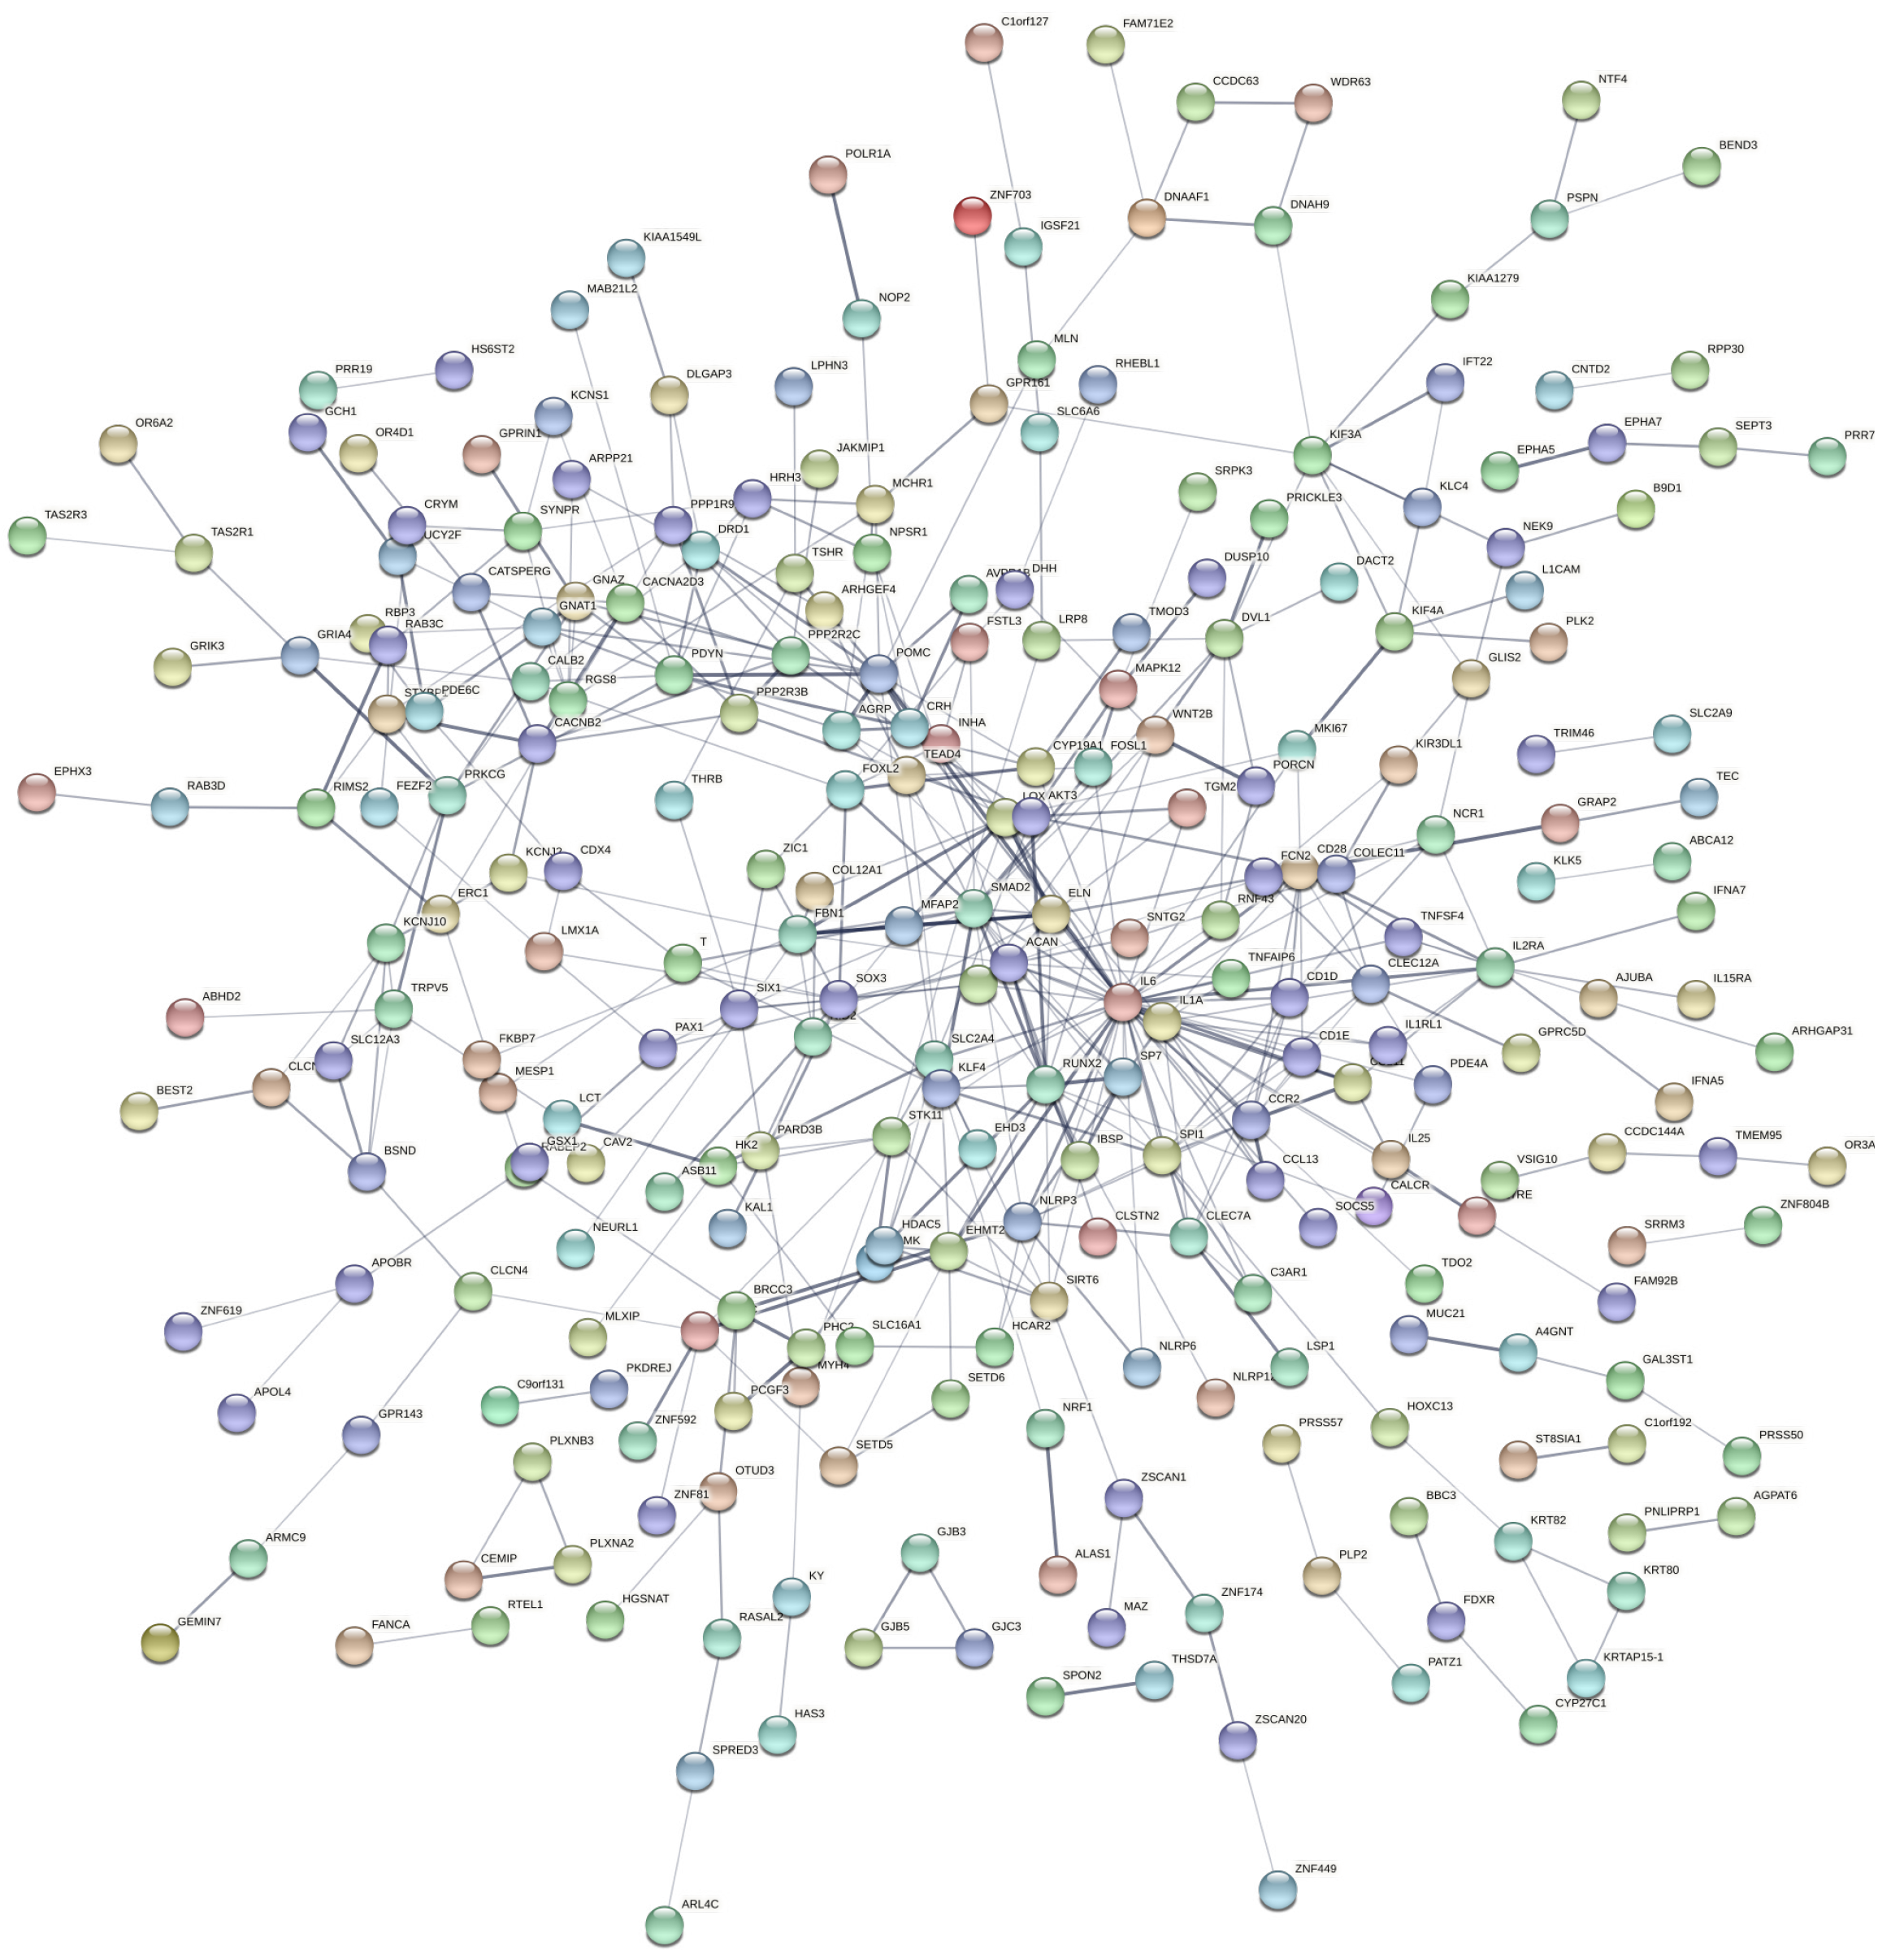
Figure 4 Protein-protein interaction network of upregulated genes.
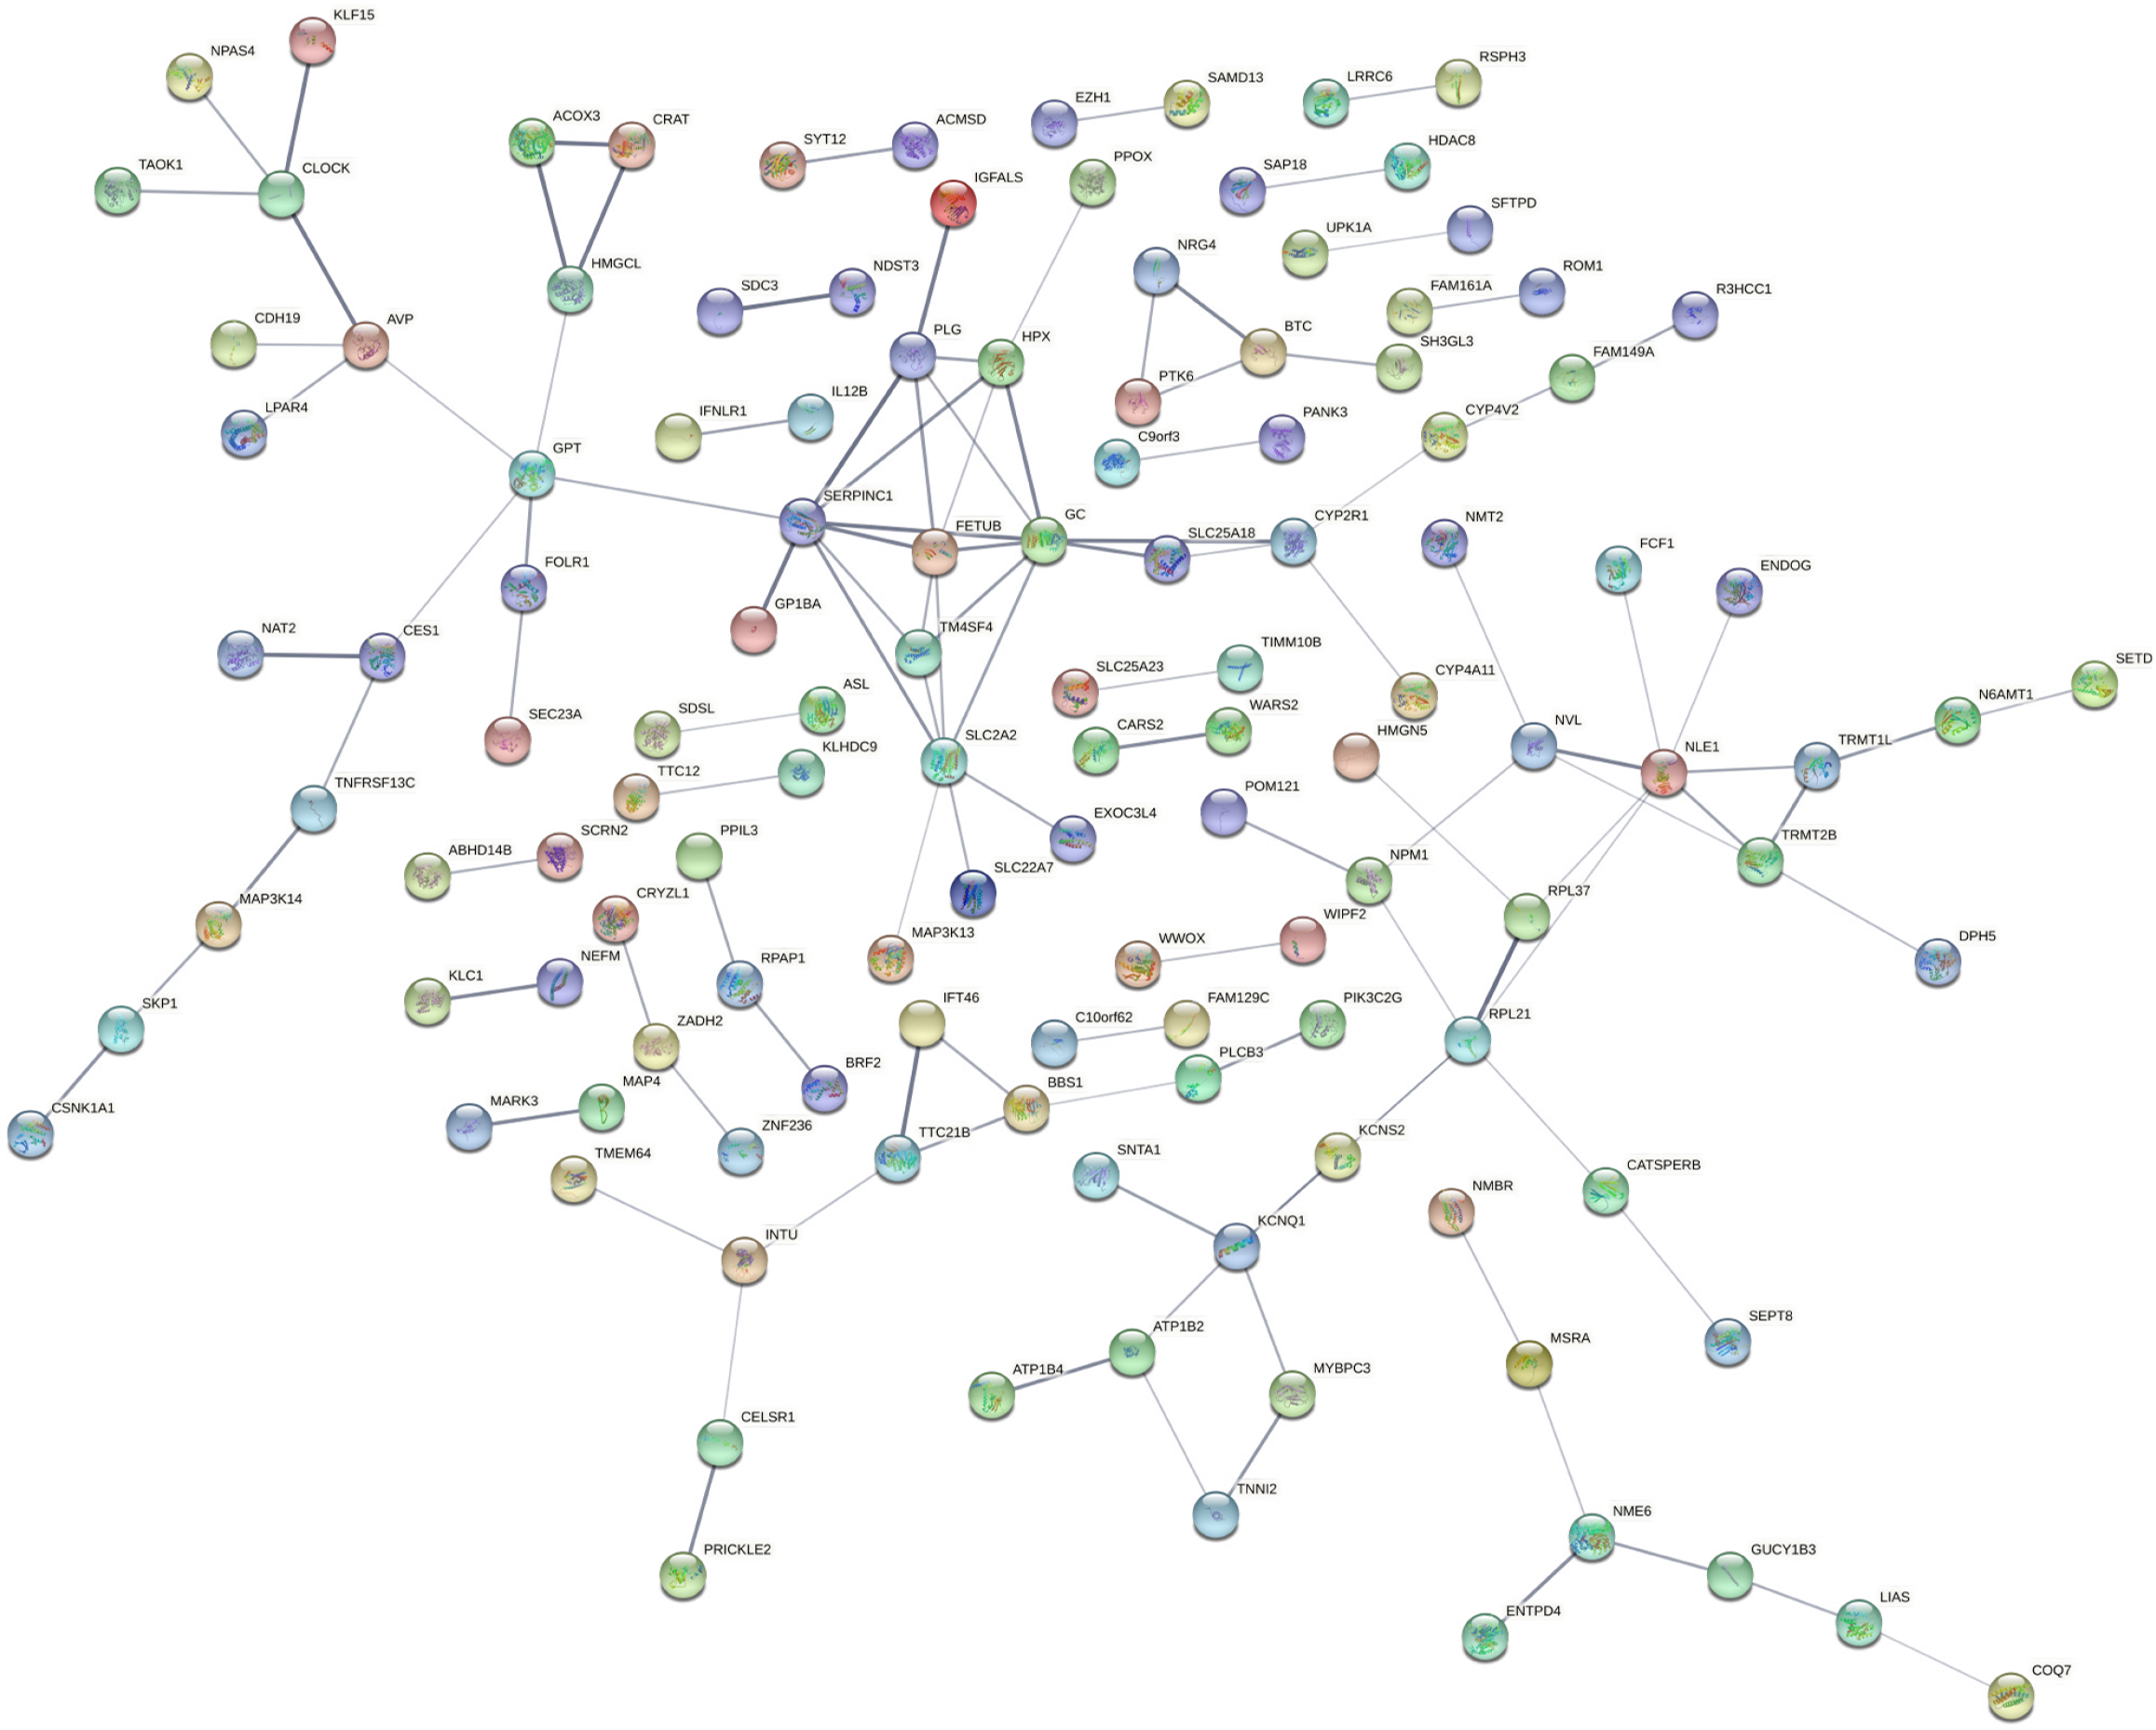
Figure 5 Protein-protein interaction network of downregulated genes.
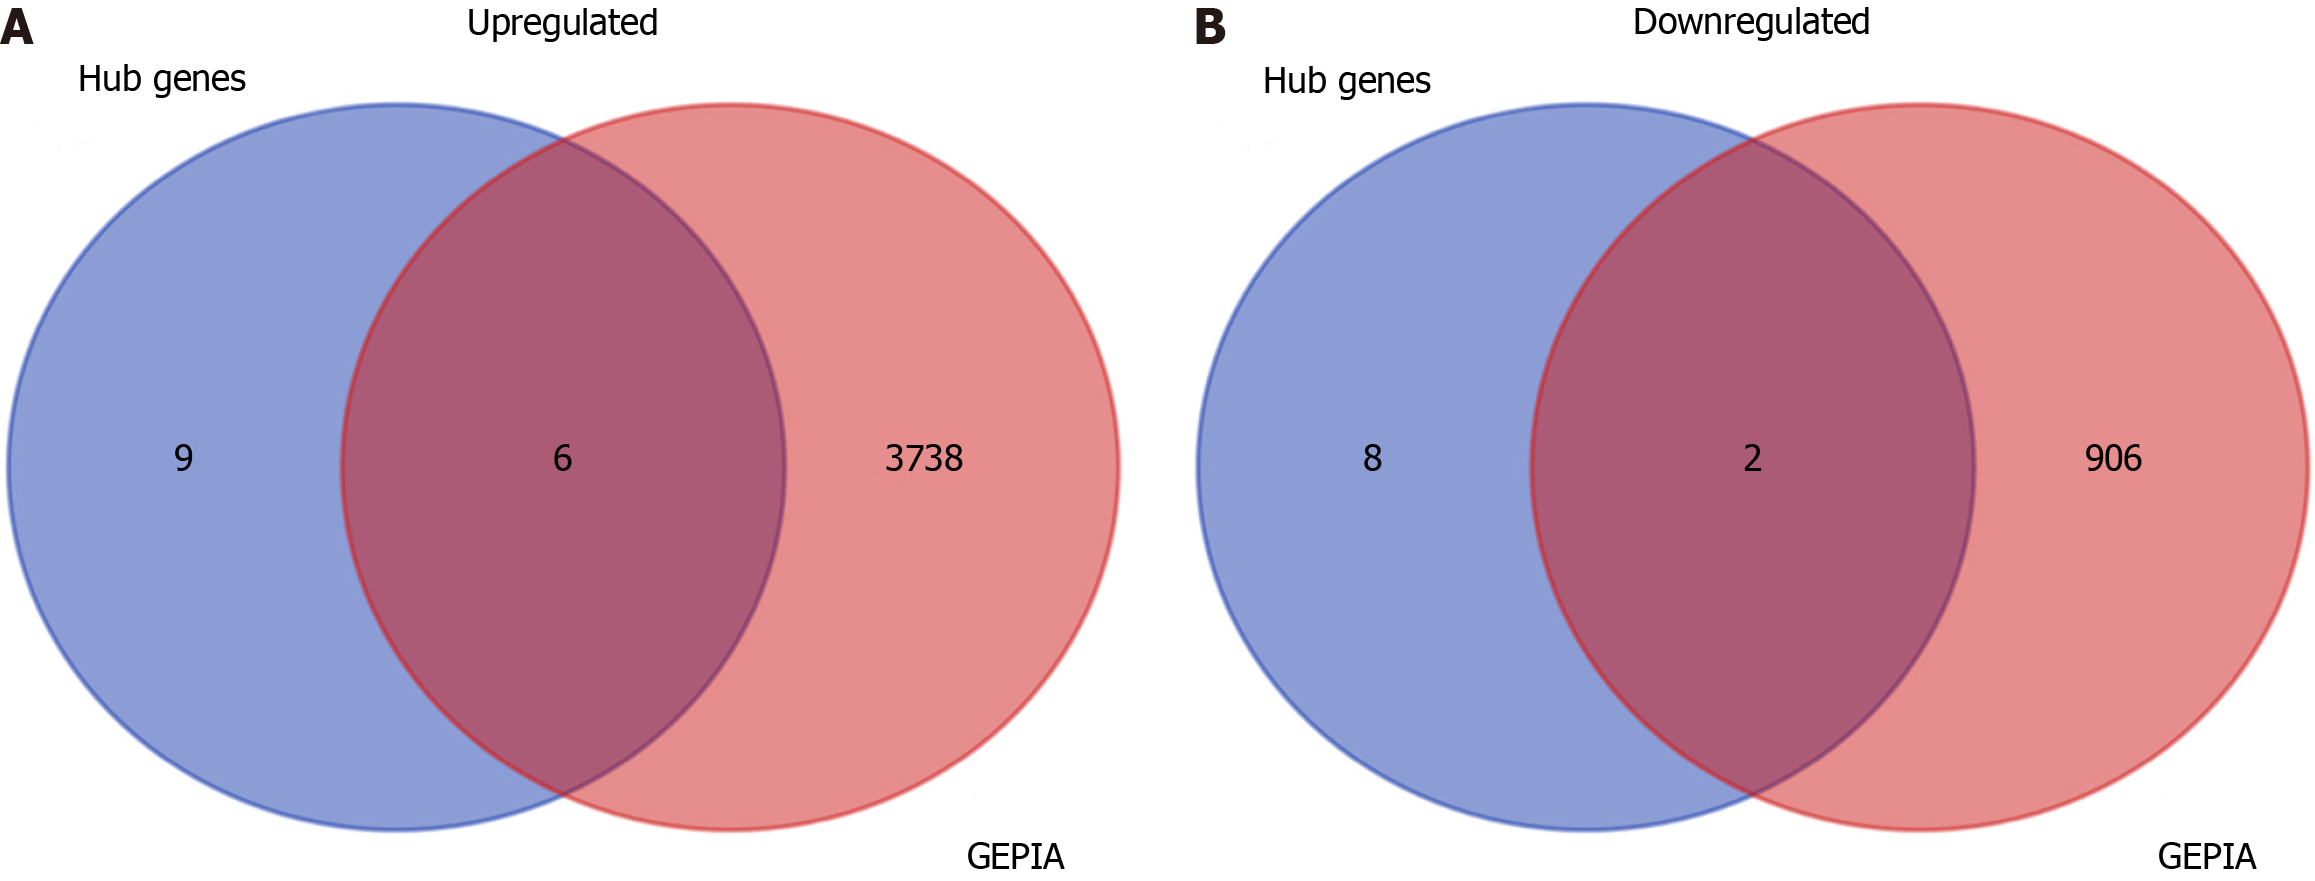
Figure 6 The intersection between the hub genes and differential expression profiles from the GEPIA database.
A: The overlapping upregulated hub genes; B: The overlapping downregulated hub genes.
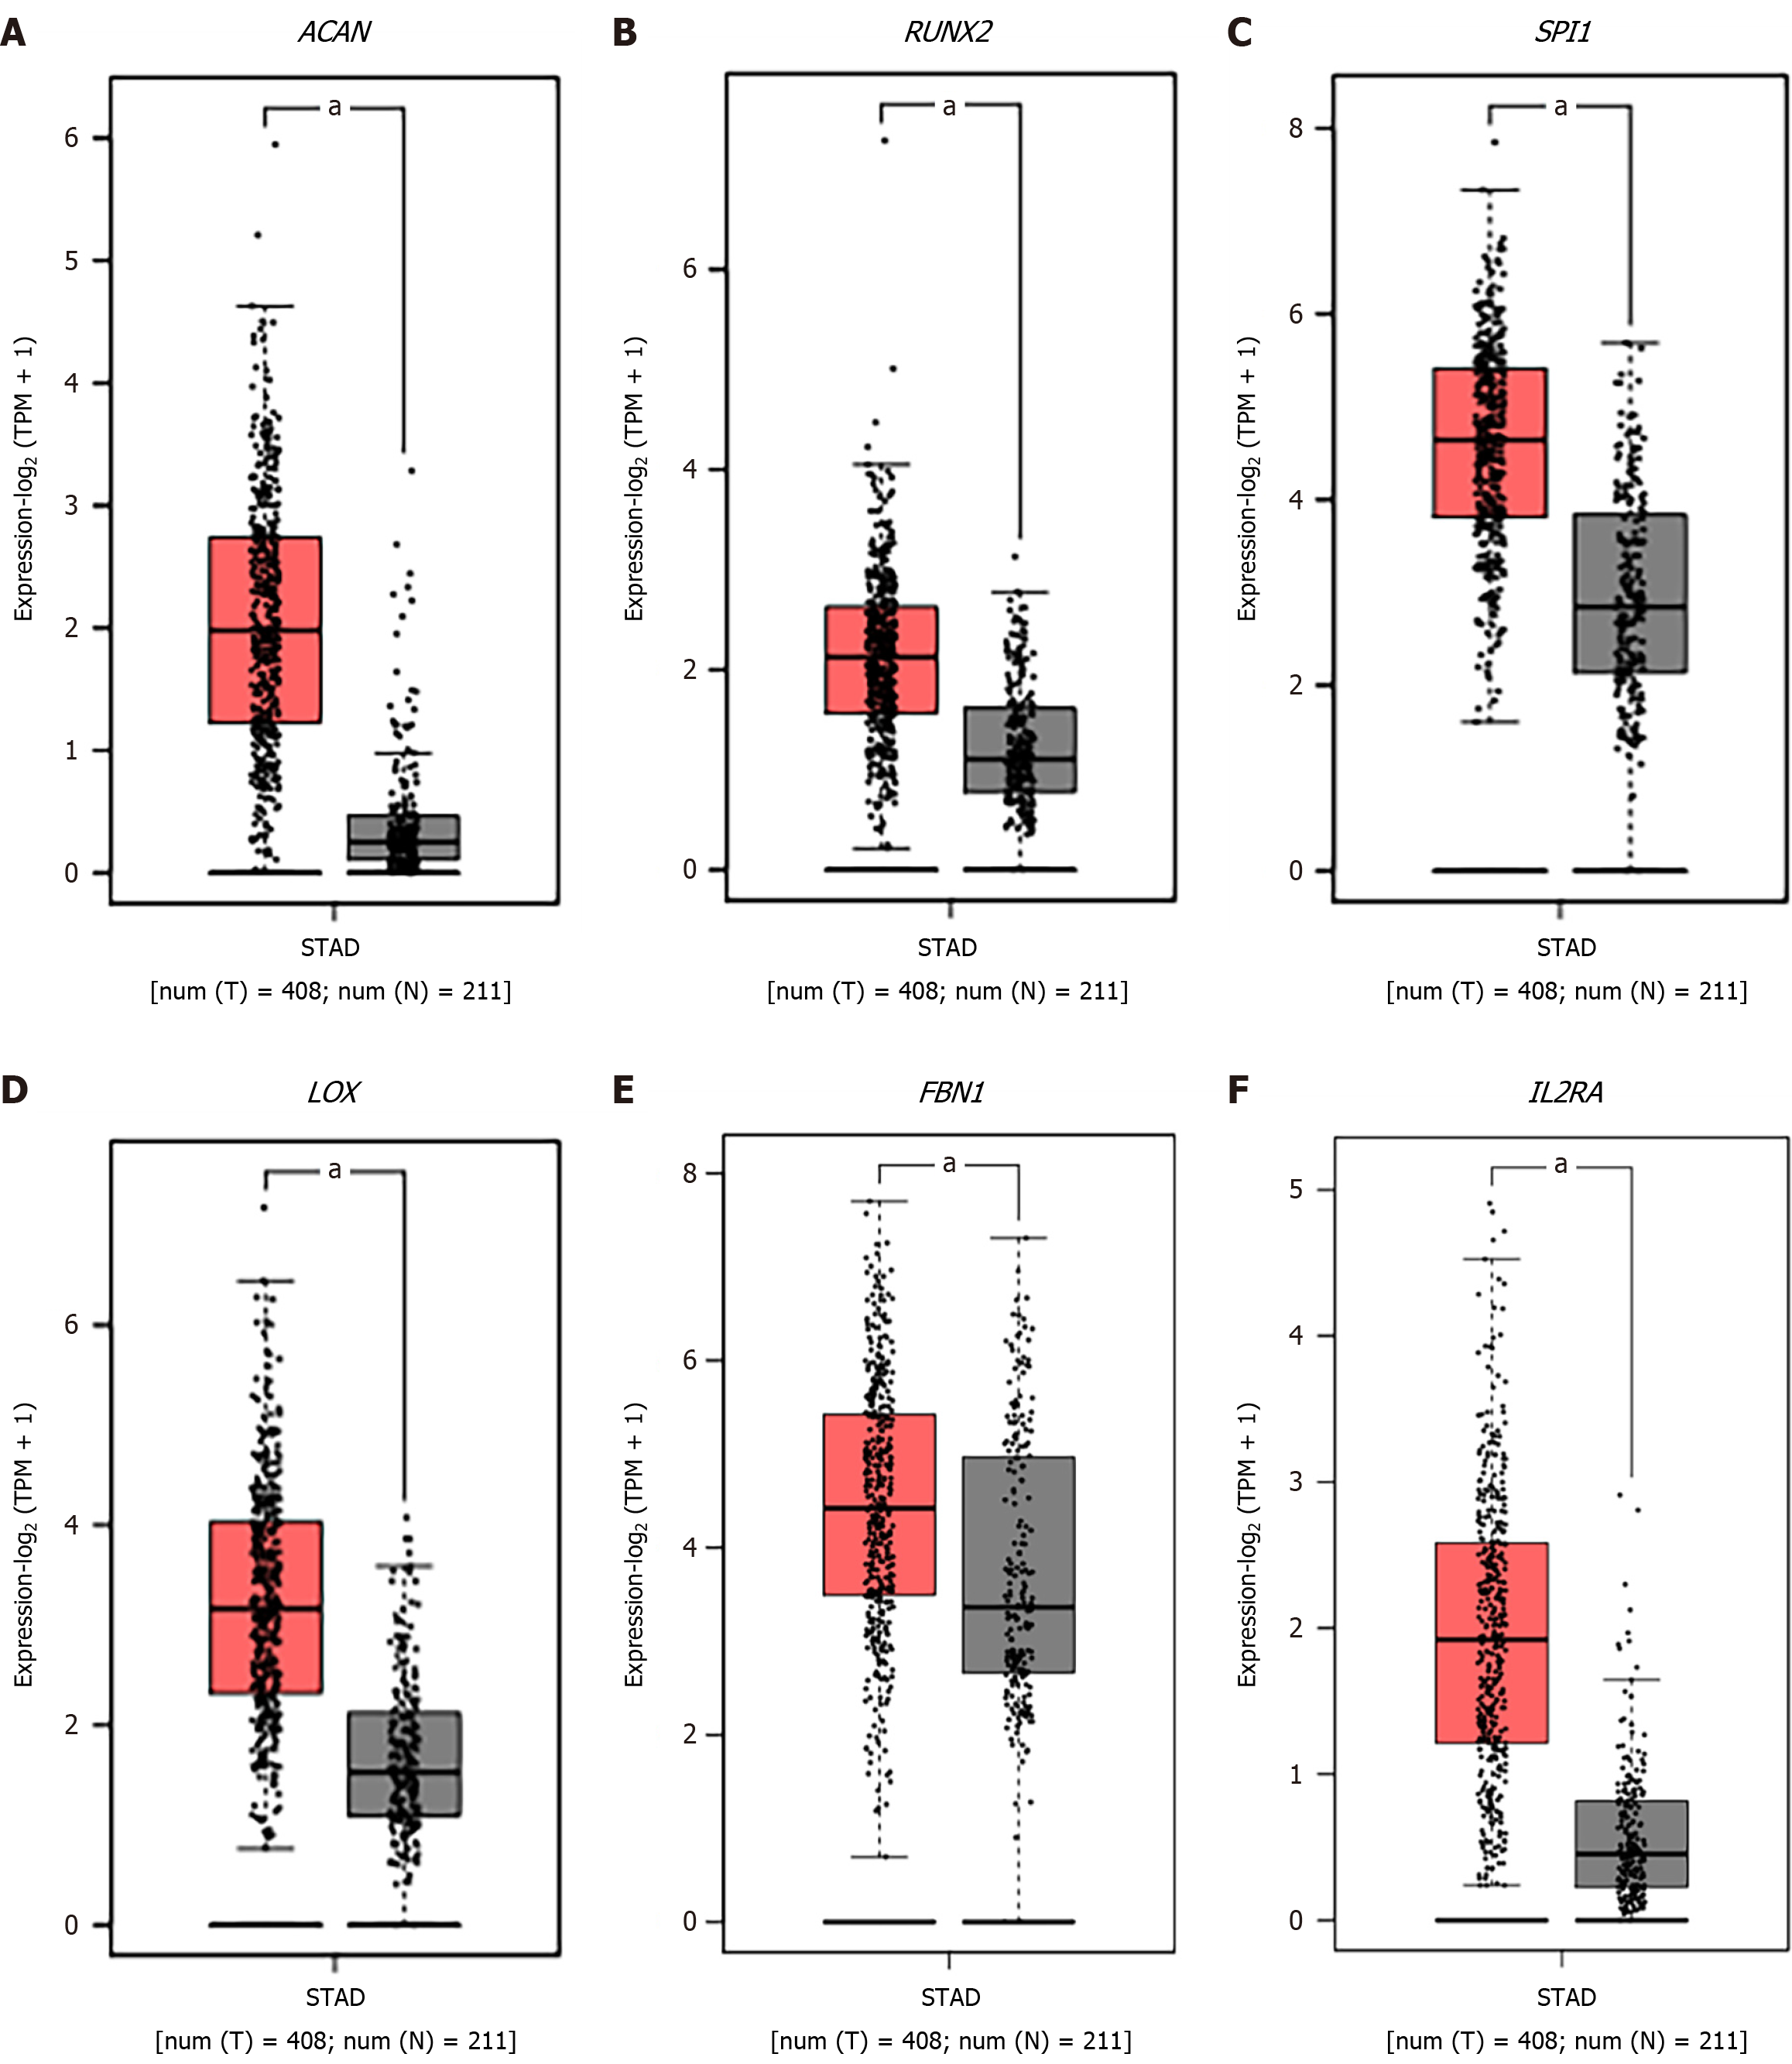
Figure 7 The expression levels of common hub genes in the stomach adenocarcinoma samples and nontumor samples based on the GEPIA database.
A: ACAN; B: RUNX2; C: SPI1; D: LOX; E: FBN1; F: IL2RA. aP < 0.05.
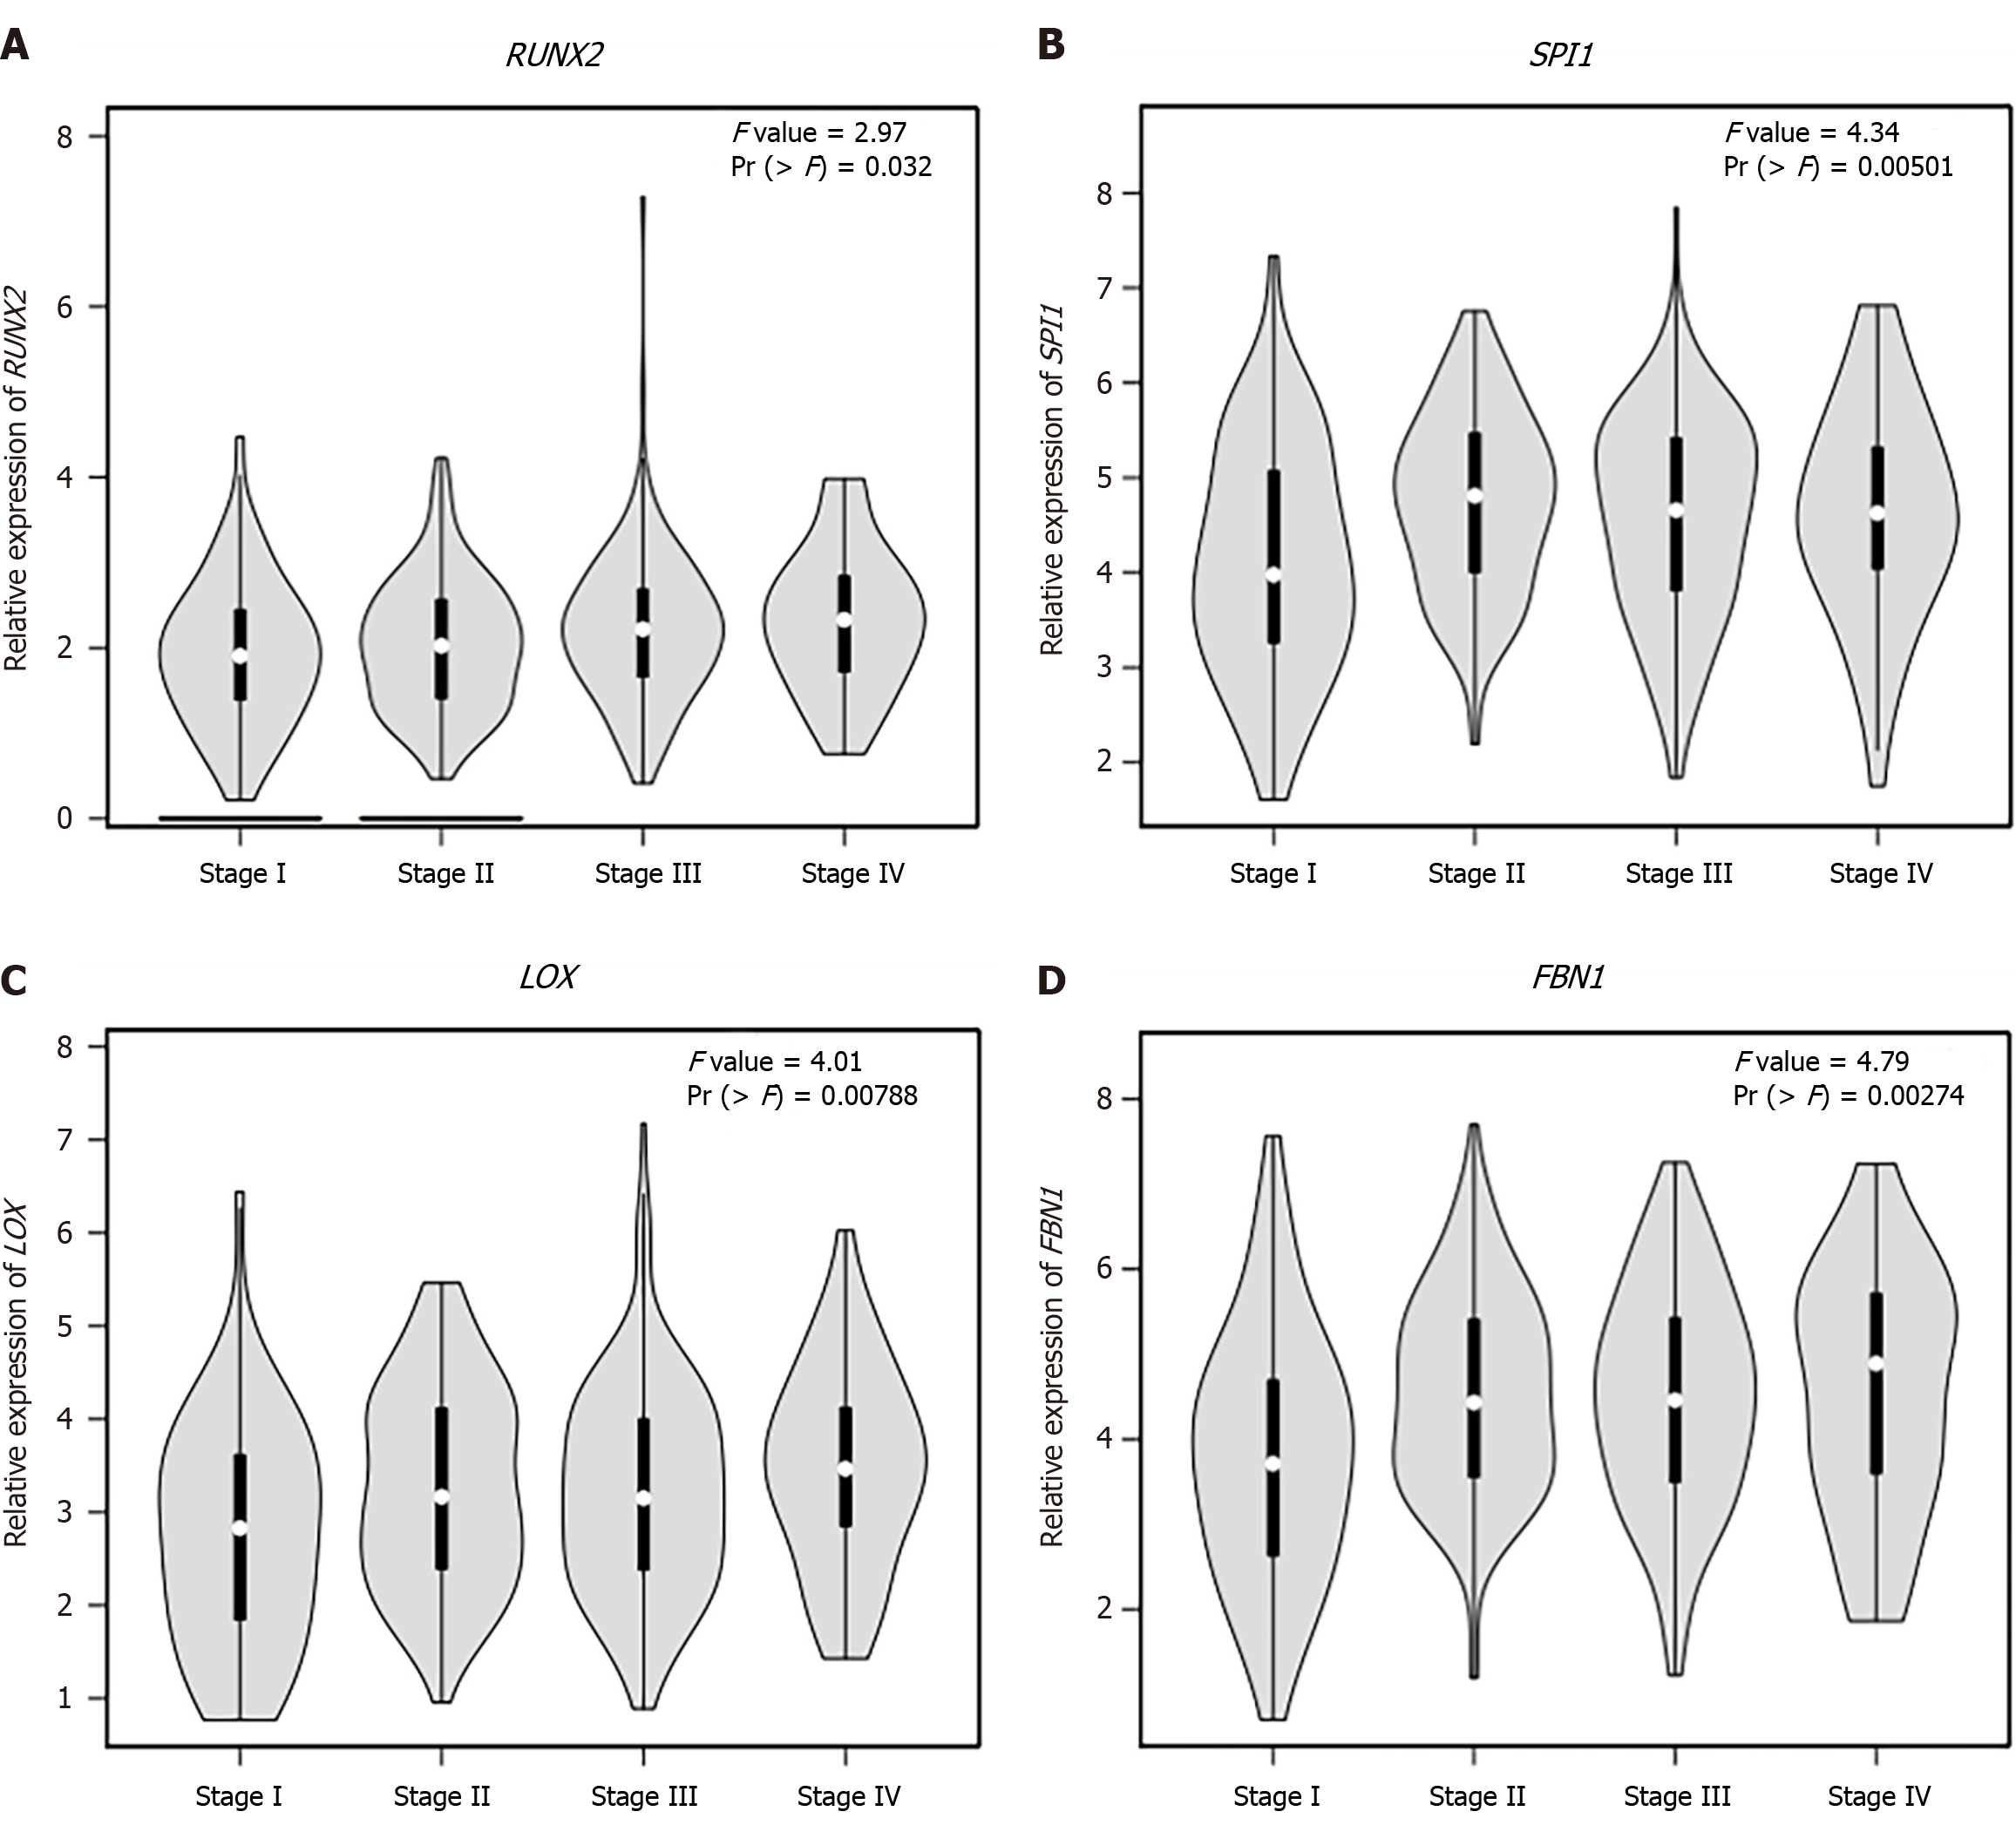
Figure 8 The expression levels of common hub genes in the tumor samples of different clinical stages.
A: RUNX2; B: SPI1; C: LOX; D: FBN1.
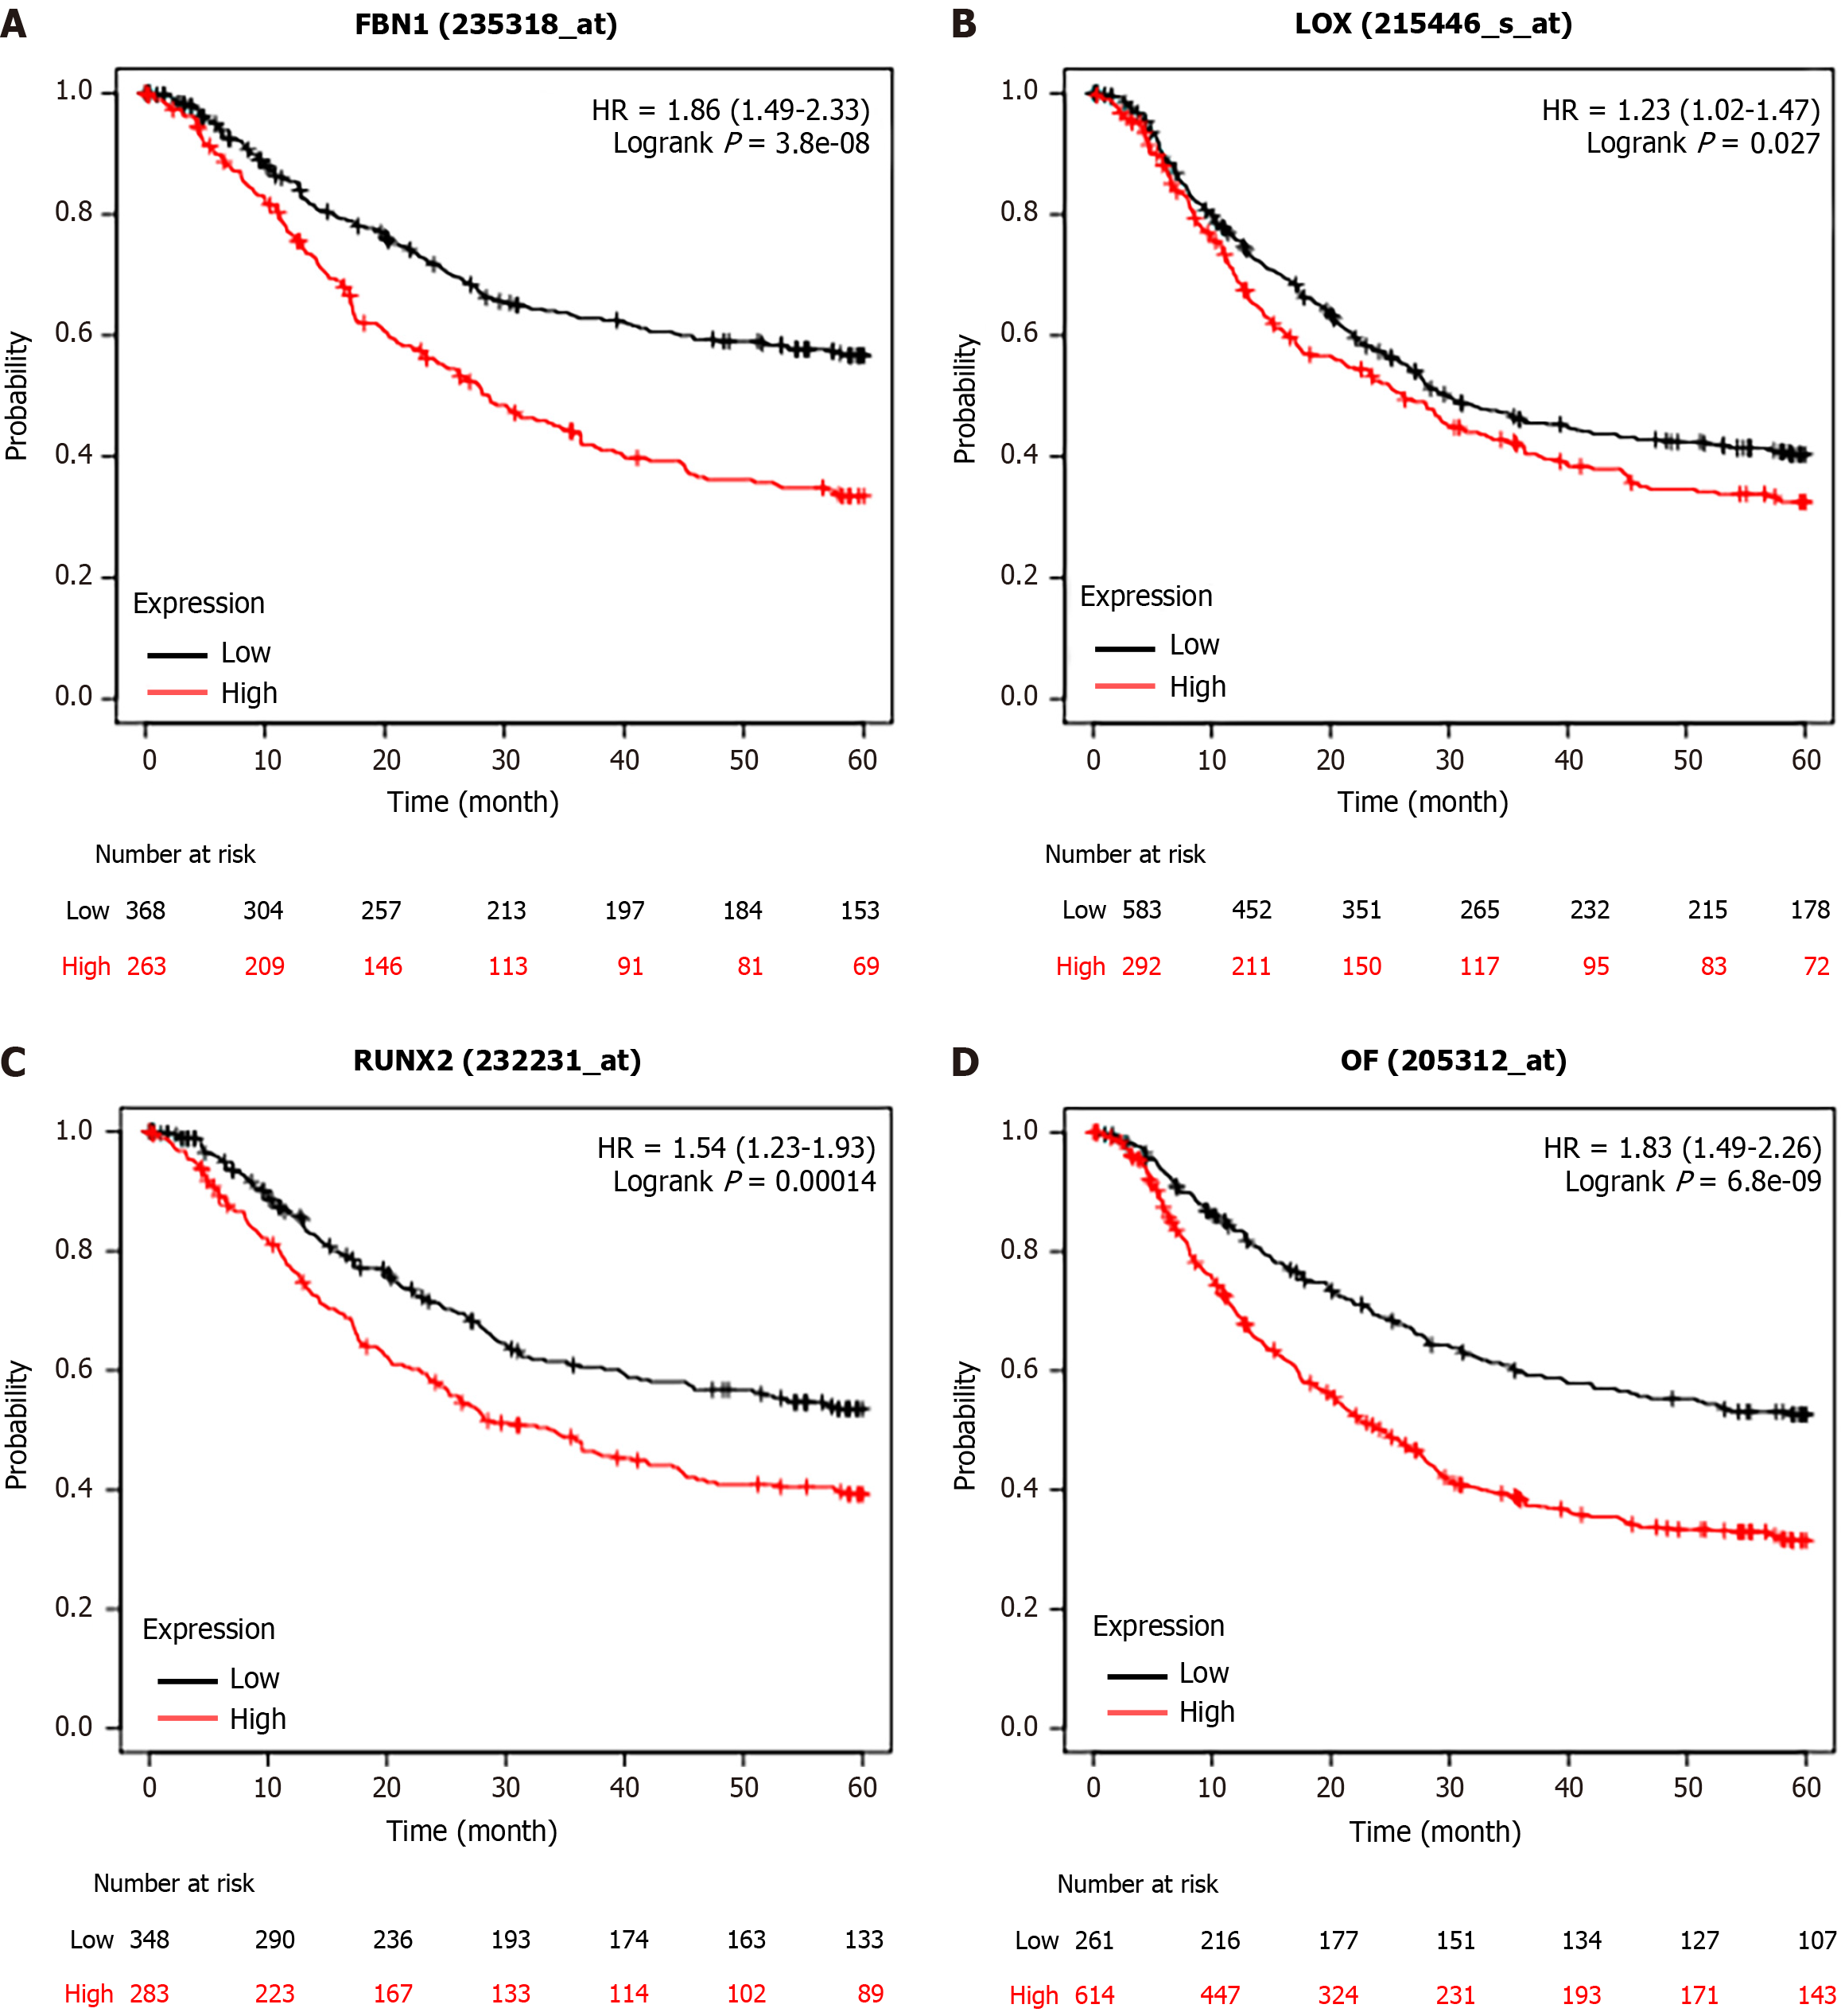
Figure 9 The prognosis of upregulated genes in the patients with STAD.
A: Kaplan-Meier survival curves for the FBN1; B: The prognosis mediated by LOX; C: The correlation between RUNX2 expression and overall survival rate; D: The correlation between OF (SPI1) expression and overall survival rate.
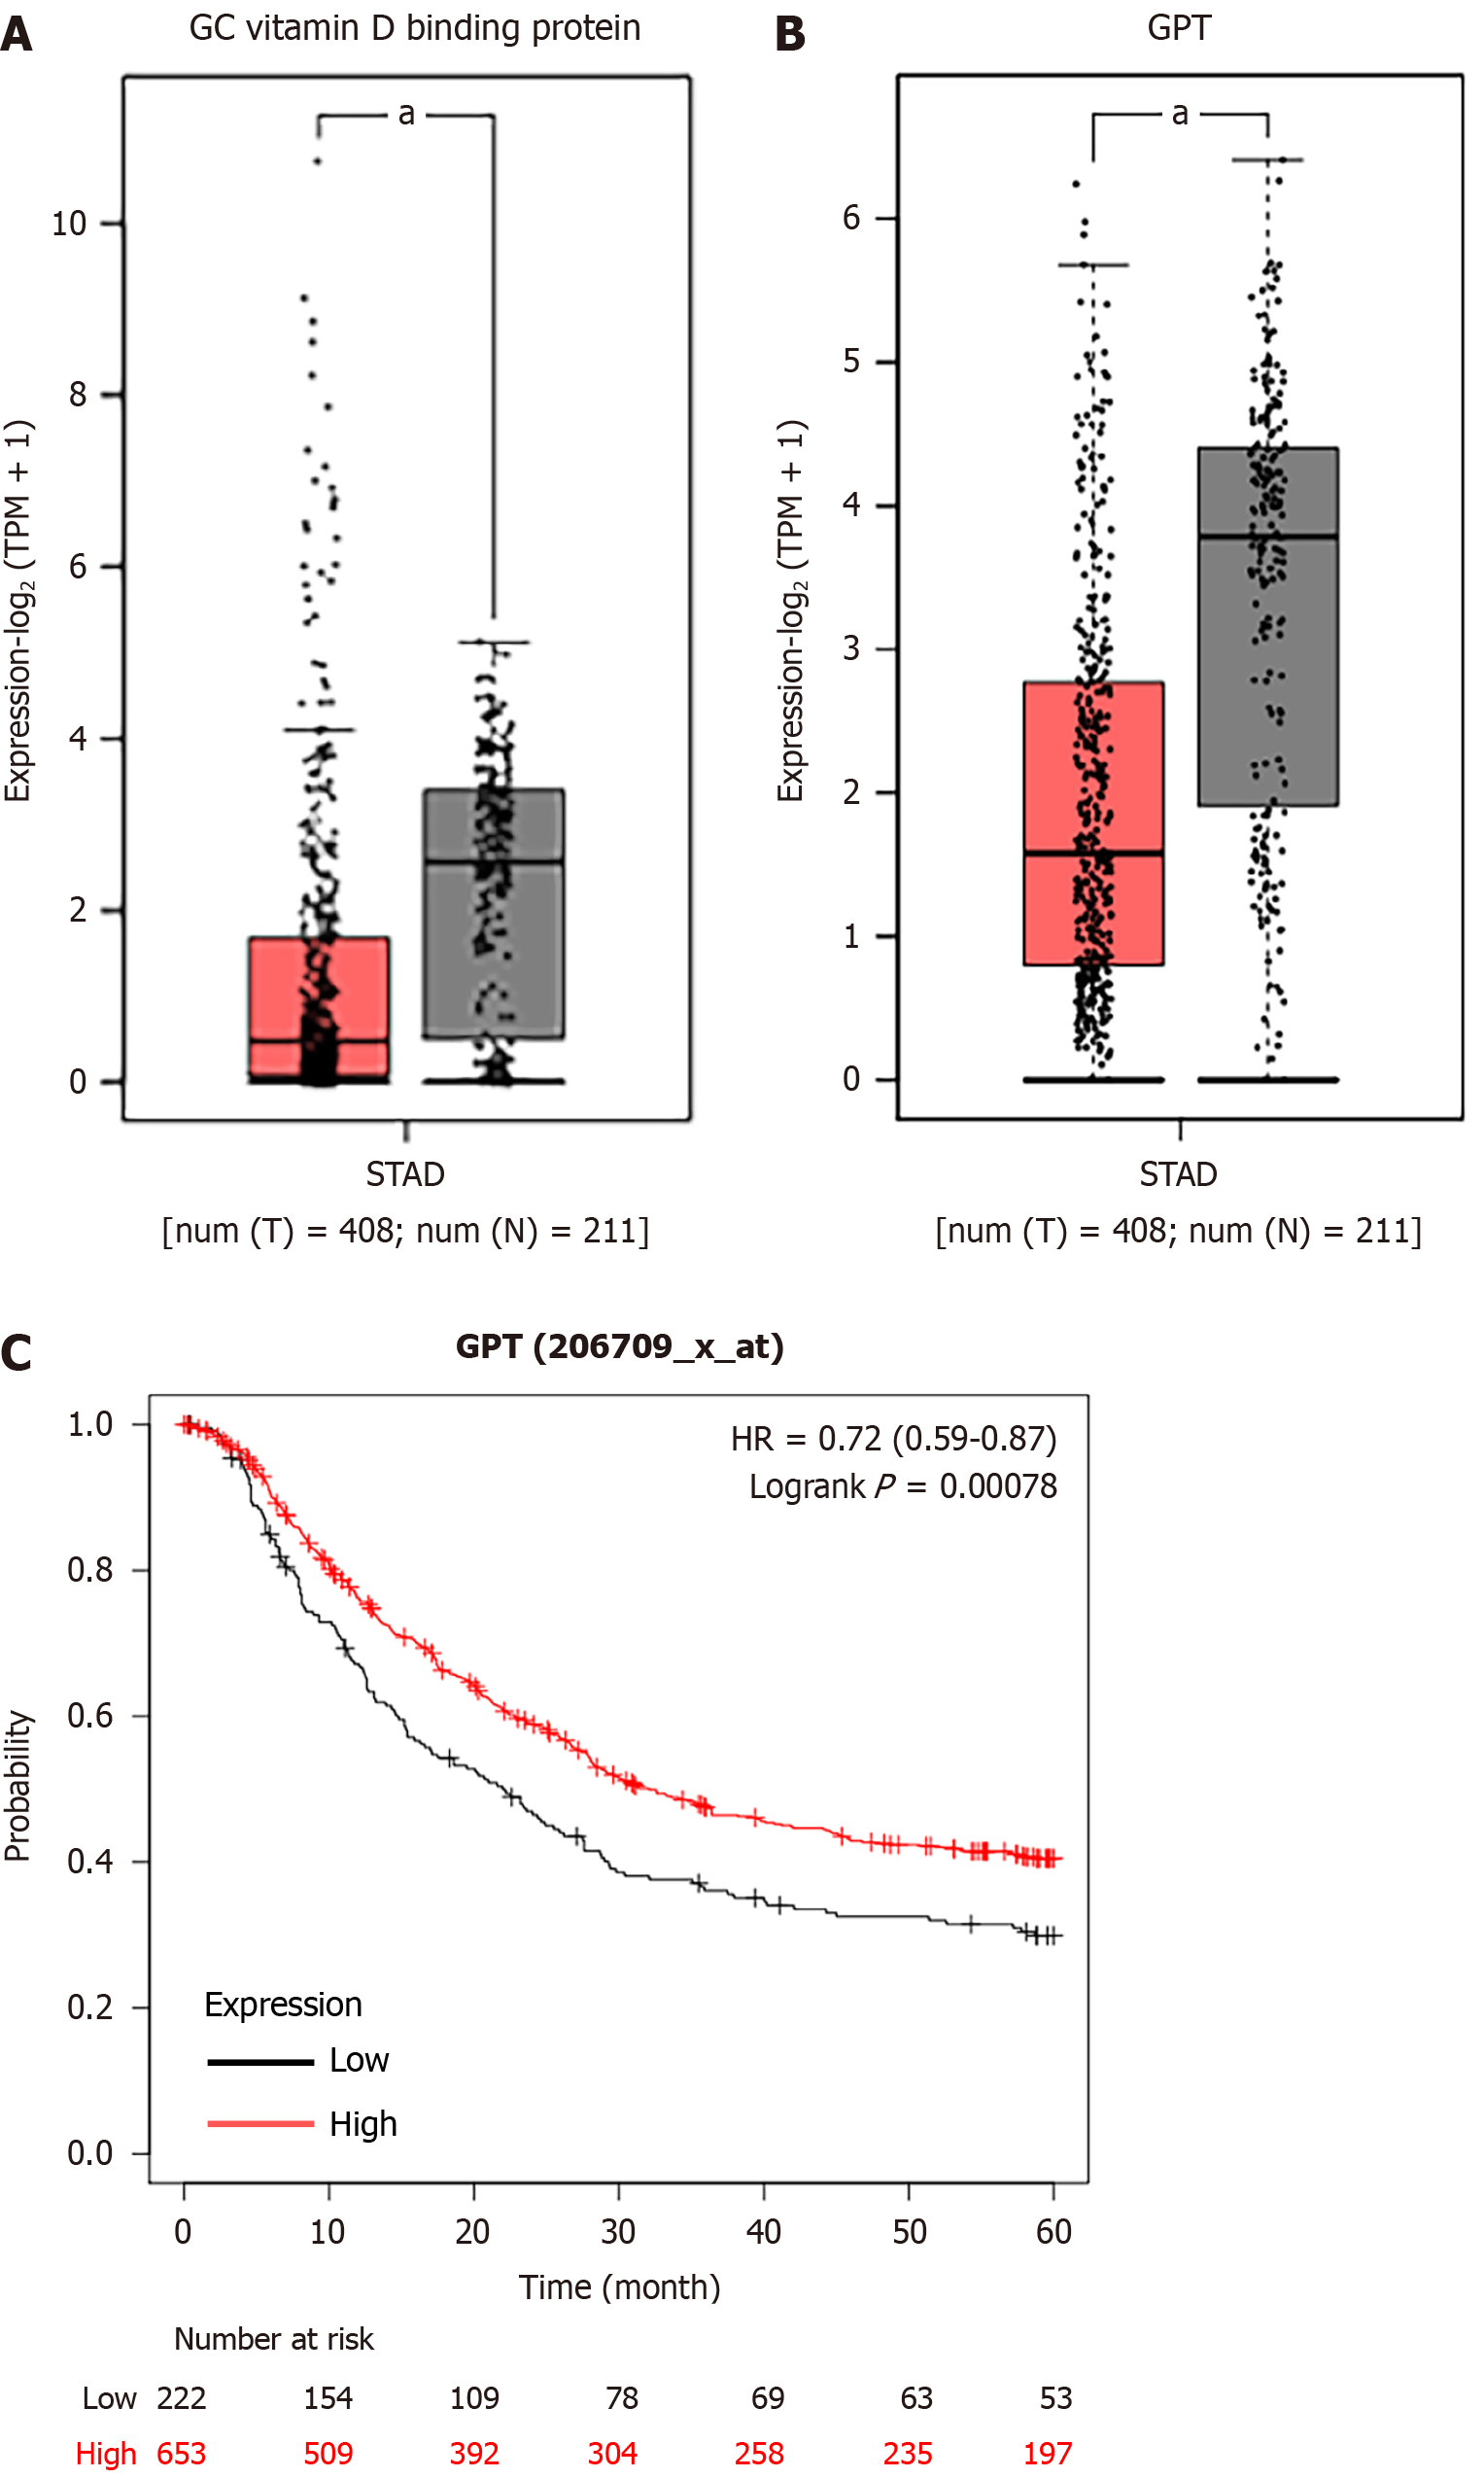
Figure 10 The expression levels and prognosis of downregulated genes.
A: The expression levels of gastric cancer vitamin D binding protein in stomach adenocarcinoma samples and nontumor samples; B: The expression levels of glutamic-pyruvic transaminase (GPT); C: The correlation between GPT expression and overall survival rate. aP < 0.05.
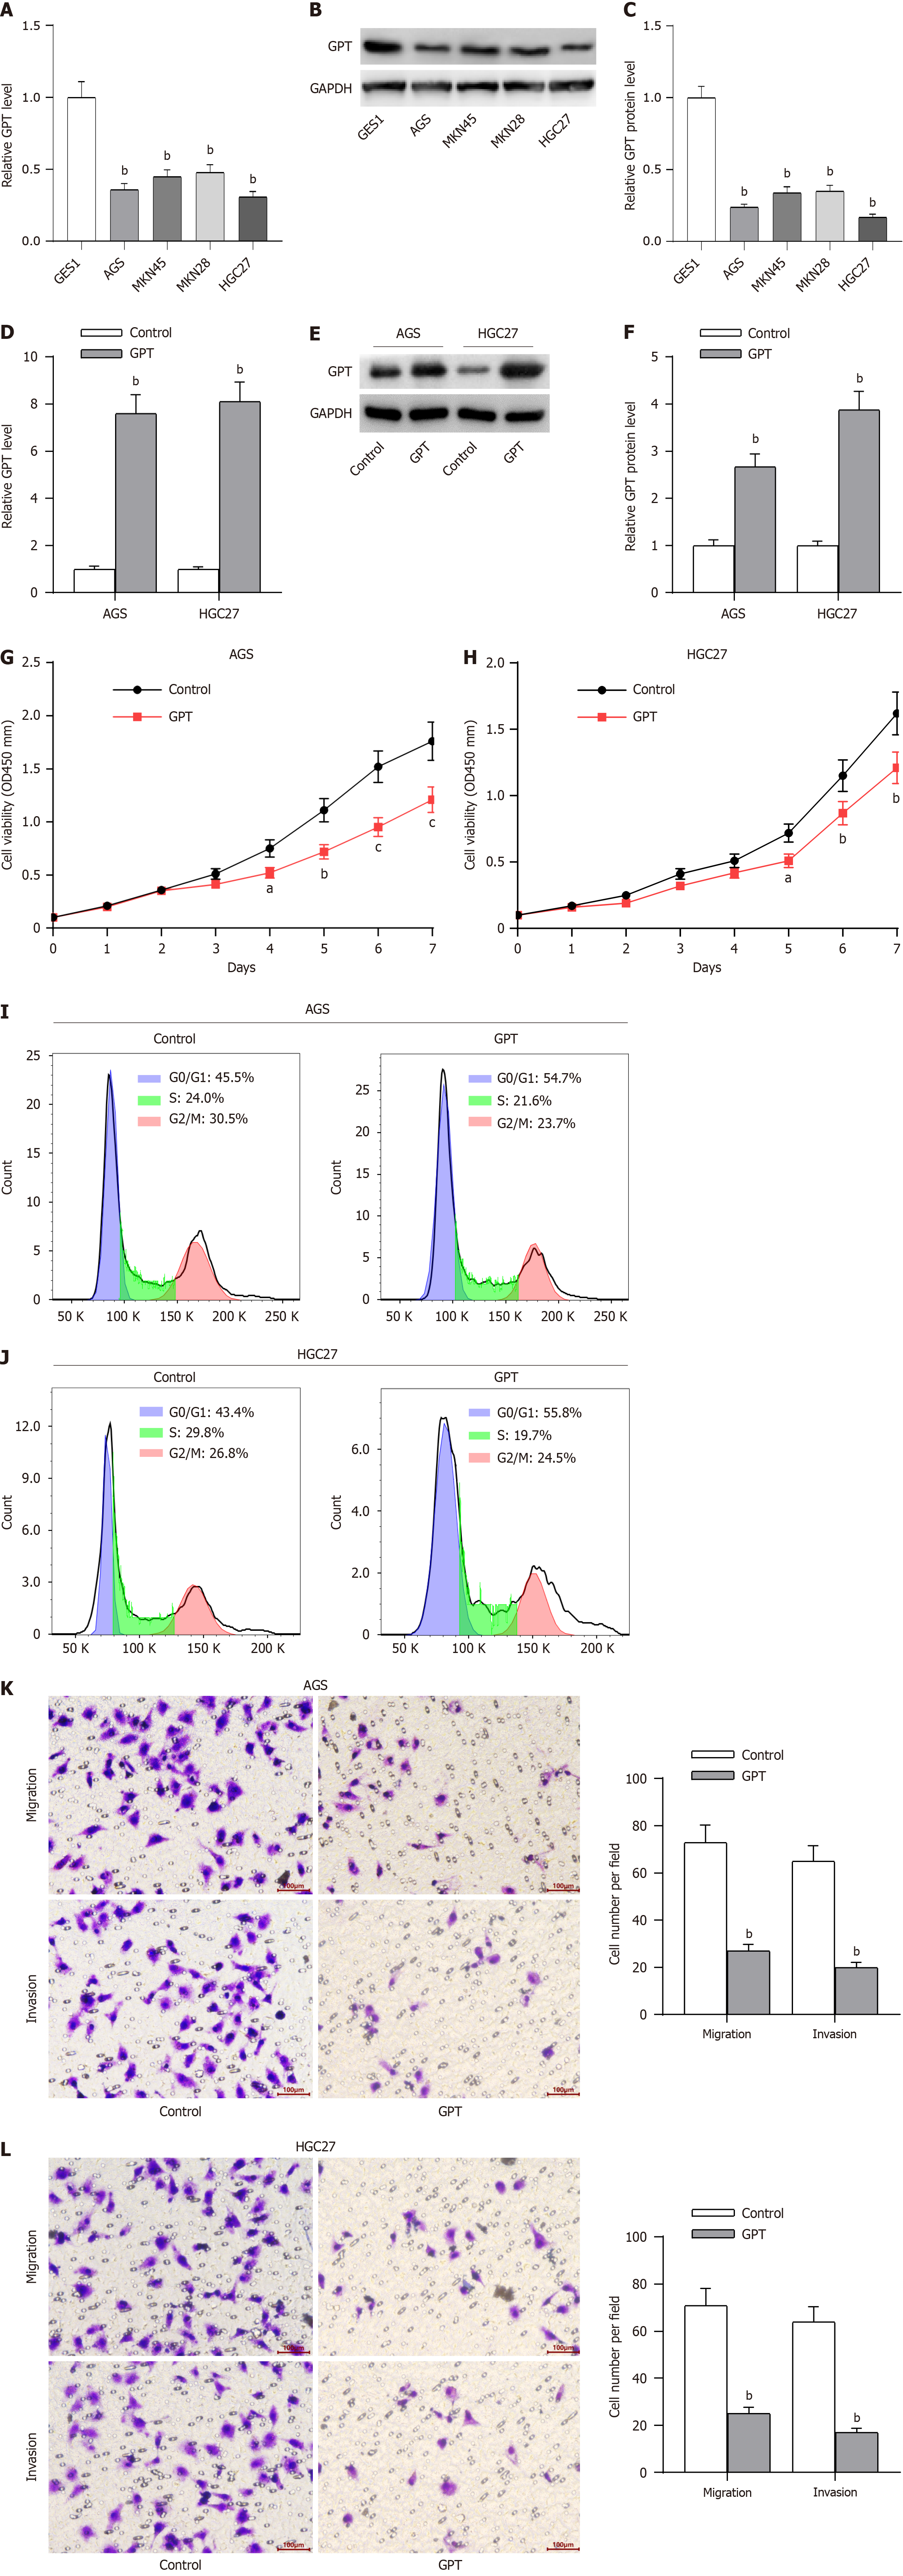
Figure 11 Glutamic-pyruvic transaminase upregulation suppresses GC cell proliferation, migration and invasion.
A: Real-time quantitative polymerase chain reaction (RT-qPCR) of glutamic-pyruvic transaminase (GPT) mRNA level in gastric cancer cell lines (AGS, MKN45, MKN28 and HGC27) and normal immortalized cell line (GES1); B and C: Western blotting of GPT protein level; D-F: Overexpression efficiency of GPT overexpression vector was verified by RT-qPCR and western blotting; G and H: CCK-8 assays of cell viability; I and J: Flow cytometry of cell cycle; K and L: Transwell assays of cell migration and invasion. aP < 0.05; bP < 0.01; cP < 0.001.
- Citation: Zhou JW, Zhang YB, Huang ZY, Yuan YP, Jin J. Identification of differentially expressed mRNAs as novel predictive biomarkers for gastric cancer diagnosis and prognosis. World J Gastrointest Oncol 2024; 16(5): 1947-1964
- URL: https://www.wjgnet.com/1948-5204/full/v16/i5/1947.htm
- DOI: https://dx.doi.org/10.4251/wjgo.v16.i5.1947


