Copyright
©The Author(s) 2024.
World J Gastrointest Oncol. May 15, 2024; 16(5): 1925-1946
Published online May 15, 2024. doi: 10.4251/wjgo.v16.i5.1925
Published online May 15, 2024. doi: 10.4251/wjgo.v16.i5.1925
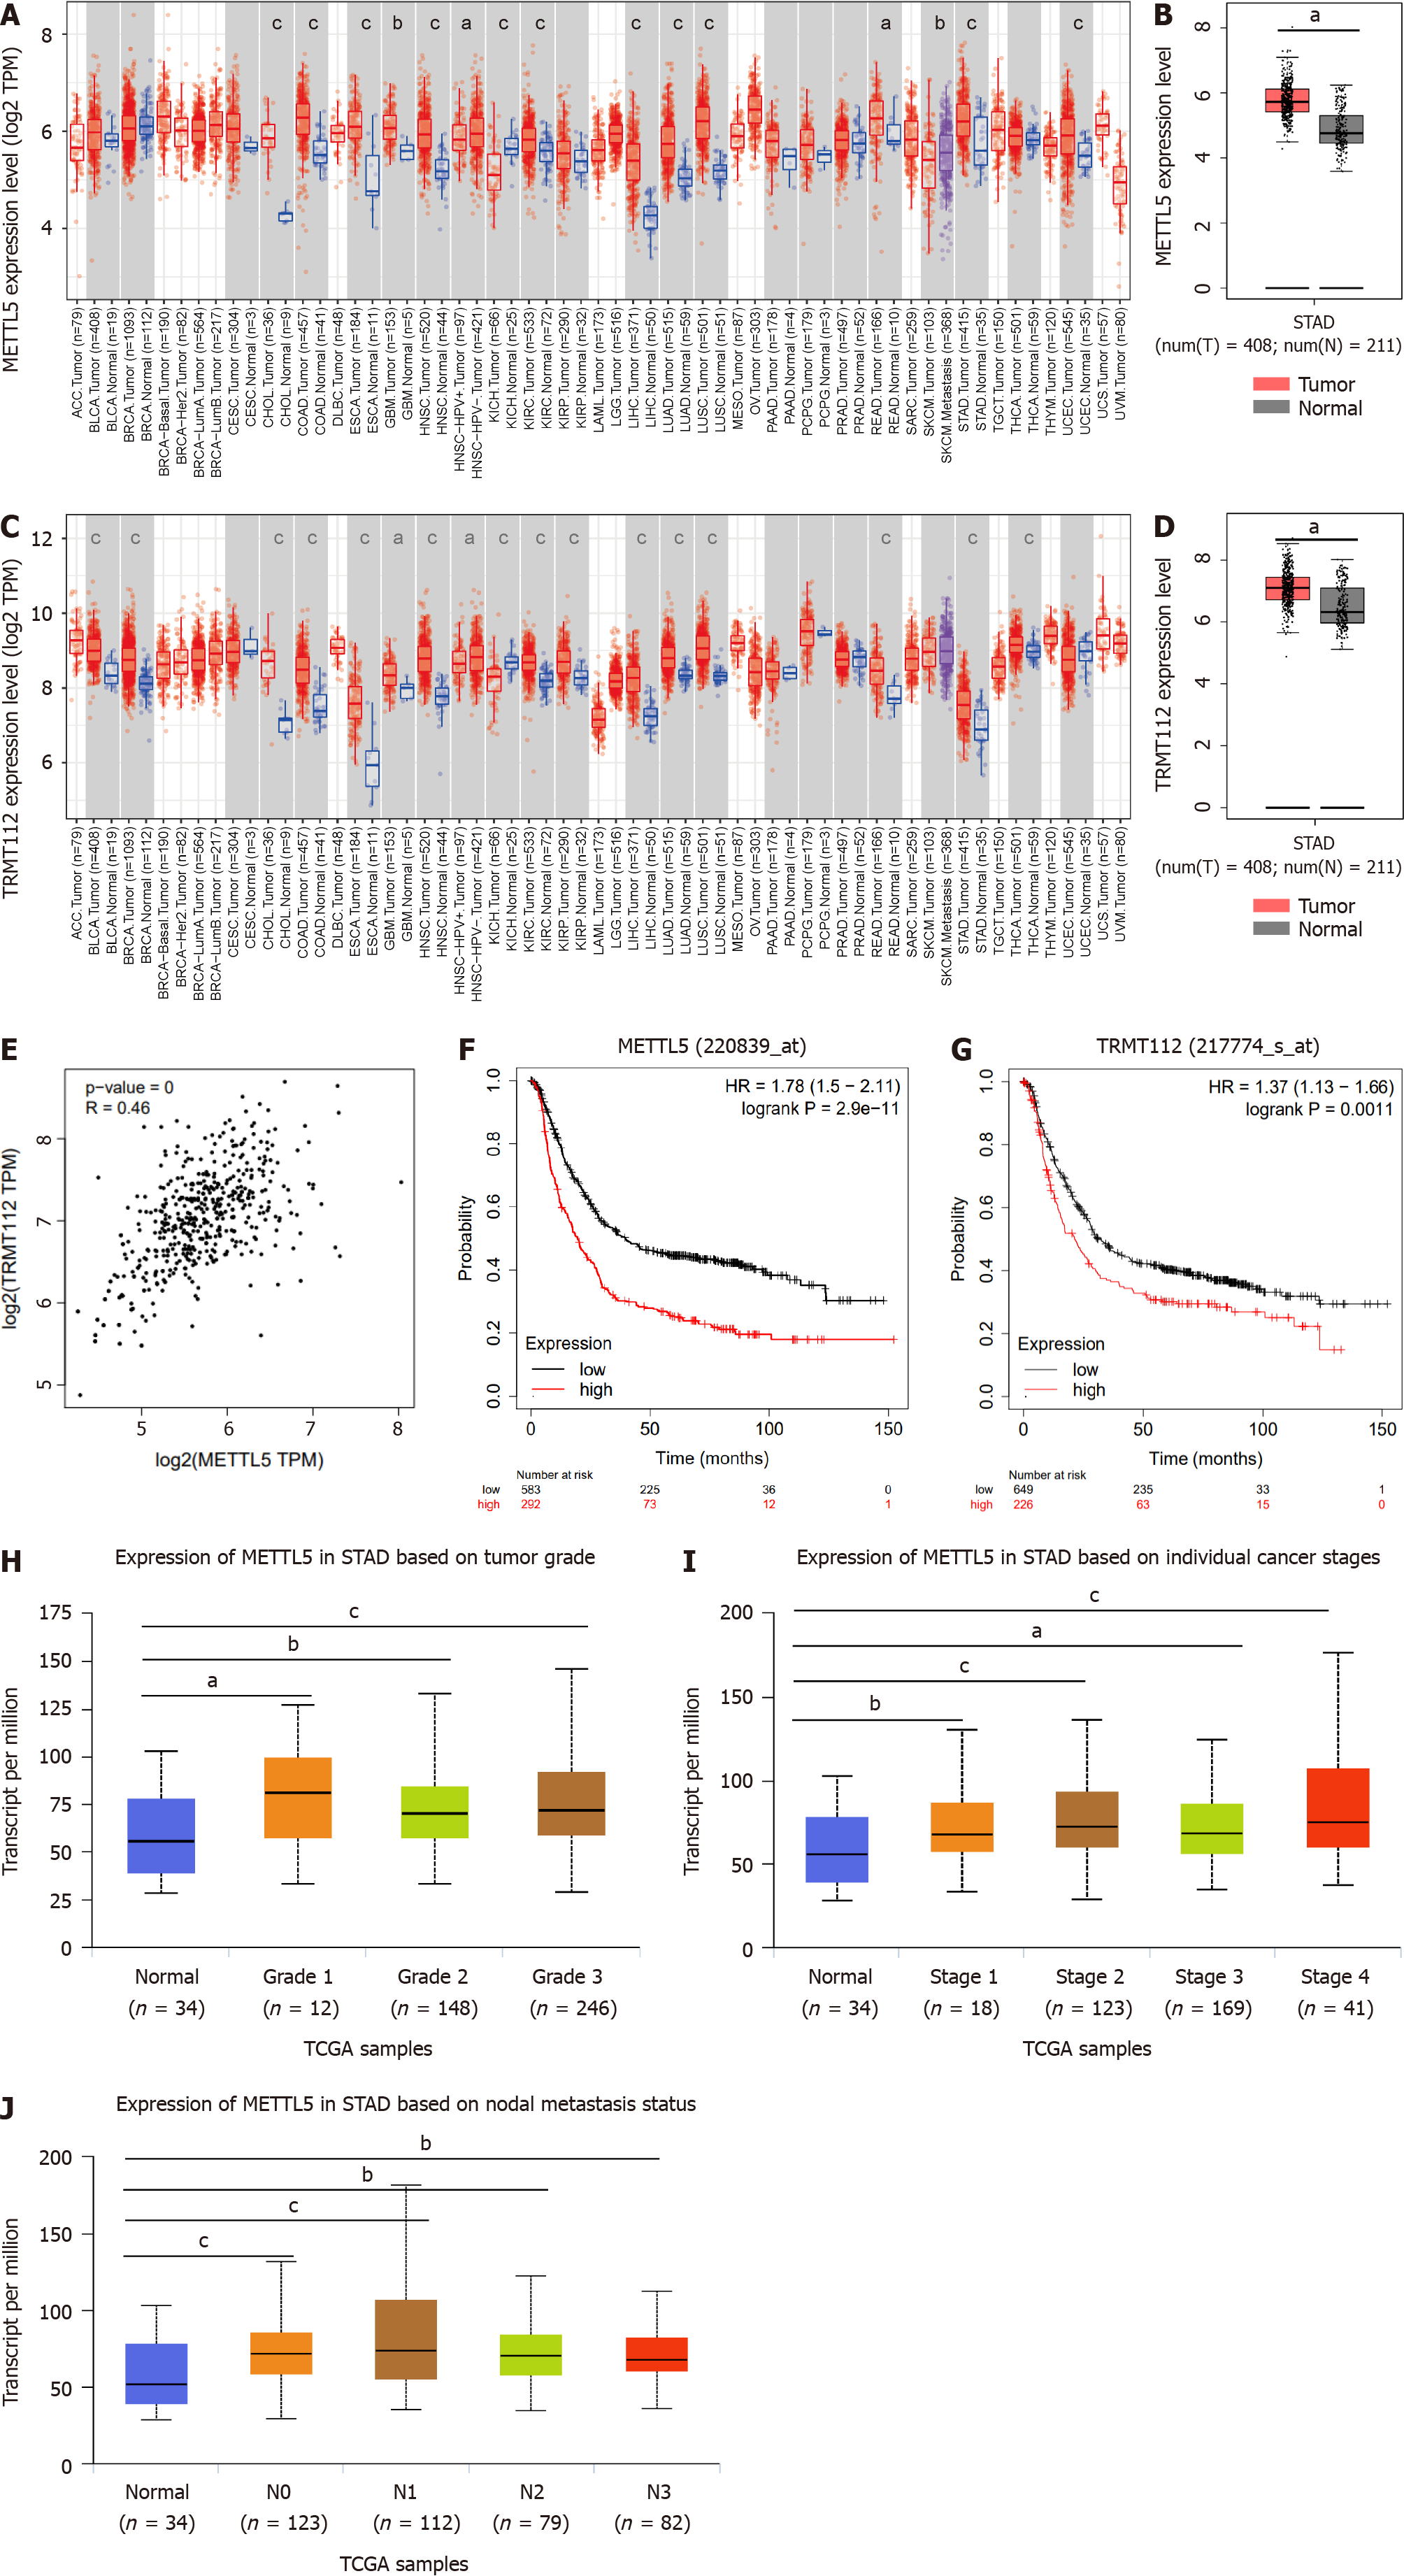
Figure 1 Elevated METTL5 expression is associated with worse survival of patients with gastric cancer.
A: METTL5 expression in normal tissues from GTEx and The Cancer Genome Atlas (TCGA) databases and pan-tumor tissues from TCGA; B: METTL5 expression in normal tissues from the GTEx and TCGA databases and gastric cancer (GC) tissues from TCGA; C: TRMT112 expression in normal tissues from the GTEx and TCGA databases and pan-tumor tissues from TCGA; D: TRMT112 expression in normal tissues from the GTEx and TCGA databases and in GC tissues from TCGA; E: Correlation between METTL5 and TRMT112 in the TCGA; F: Analysis of METTL5 and overall survival of patients in the TCGA dataset; G: Analysis of TRMT112 and overall survival of patients in the TCGA dataset; H-J: Association of METTL5 levels with tumor grade, tumor stage, and lymph node metastasis of GC from TCGA database. aP < 0.05, bP < 0.01, cP < 0.001.
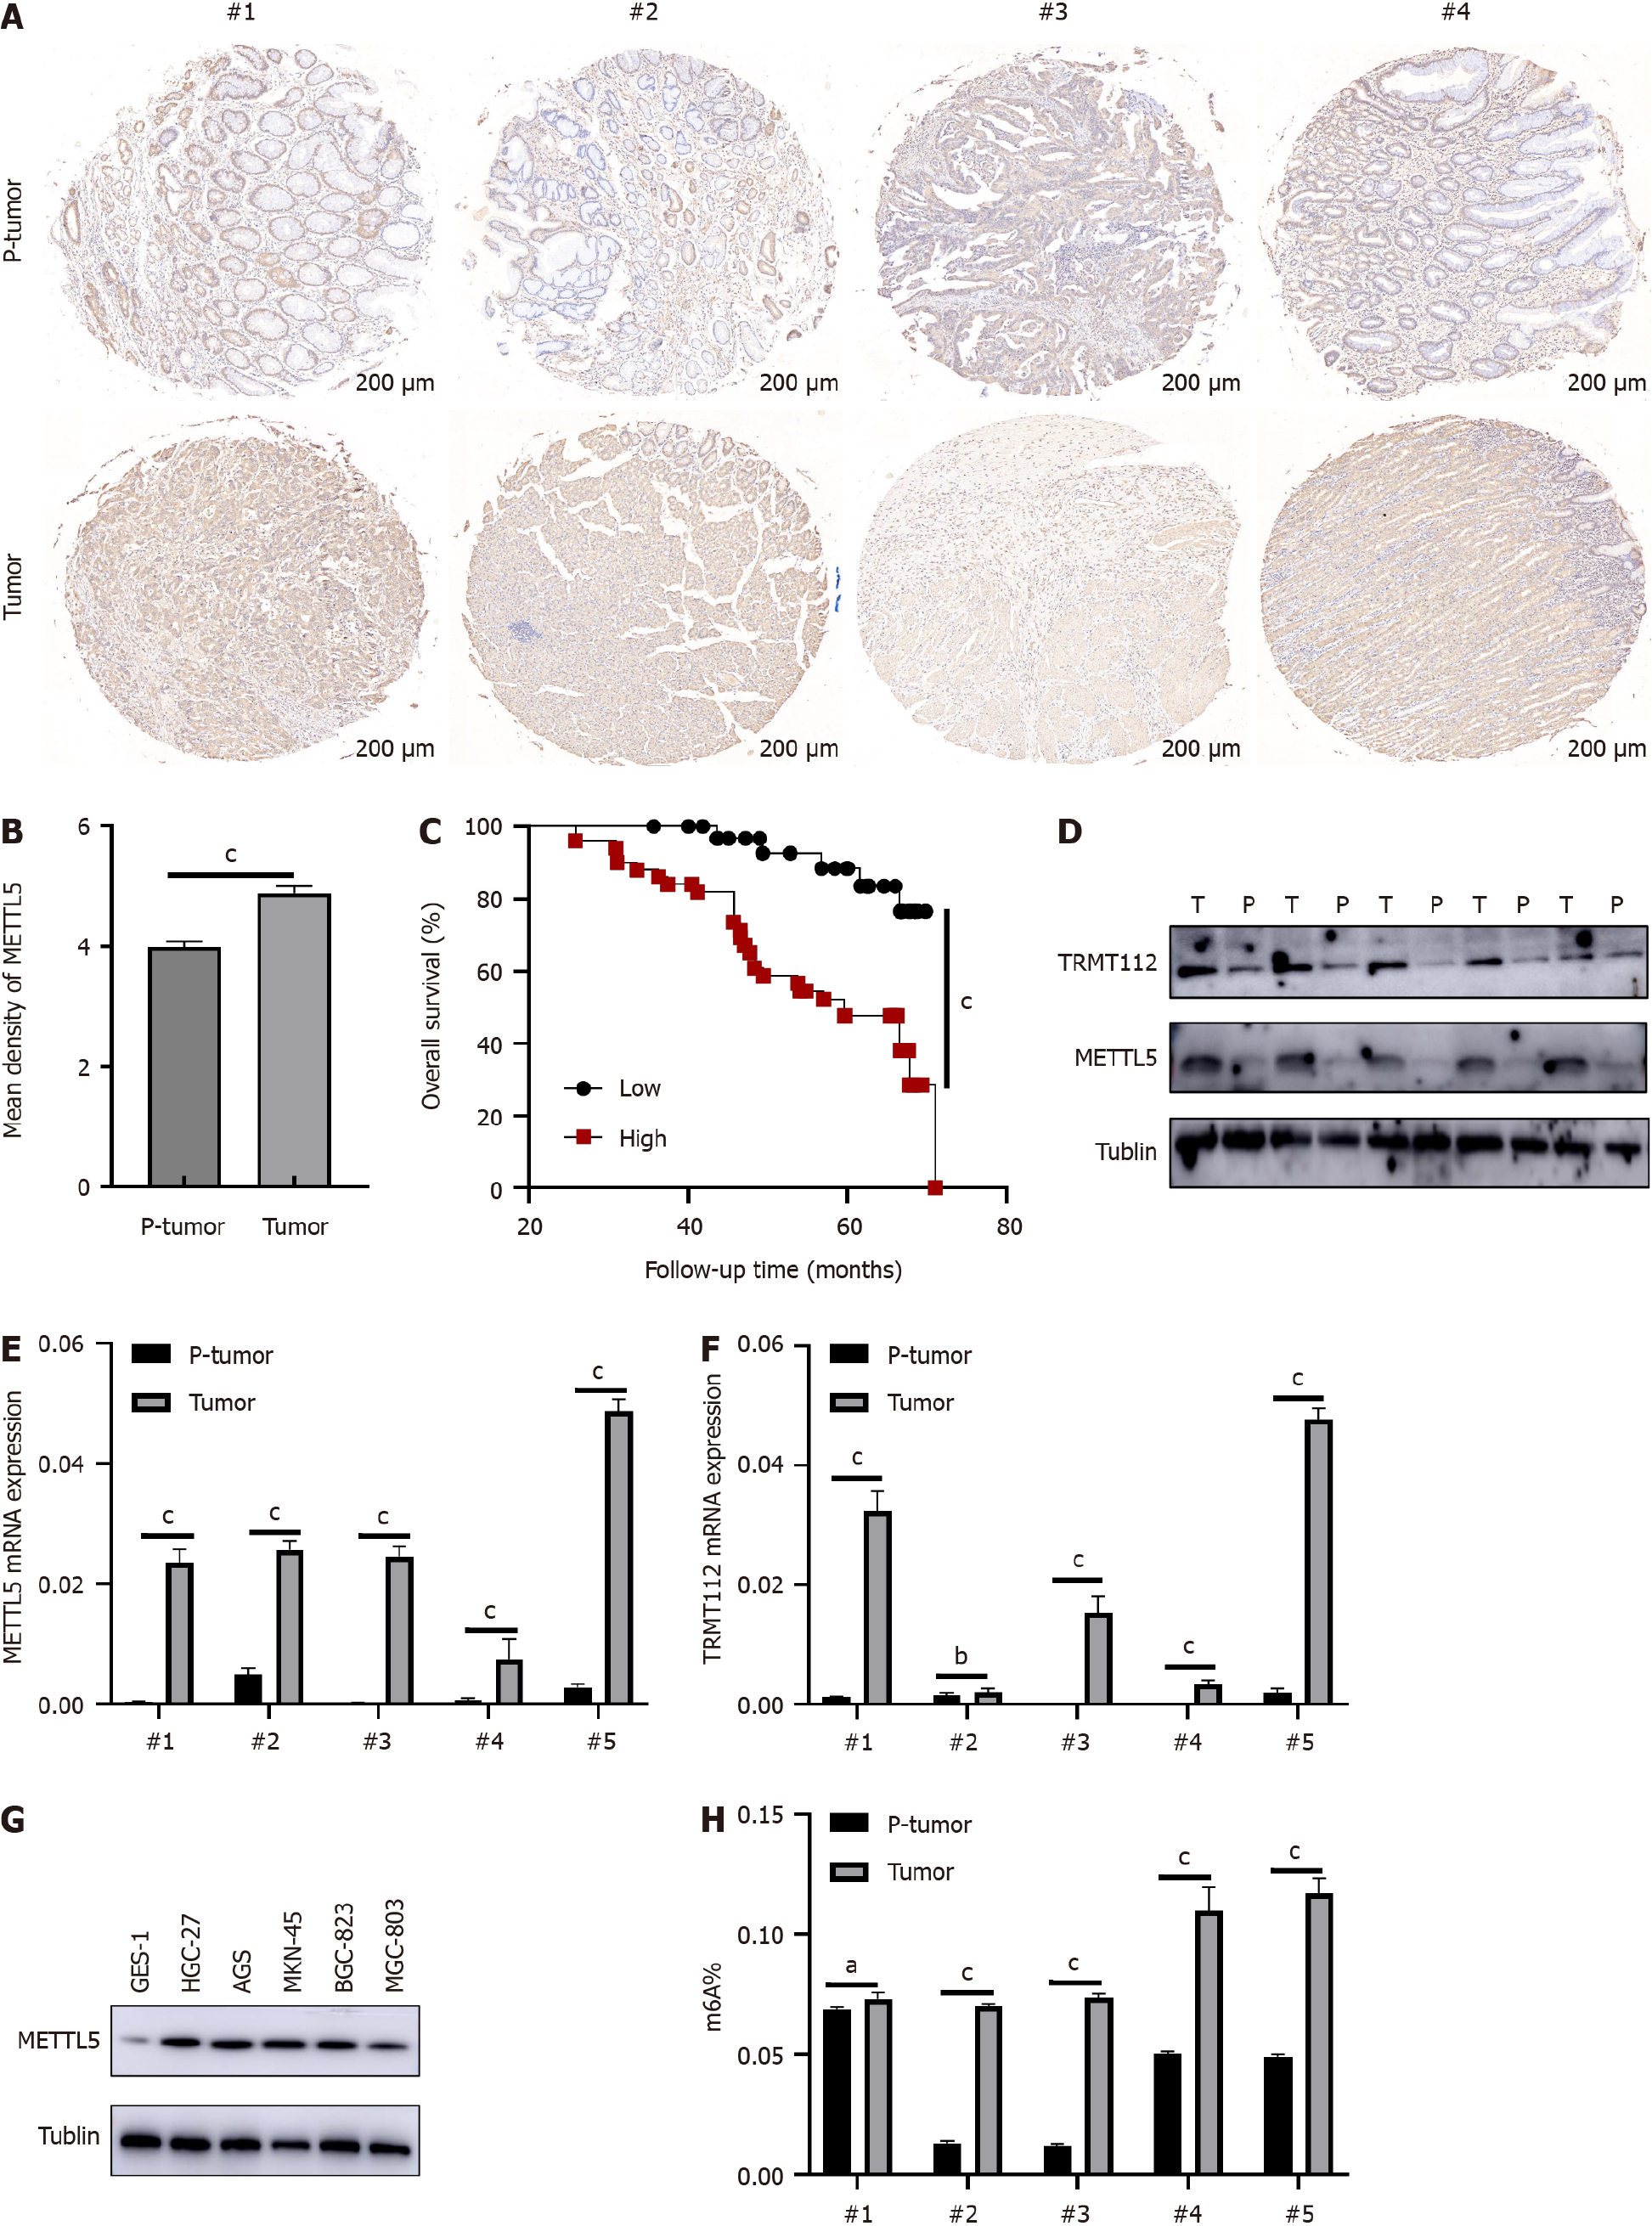
Figure 2 Elevated METTL5 expression were exhibited in patients with gastric cancer.
A: Representative immunohistochemistry staining showing METTL5 protein expression in gastric cancer (GC) and paracancerous tissue tissues; B: Staining intensity score of METTL5 in GC tissue microarray; C: Higher expression of METTL5 implied poorer prognosis; D: Western blot of METTL5 and TRMT112 expression in 5 pairs of GC and paracancerous tissue; E and F: The RNA expression of METTL5 and TRMT112 in 5 pairs of GC and paracancerous tissue; G: Western blot of METTL5 expression in gastric mucosal epithelial cells as well as 5 types of GC cells; H: The m6A methylation was measured by m6A RNA Methylation Assay in 5 pairs of GC and paracancerous tissue. aP < 0.05, bP < 0.01, cP < 0.001.
Figure 3 METTL5 knockdown inhibited the malignant phenotype of gastric cancer cells.
A: Western blot of METTL5 knockdown efficiency in HGC-27 and AGS cells; B and C: Reverse-transcription PCR of the knockout efficiency of METTL5 in HGC-27 and AGS cells; D and E: RNA expression of TRMT112 in HGC-27 and AGS after METTL5 knockdown; F and G: The Cell Counting Kit-8 assay experiment assay to detect the proliferation ability of HGC-27 and AGS cells after METTL5 knockdown; H and I: Clone formation assay to detect the proliferation ability of HGC-27 and AGS cells after METTL5 knockdown; J and K: Transwell assay to detect invasion ability of HGC-27 and AGS cells after METTL5 knockdown; L and M: A wound-healing motility assay was used to detect the migration ability of HGC-27 and AGS cells after METTL5 knockdown; N and O: Flow cytometry was used to detect the apoptosis of HGC-27 and AGS cells after METTL5 knockdown. aP < 0.05, bP < 0.01, cP < 0.001.
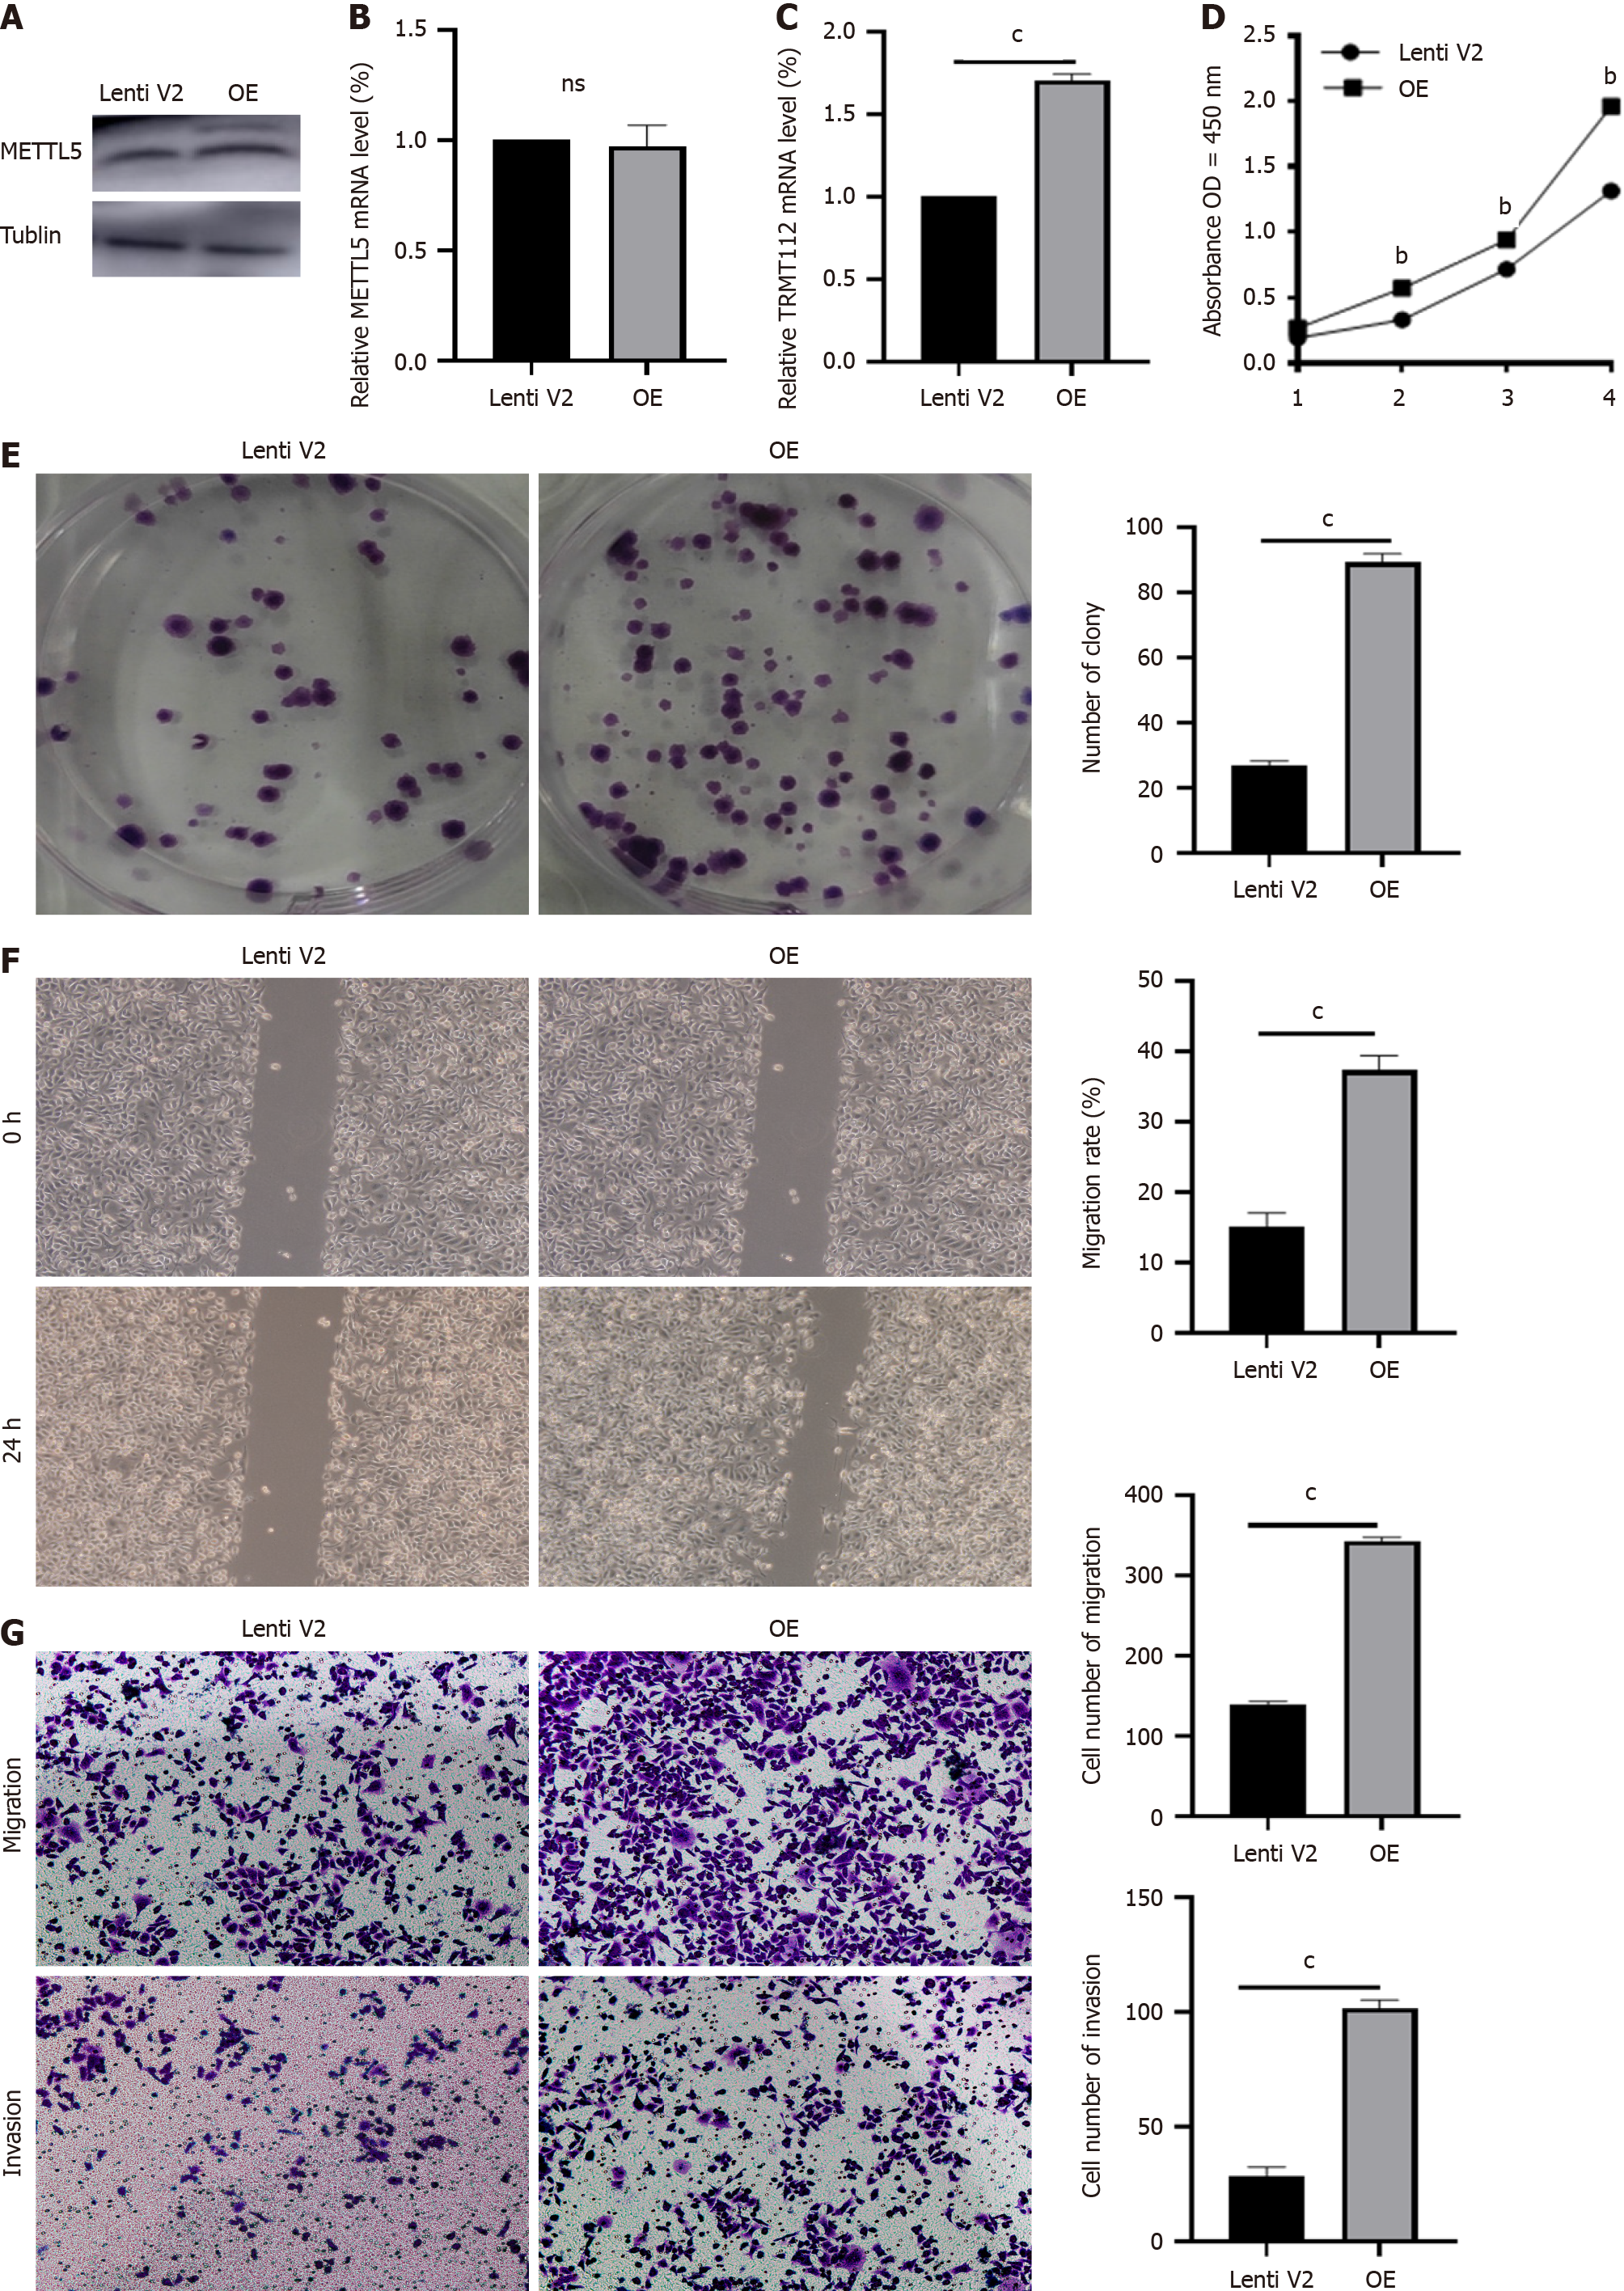
Figure 4 METTL5 overexpression promoted malignant phenotype in gastric cancer cells.
A: Western blot verified the overexpression efficiency of METTL5 in AGS cells; B: The RNA expression of METTL5 in AGS cell with METTL5 overexpression; C: The RNA expression of TRMT112 in AGS cell with METTL5 overexpression; D: The Cell Counting Kit-8 assay detected the proliferation ability of AGS cell with METTL5 overexpression; E: Clone formation assay to detect the clone formation ability of AGS cell with METTL5 overexpression; F: The wound-healing motility assay to detect the migration ability of AGS cell with METTL5 overexpression; G: Transwell assay to detect the invasion ability of AGS cells with METTL5 overexpression. aP < 0.05, bP < 0.01, cP < 0.001.
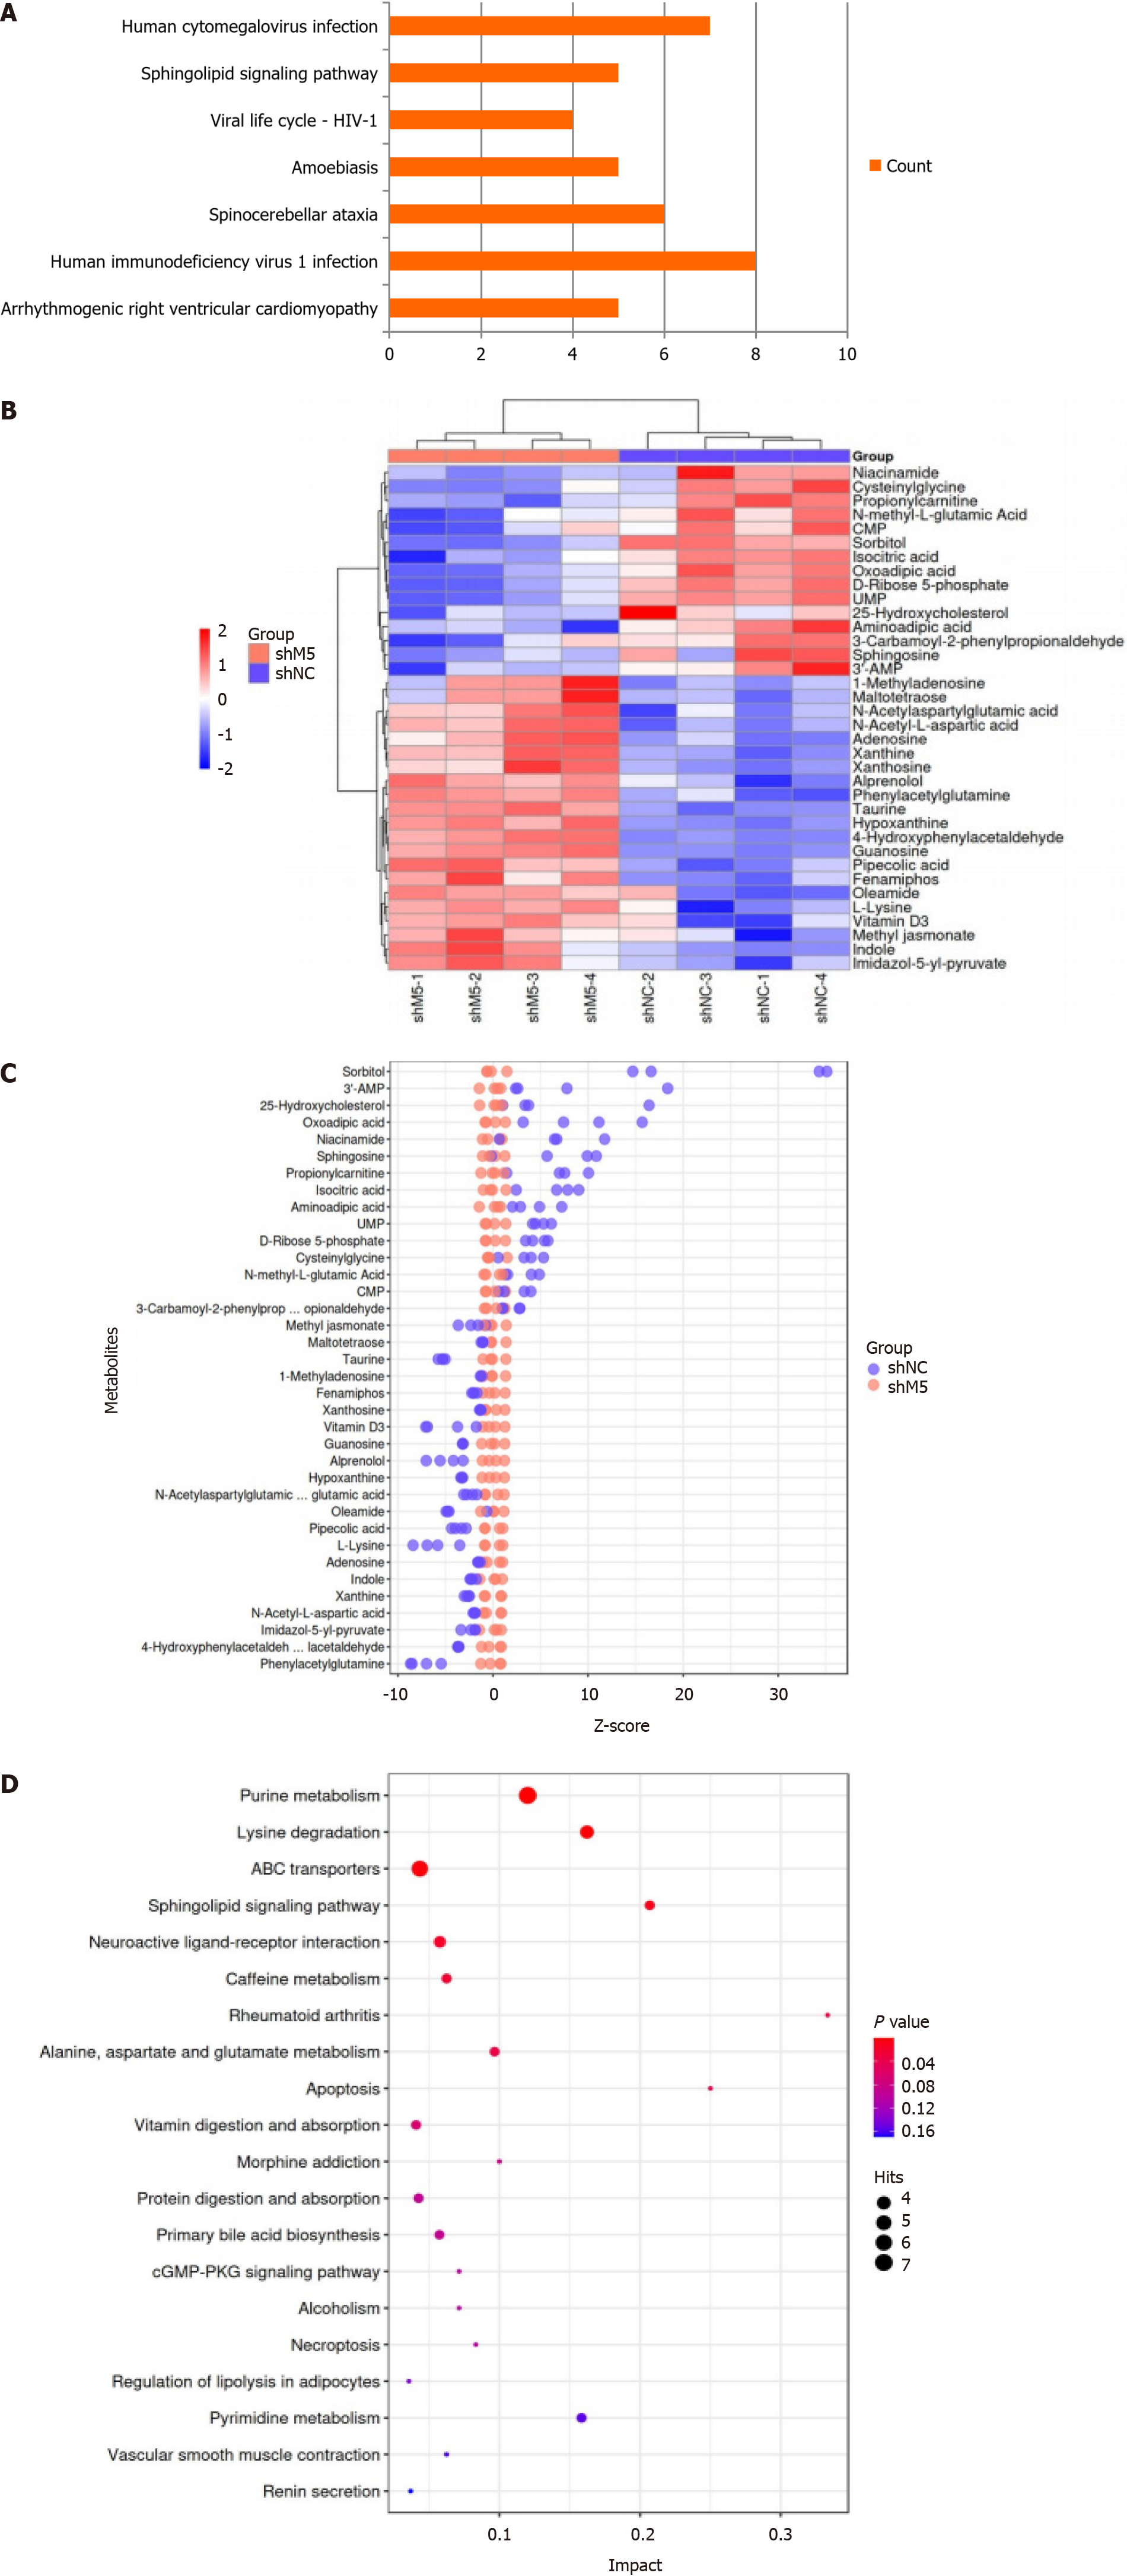
Figure 5 METTL5 promoted gastric cancer progression via sphingomyelin metabolism.
A: Kyoto Encyclopedia of Genes and Genomes demonstrated that METTL5 was associated with sphingolipid metabolism; B: Heatmap of differential metabolites in HGC-27shNC and HGC-27shM5 cell; C: Changes in the relative content of differential metabolites in HGC-27shNC and HGC-27shM5 cell; D: Metabolic pathways of differential metabolites in HGC-27shNC and HGC-27shM5 cell.
Figure 6 Supplementing s1p could partially rescue the phenotype caused by METTL5 knockdown.
A: Enzyme-linked immunosorbent assay to detect the content of sphingosine in HGC-27, AGS cells after METTL5 knockdown and METTL5 overexpression; B: Cell Counting Kit-8 assay to detect cell proliferation ability after addition of s1p in HGC-27 and AGS cells with METTL5 knockdown; C: Clone formation assay to detect cell clone formation ability after the addition of s1p in HGC-27 and AGS cells with METTL5 knockdown; D: The wound-healing motility assay to detect migration formation ability after the addition of s1p in HGC-27 and AGS cells with METTL5 knockdown; E: Transwell assay to detect invasion formation ability after the addition of s1p in HGC-27 and AGS cells with METTL5 knockdown. aP < 0.05, bP < 0.01, cP < 0.001.
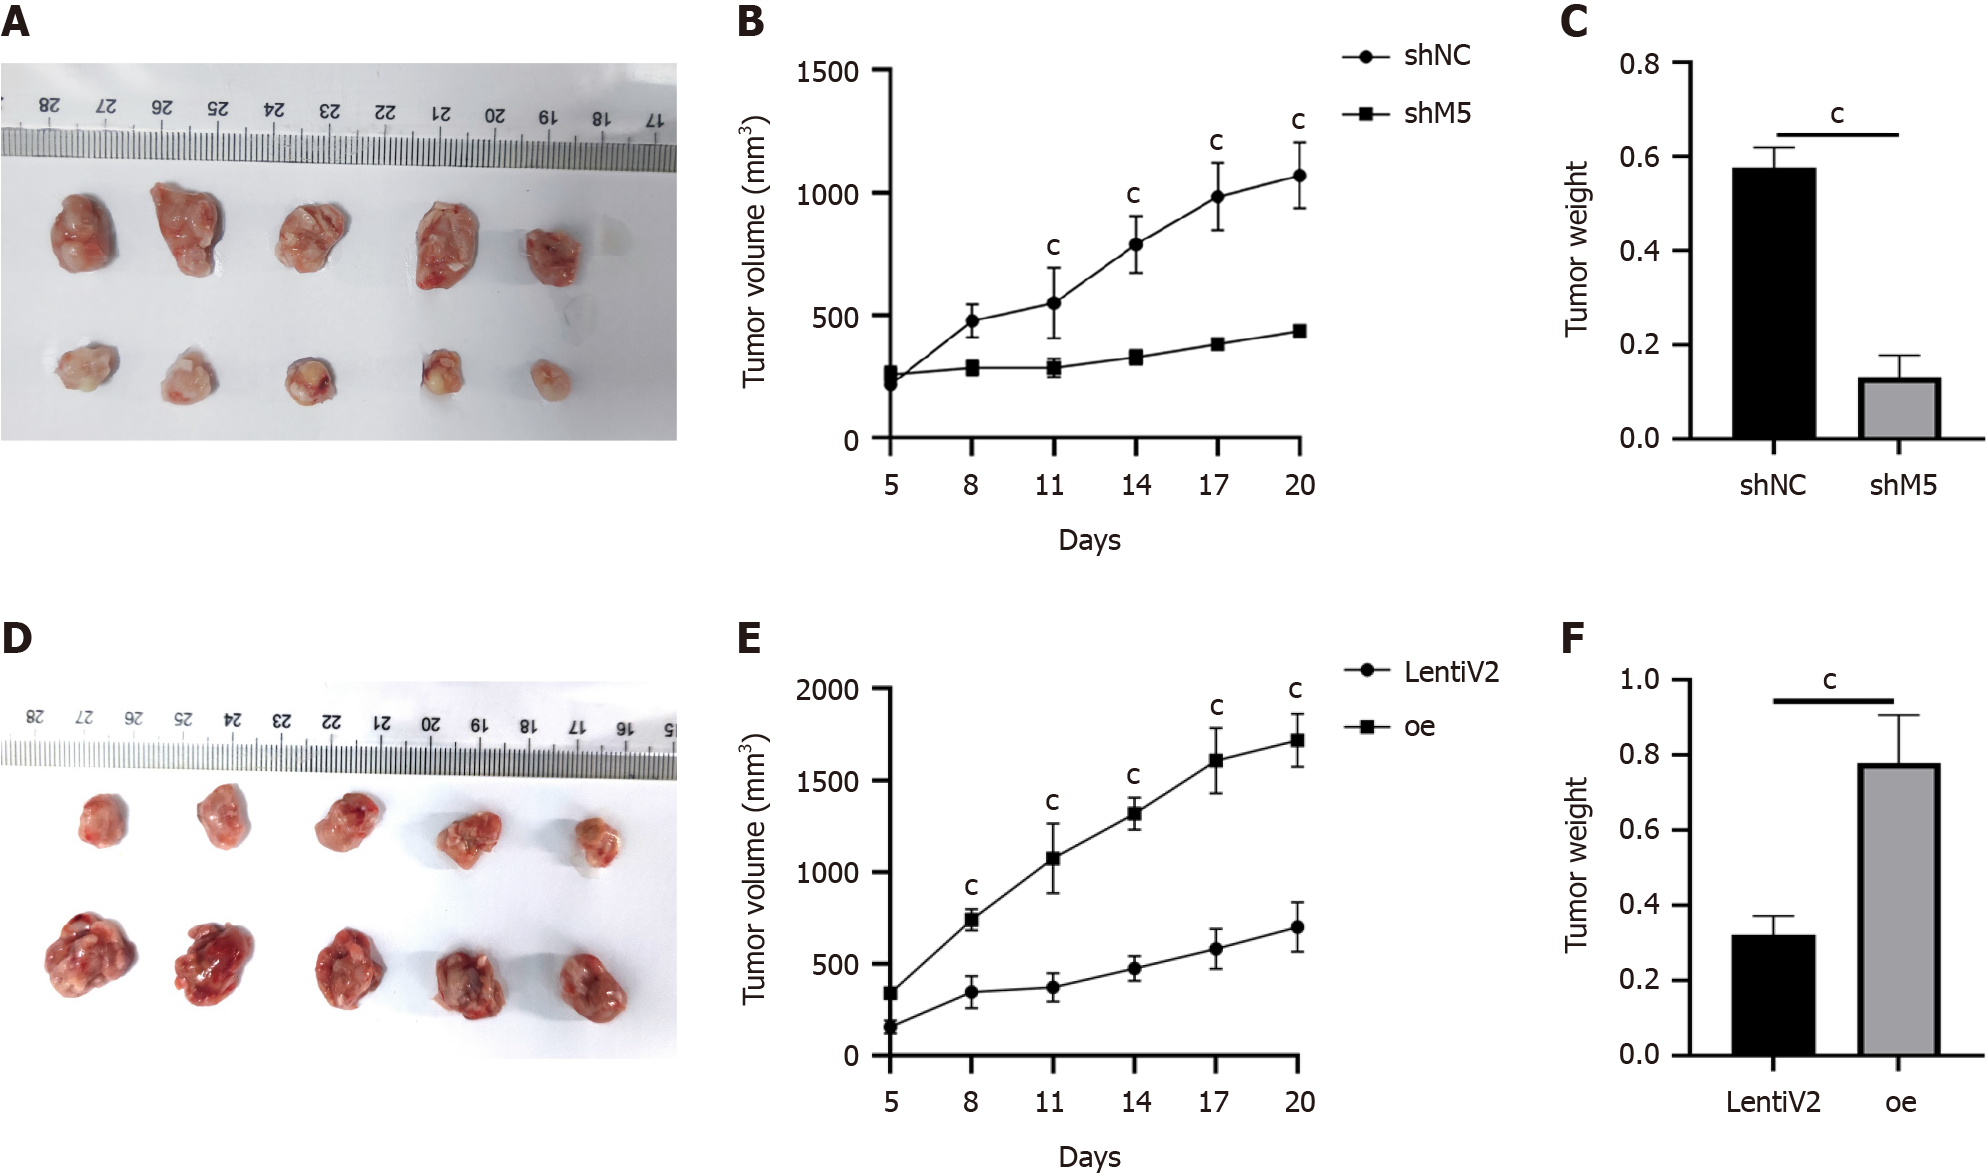
Figure 7 Knockdown and overexpression of METTL5 influenced cell growth in vivo.
A: METTL5 knockout inhibited the growth of subcutaneous tumors in nude mice (n = 5); B and C: The tumor growth volume and weight were measured; D: METTL5 overexpression promoted the growth of subcutaneous tumors in nude mice (n = 5); E and F: The tumor growth volume and weight were measured every 3 days. aP < 0.05, bP < 0.01, cP < 0.001.
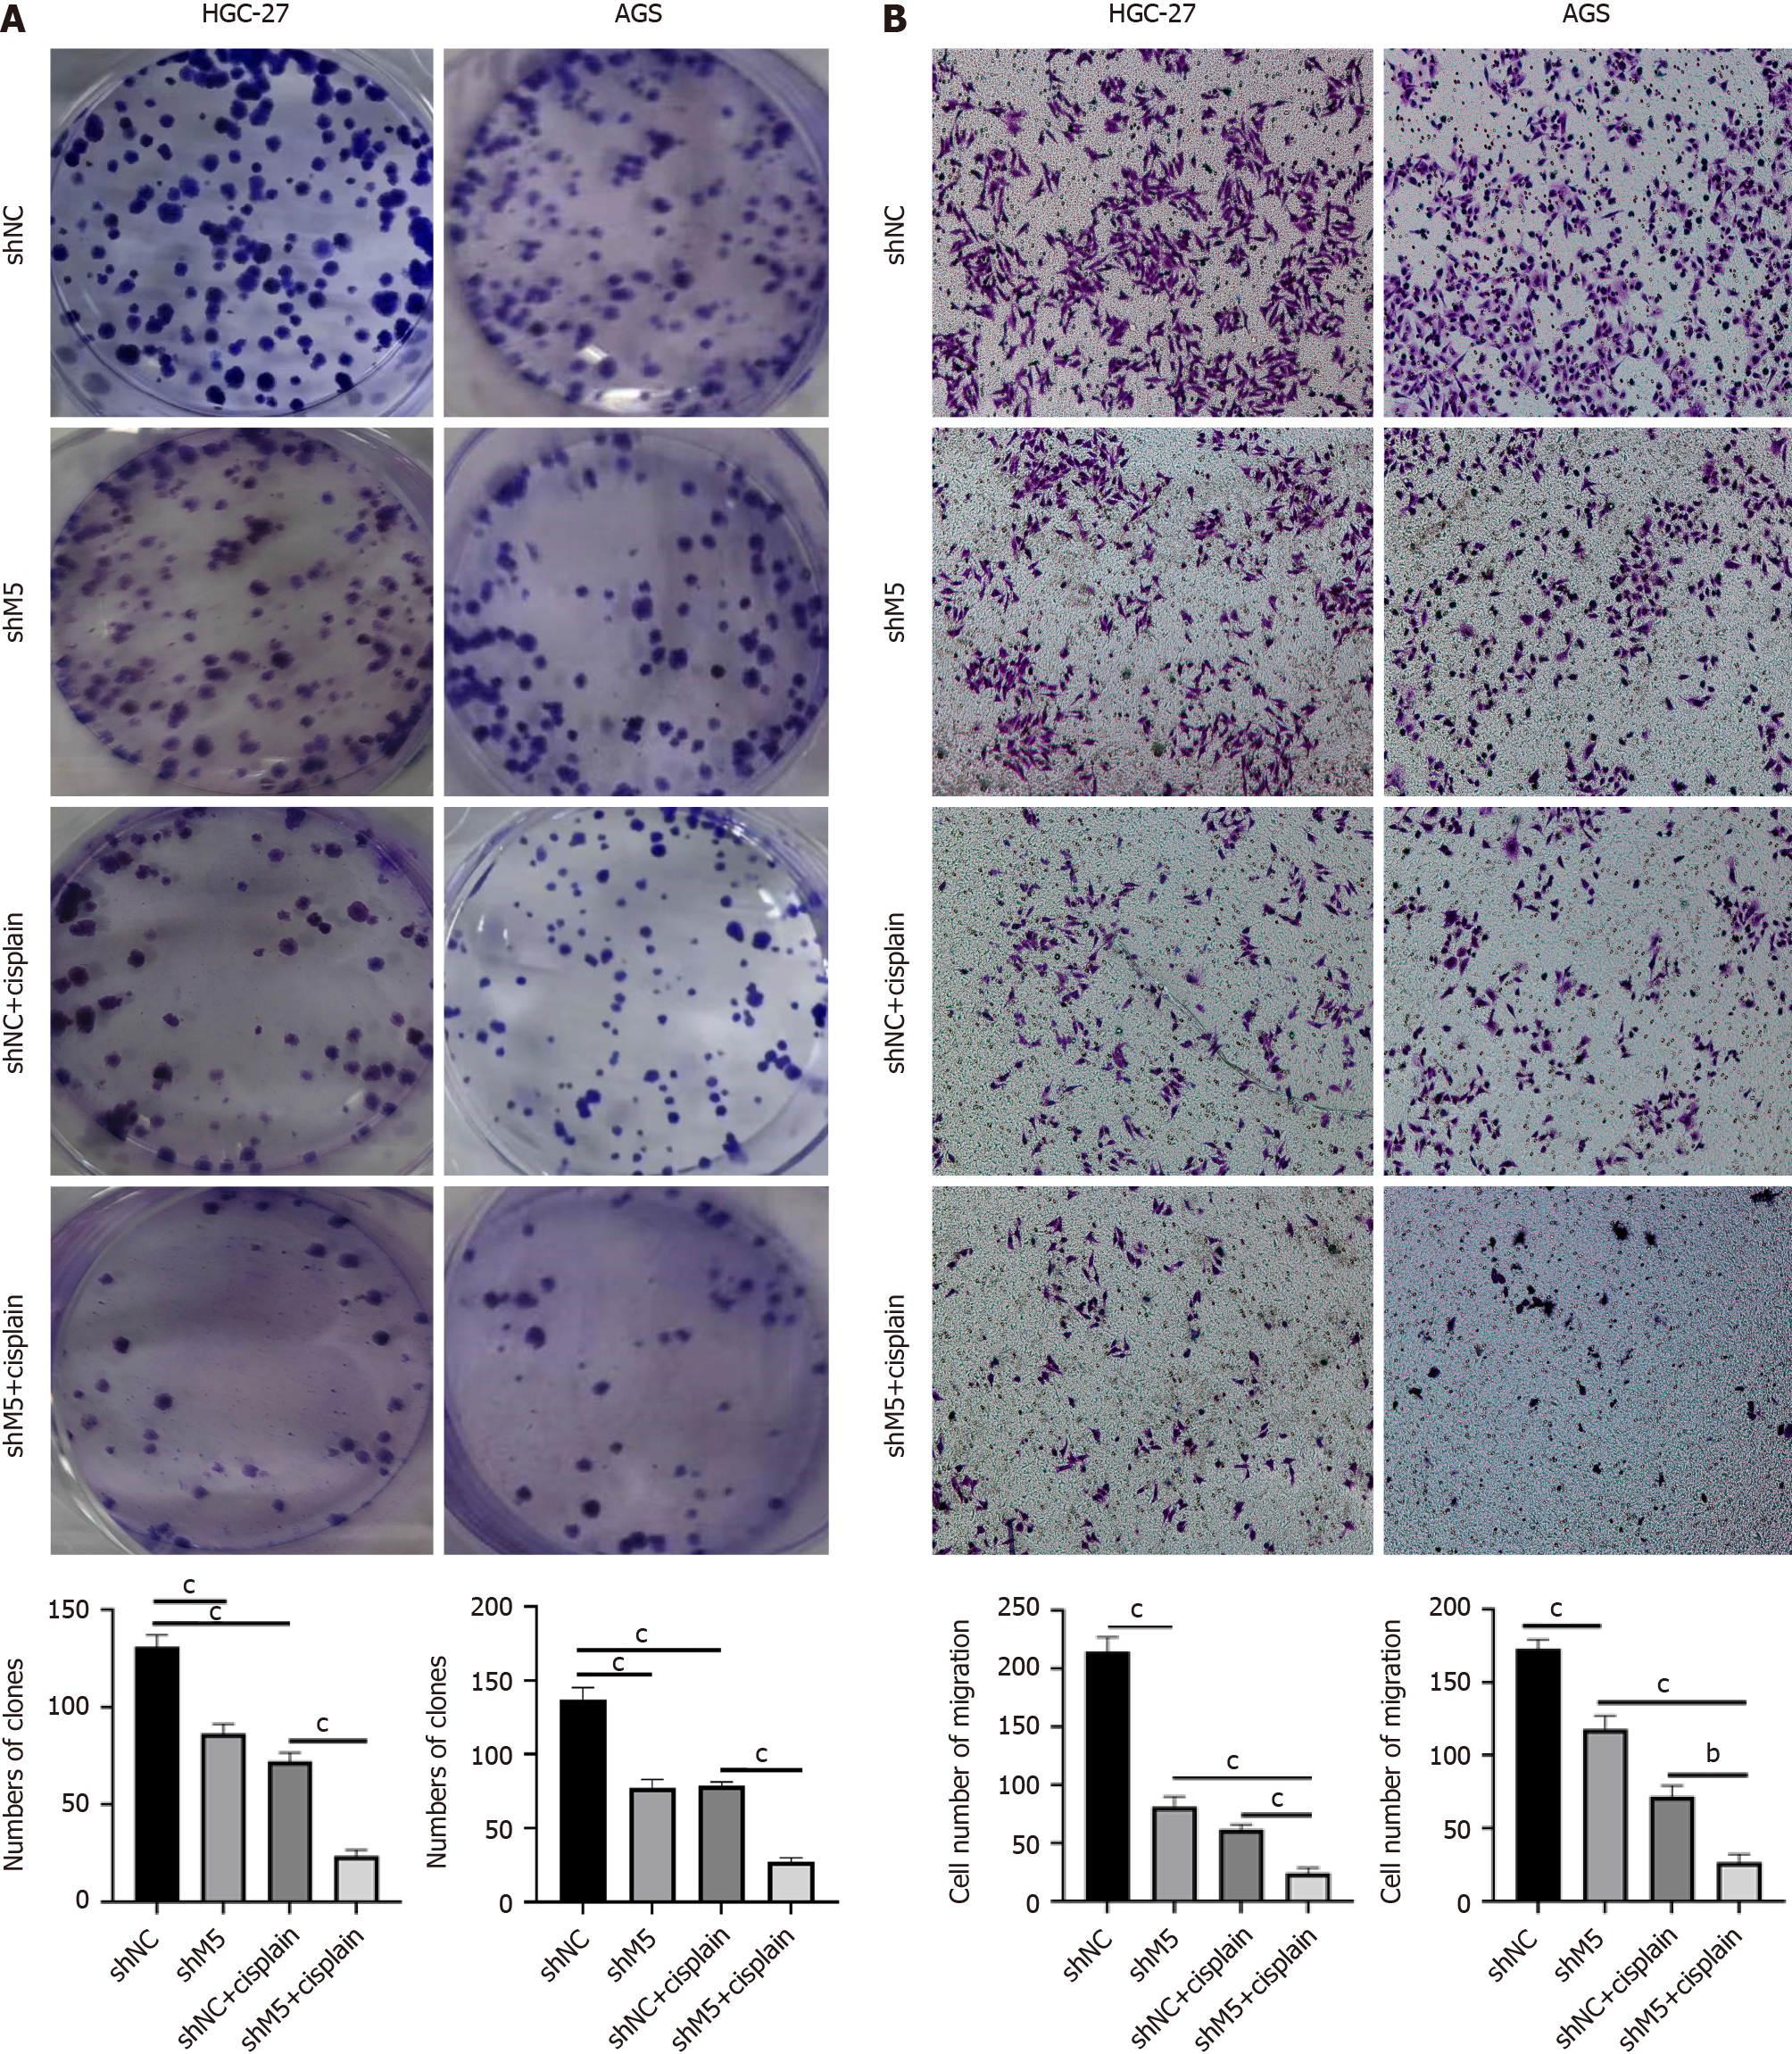
Figure 8 METTL5 blunted the sensitivity of gastric cancer cells to cisplatin.
A: Clone formation assay to detect the effect of cisplatin on the clone formation ability of gastric cancer cells after METTL5 knockdown; B: Transwell assay to detect the effect of cisplatin on the migration ability of gastric cancer cells after METTL5 knockdown. aP < 0.05, bP < 0.01, cP < 0.001.
- Citation: Zhang YQ, Li J, Qin Z, Li DM, Ye FZ, Bei SH, Zhang XH, Feng L. METTL5 promotes gastric cancer progression via sphingomyelin metabolism. World J Gastrointest Oncol 2024; 16(5): 1925-1946
- URL: https://www.wjgnet.com/1948-5204/full/v16/i5/1925.htm
- DOI: https://dx.doi.org/10.4251/wjgo.v16.i5.1925


