Copyright
©The Author(s) 2024.
World J Gastrointest Oncol. May 15, 2024; 16(5): 1908-1924
Published online May 15, 2024. doi: 10.4251/wjgo.v16.i5.1908
Published online May 15, 2024. doi: 10.4251/wjgo.v16.i5.1908
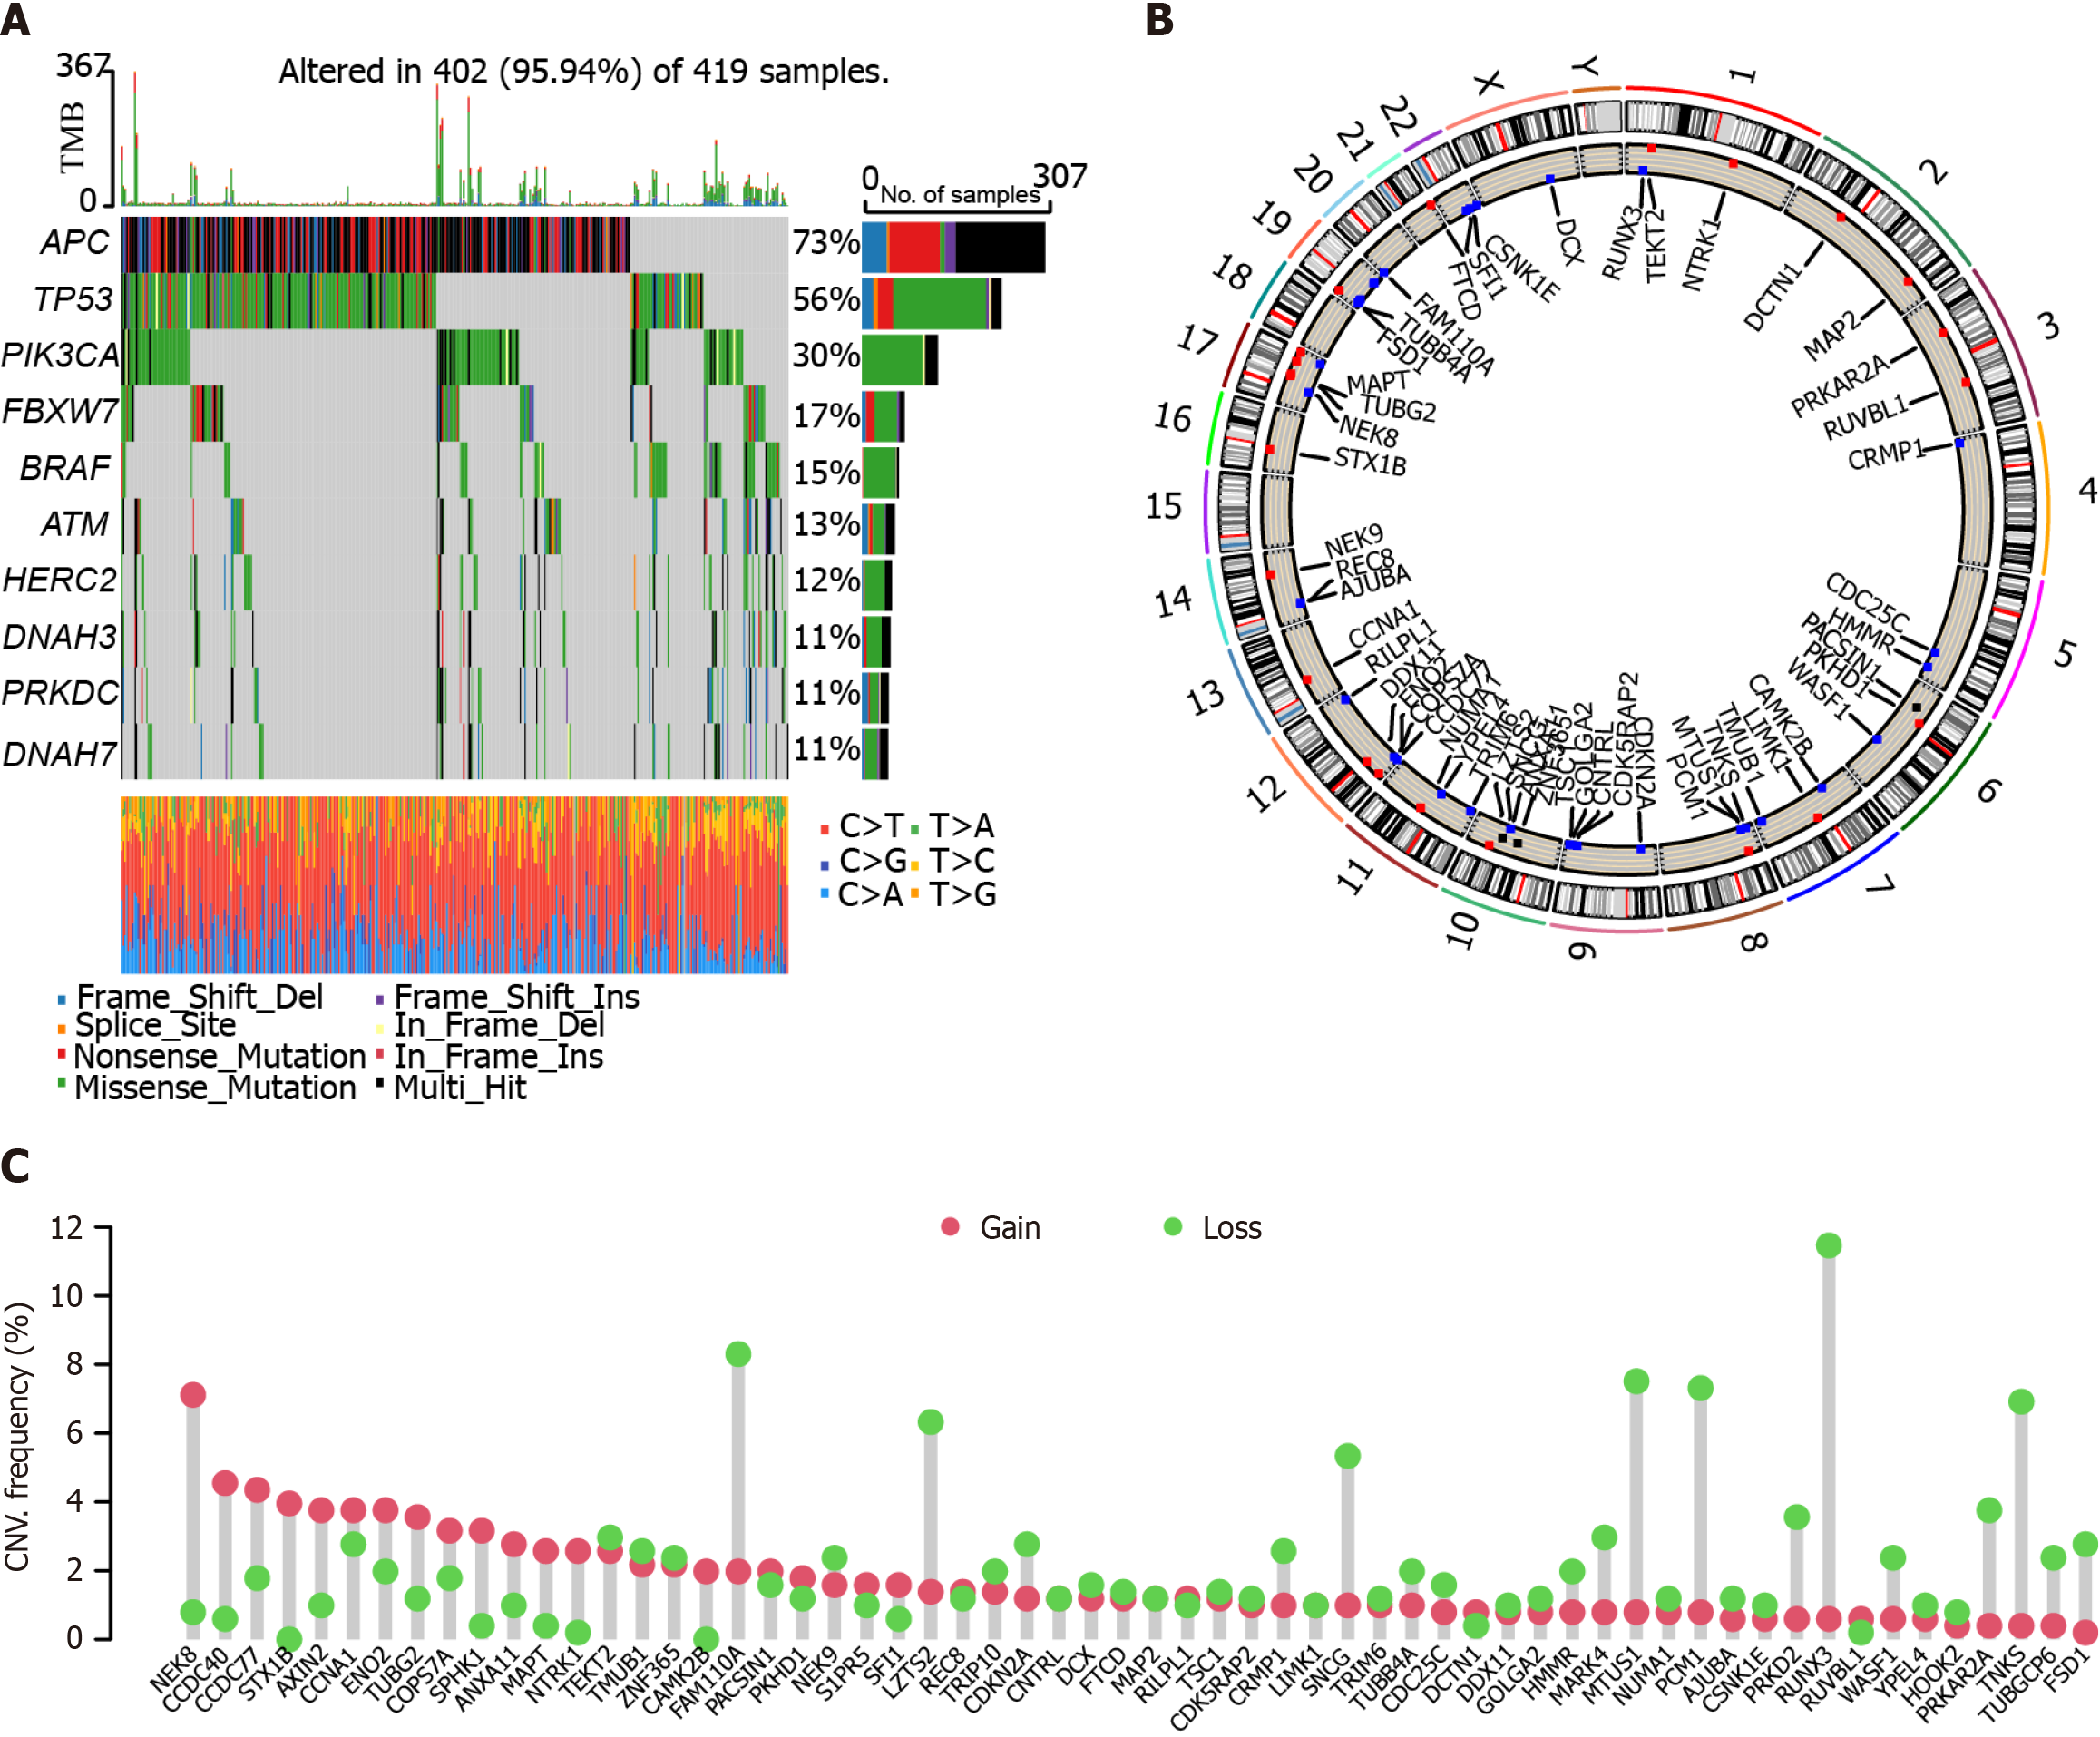
Figure 1 Mutation analysis of the Cancer Genome Atlas-Colon adenocarcinoma cohort.
A: Somatic mutation landscape in the Cancer Genome Atlas-Colon adenocarcinoma (TCGA-COAD) cohort; B: Circus diagram showing the distribution of mutations and genes. The outer circle stands for the chromosomes with labeled band. Red dots refer to the gain in copy number. Blue dots stand for loss in copy number; C: The copy number variation values of genes in the TCGA-COAD cohort. Red dots represent gain, and green dots refer to loss.
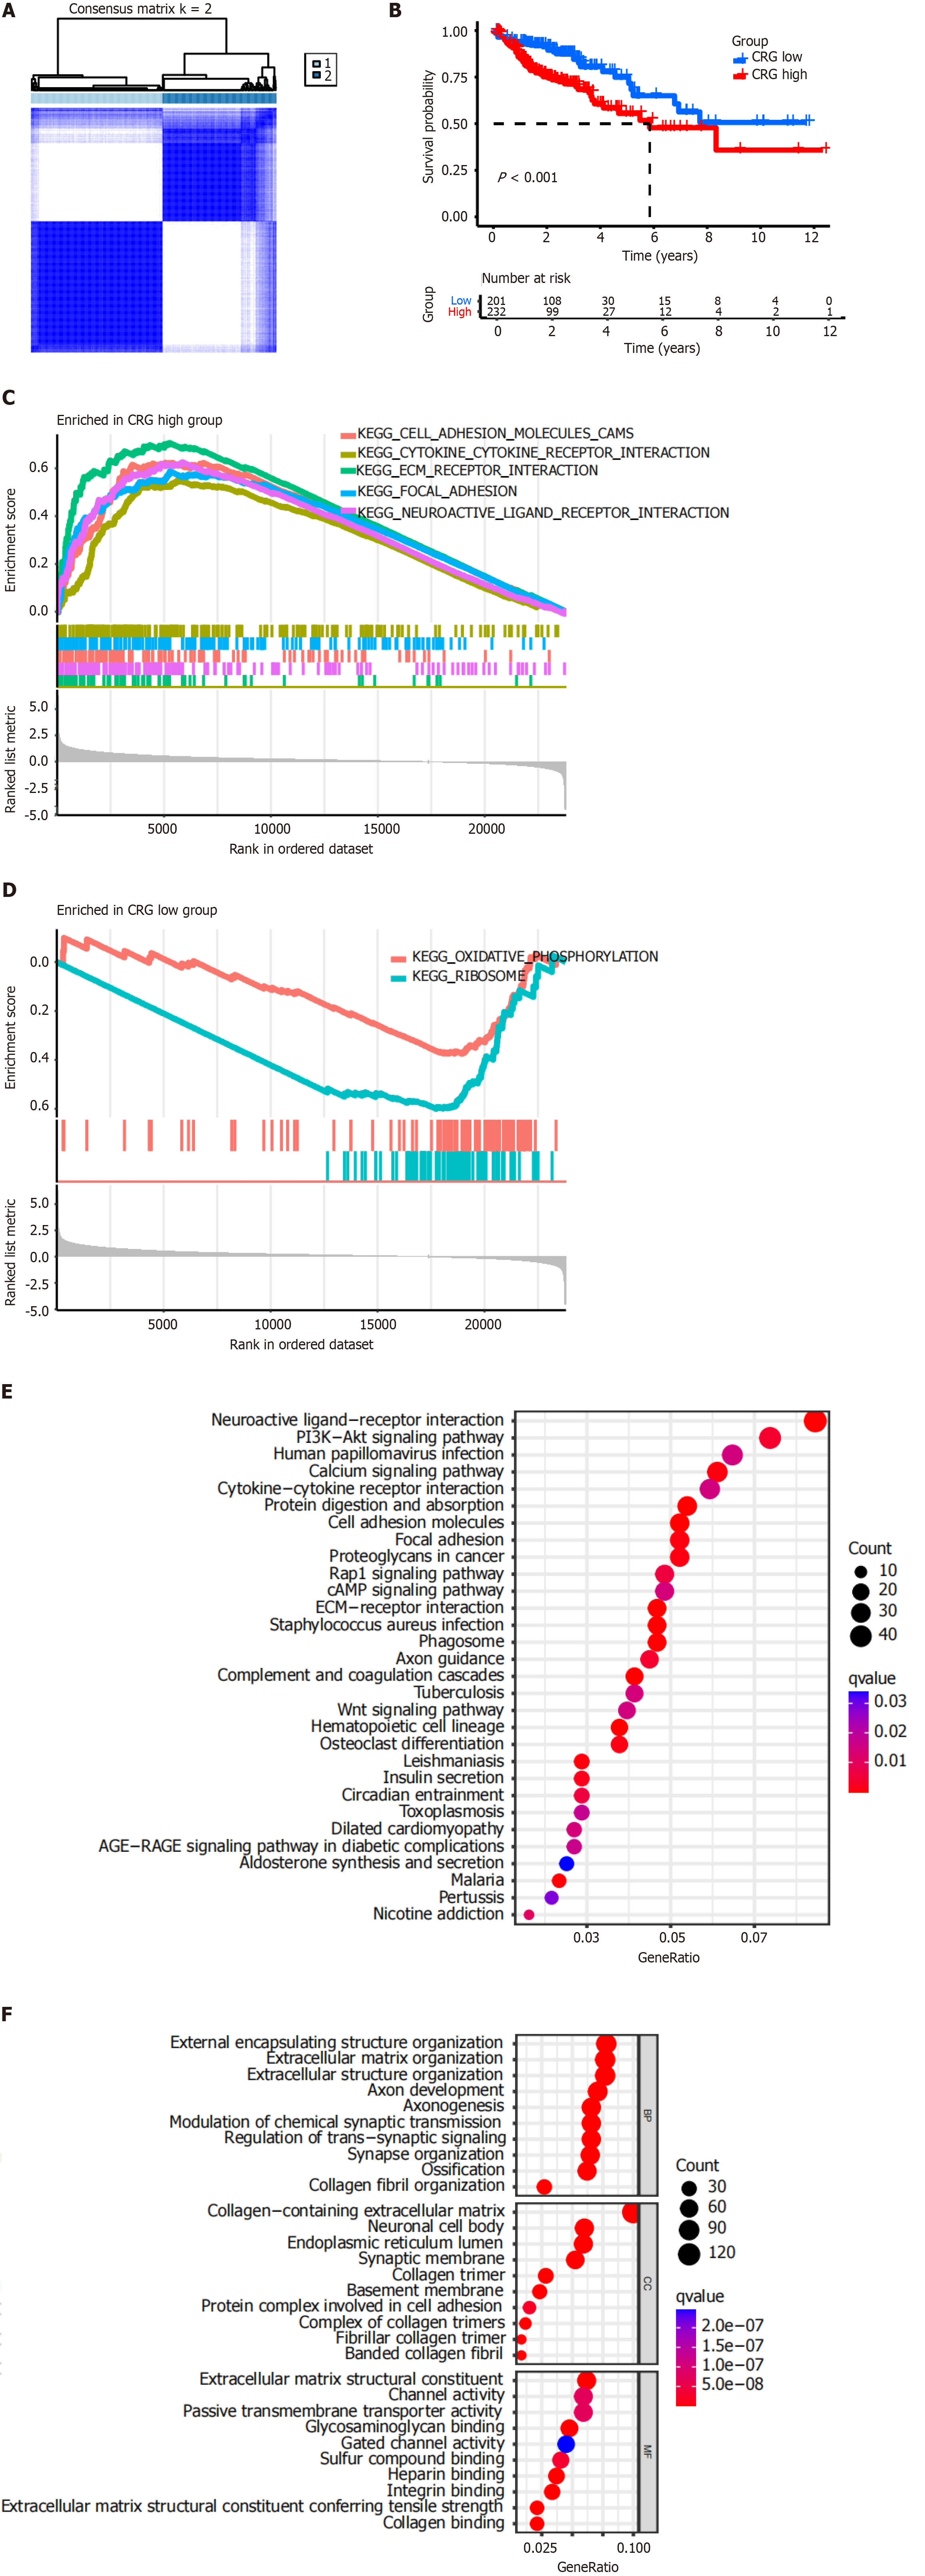
Figure 2 Characterization and functional enrichment of the centrosome-related genes in the Cancer Genome Atlas-Colon adeno
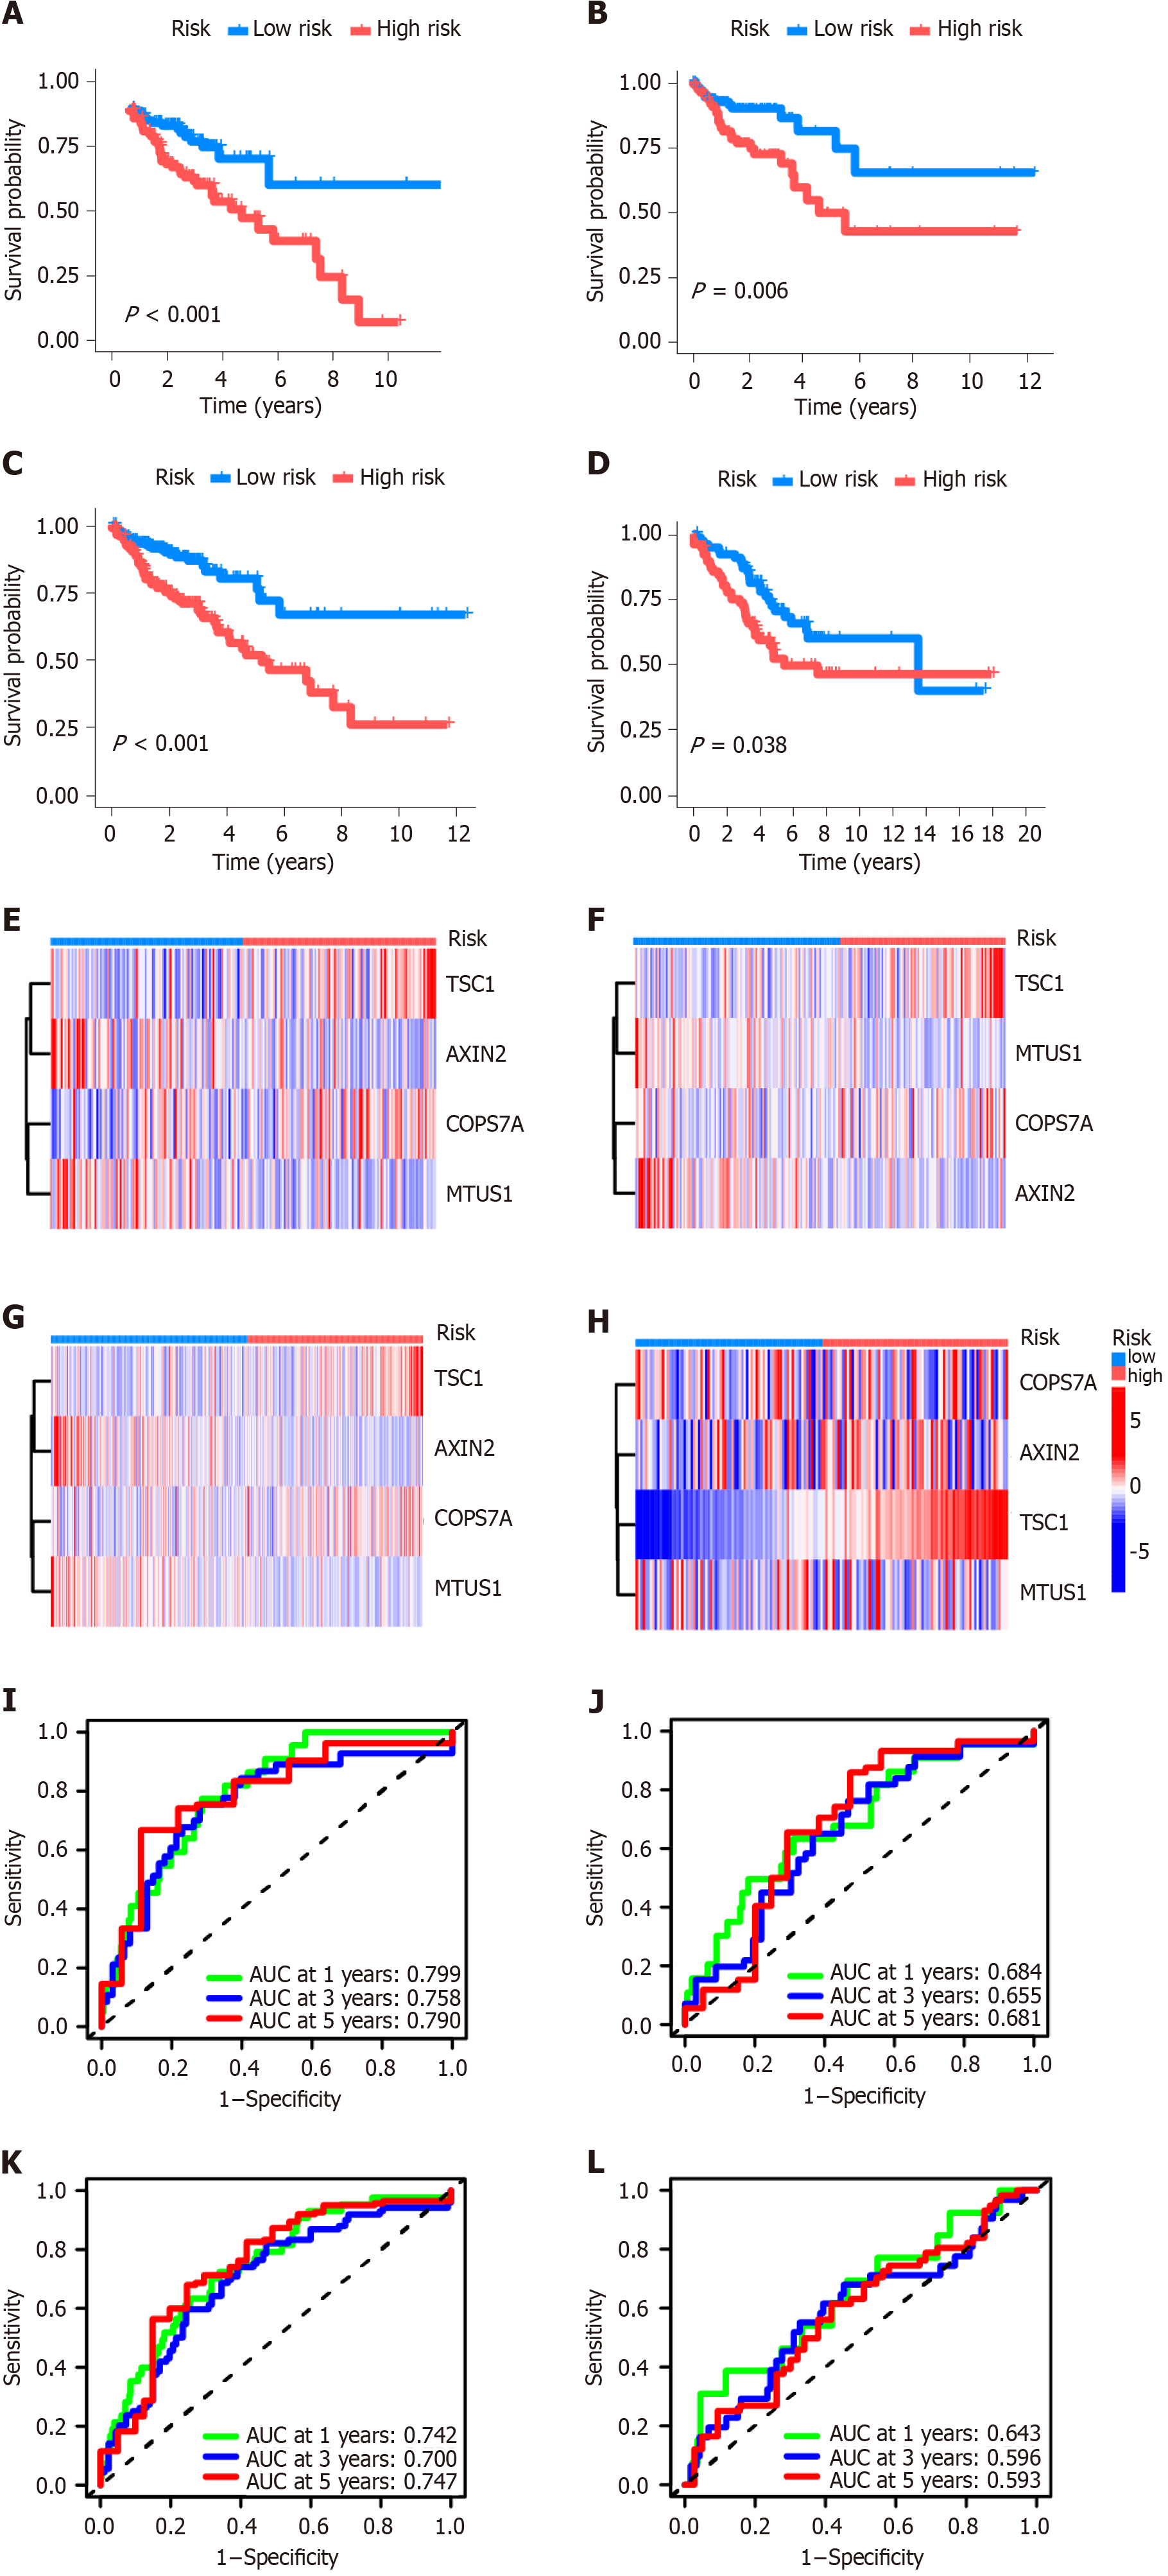
Figure 3 Efficiency of centrosome-related signature.
A: Kaplan-Meier plotter showed that a high-risk centrosome-related signature (CRS) was significantly related to poor survival in the training dataset, i.e., divided The Cancer Genome Atlas-Colon adenocarcinoma (TCGA-COAD) cohort; B-D: Kaplan-Meier plotter displayed that a high-risk CRS was significantly related to poor survival in the testing dataset, i.e., divided TCGA-COAD cohort, whole TCGA-COAD cohort, and GSE103479, respectively; E-H: Heat maps of CRS in the above-mentioned training dataset and three testing datasets; I-L: Receiver operating characteristic curves for 1-, 3-, and 5-year overall survival in the above-mentioned training dataset and three testing datasets.
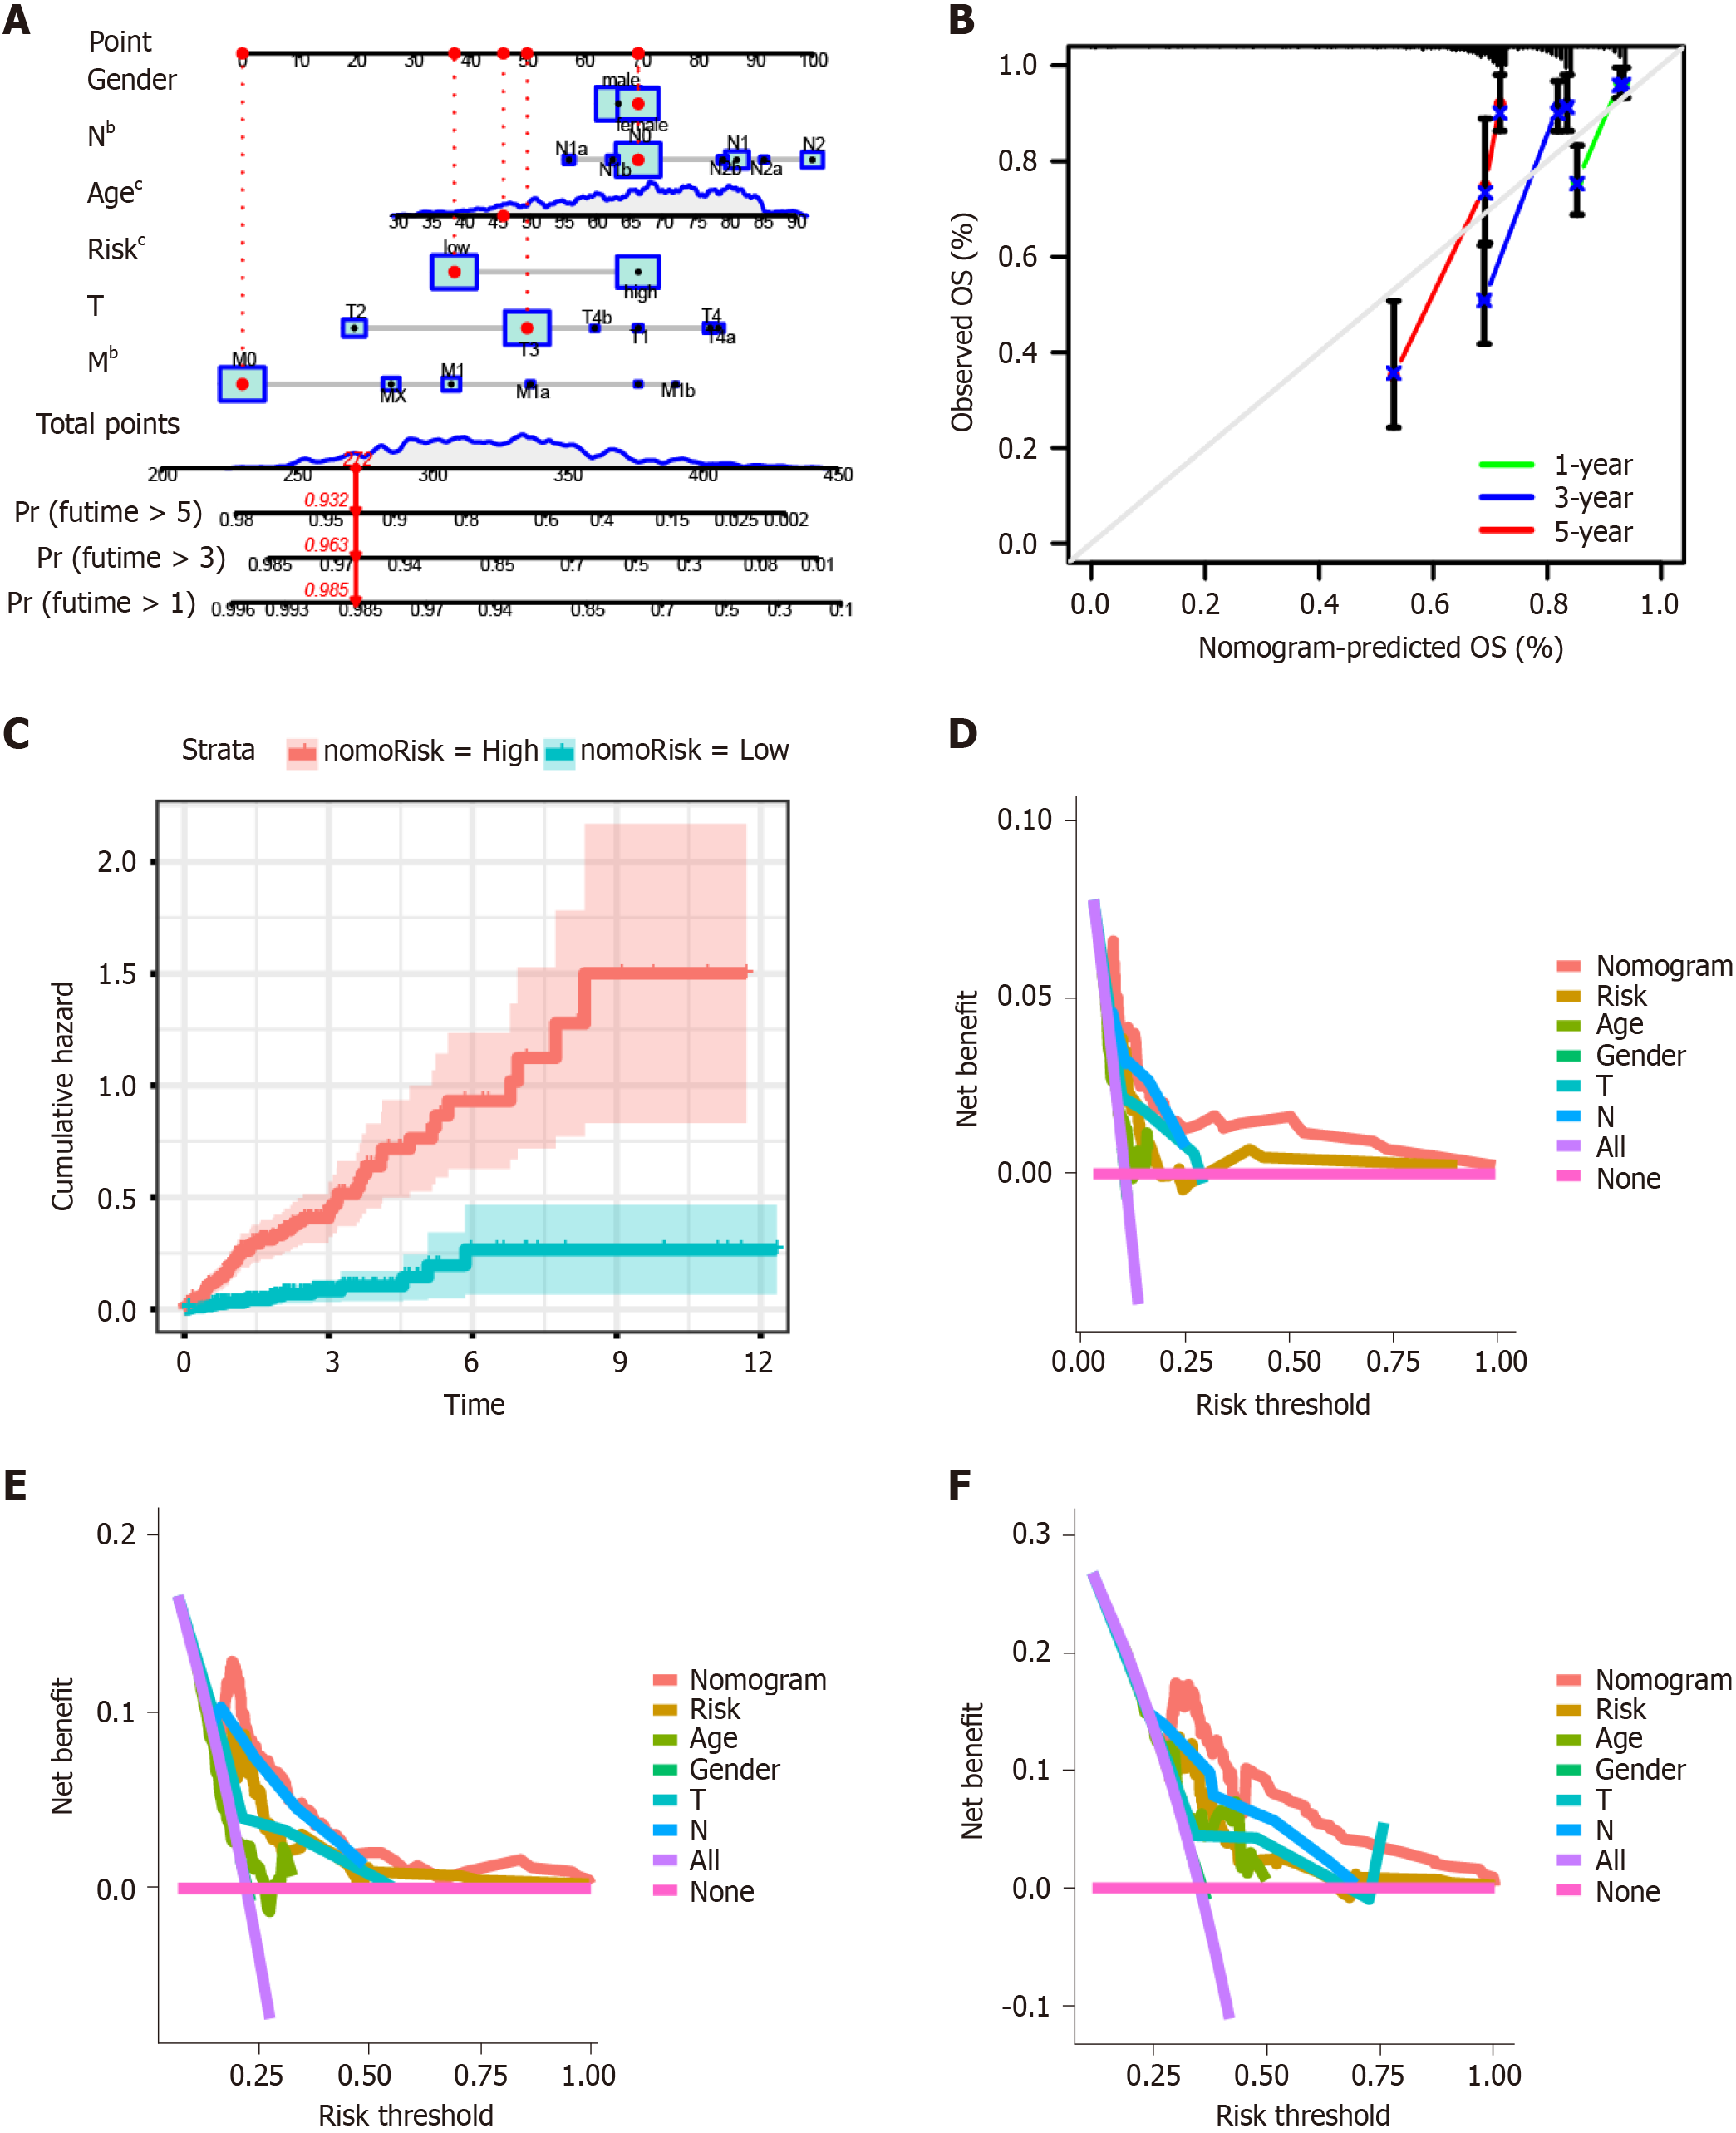
Figure 4 Construction of the prognostic nomogram.
A: A nomogram model was established to predict the prognostic of patients with colon cancer; B: Calibration curve showing the probability of 1-, 3-, and 5-year overall survival (OS) of patients with colon cancer; C: The cumulative hazard index of the model; D-F: Decision curve analysis showed the accuracy of the nomogram model was the best in predicting 1-, 3-, and 5-year OS among the predictors used in this study. bP < 0.01. cP < 0.001 vs high-risk and low-risk groups. AUC: Area under the curve.
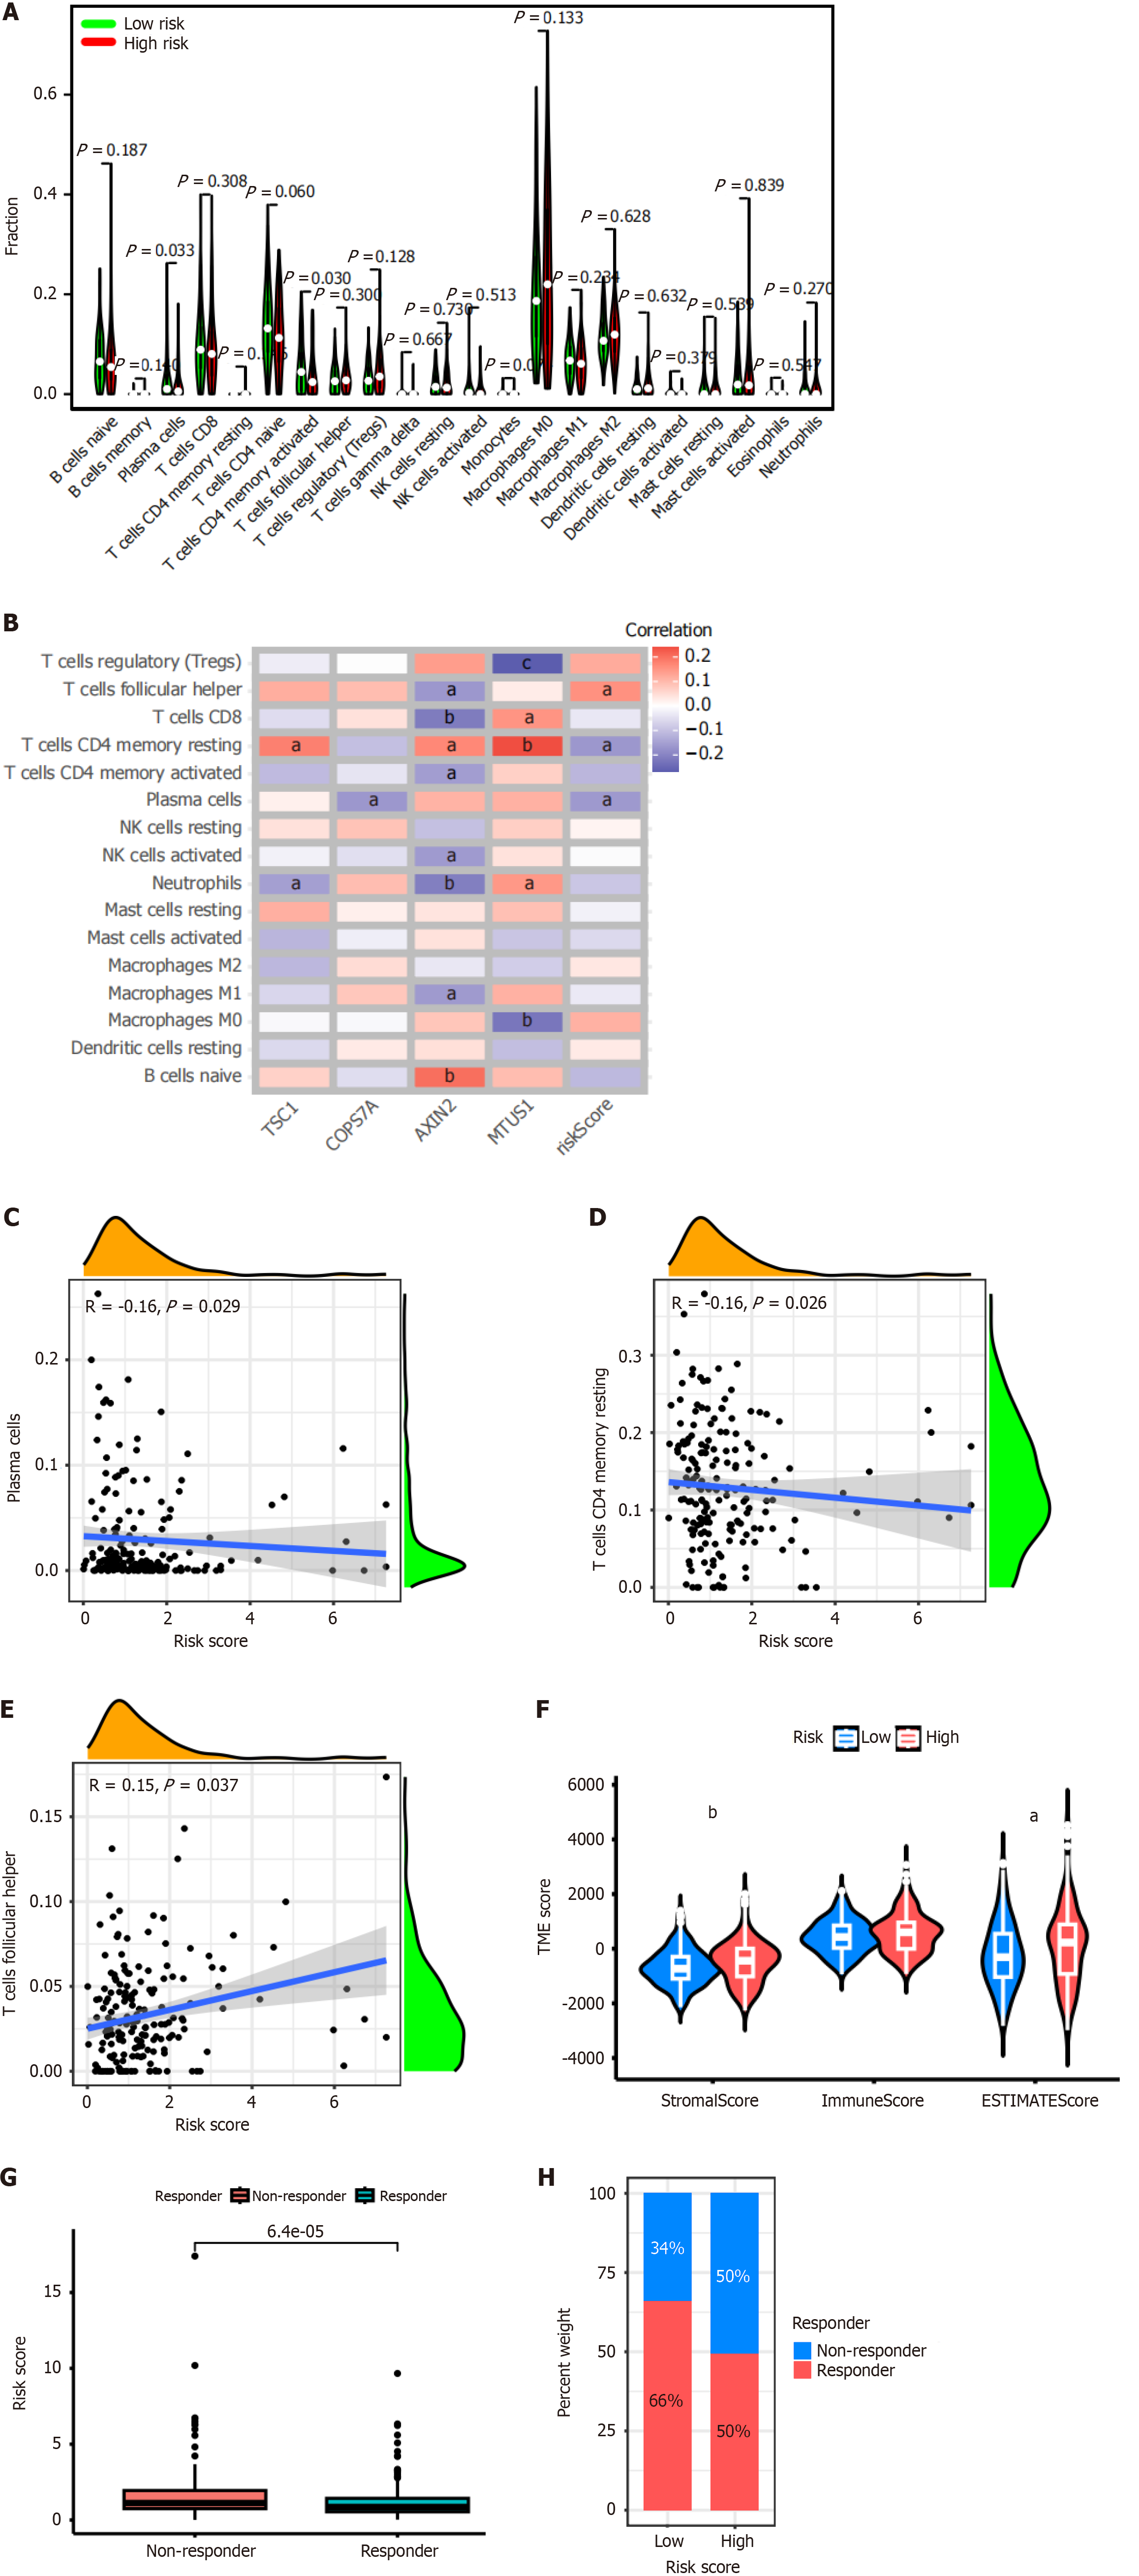
Figure 5 Analysis of tumor microenvironments and response to immunotherapy among patients with high- and low-risk centrosome-related signature.
A: The fraction of 22 CIBERSORT immune cell types in high- and low-risk subgroups; B: The correlation between each signature gene and 16 immune cell types using CIBERSORT; C-E: The correlation between the risk score of centrosome-related signature (CRS) and immune cell types using CIBERSORT; F: Comparison of the tumor microenvironment scores between high- and low-risk CRS using ESTIMATE. Stromal score and estimate score were significantly higher in the high-risk CRS group than in the low-risk CRS group (P < 0.01 and P < 0.05, respectively). No significant difference was found between these two groups for the immune score; G and H: Tumor immune dysfunction and exclusion algorithm showed patients with a high-risk signature were insensitive to immunotherapy. aP < 0.05. bP < 0.01. cP < 0.001 vs high-risk and low-risk groups.
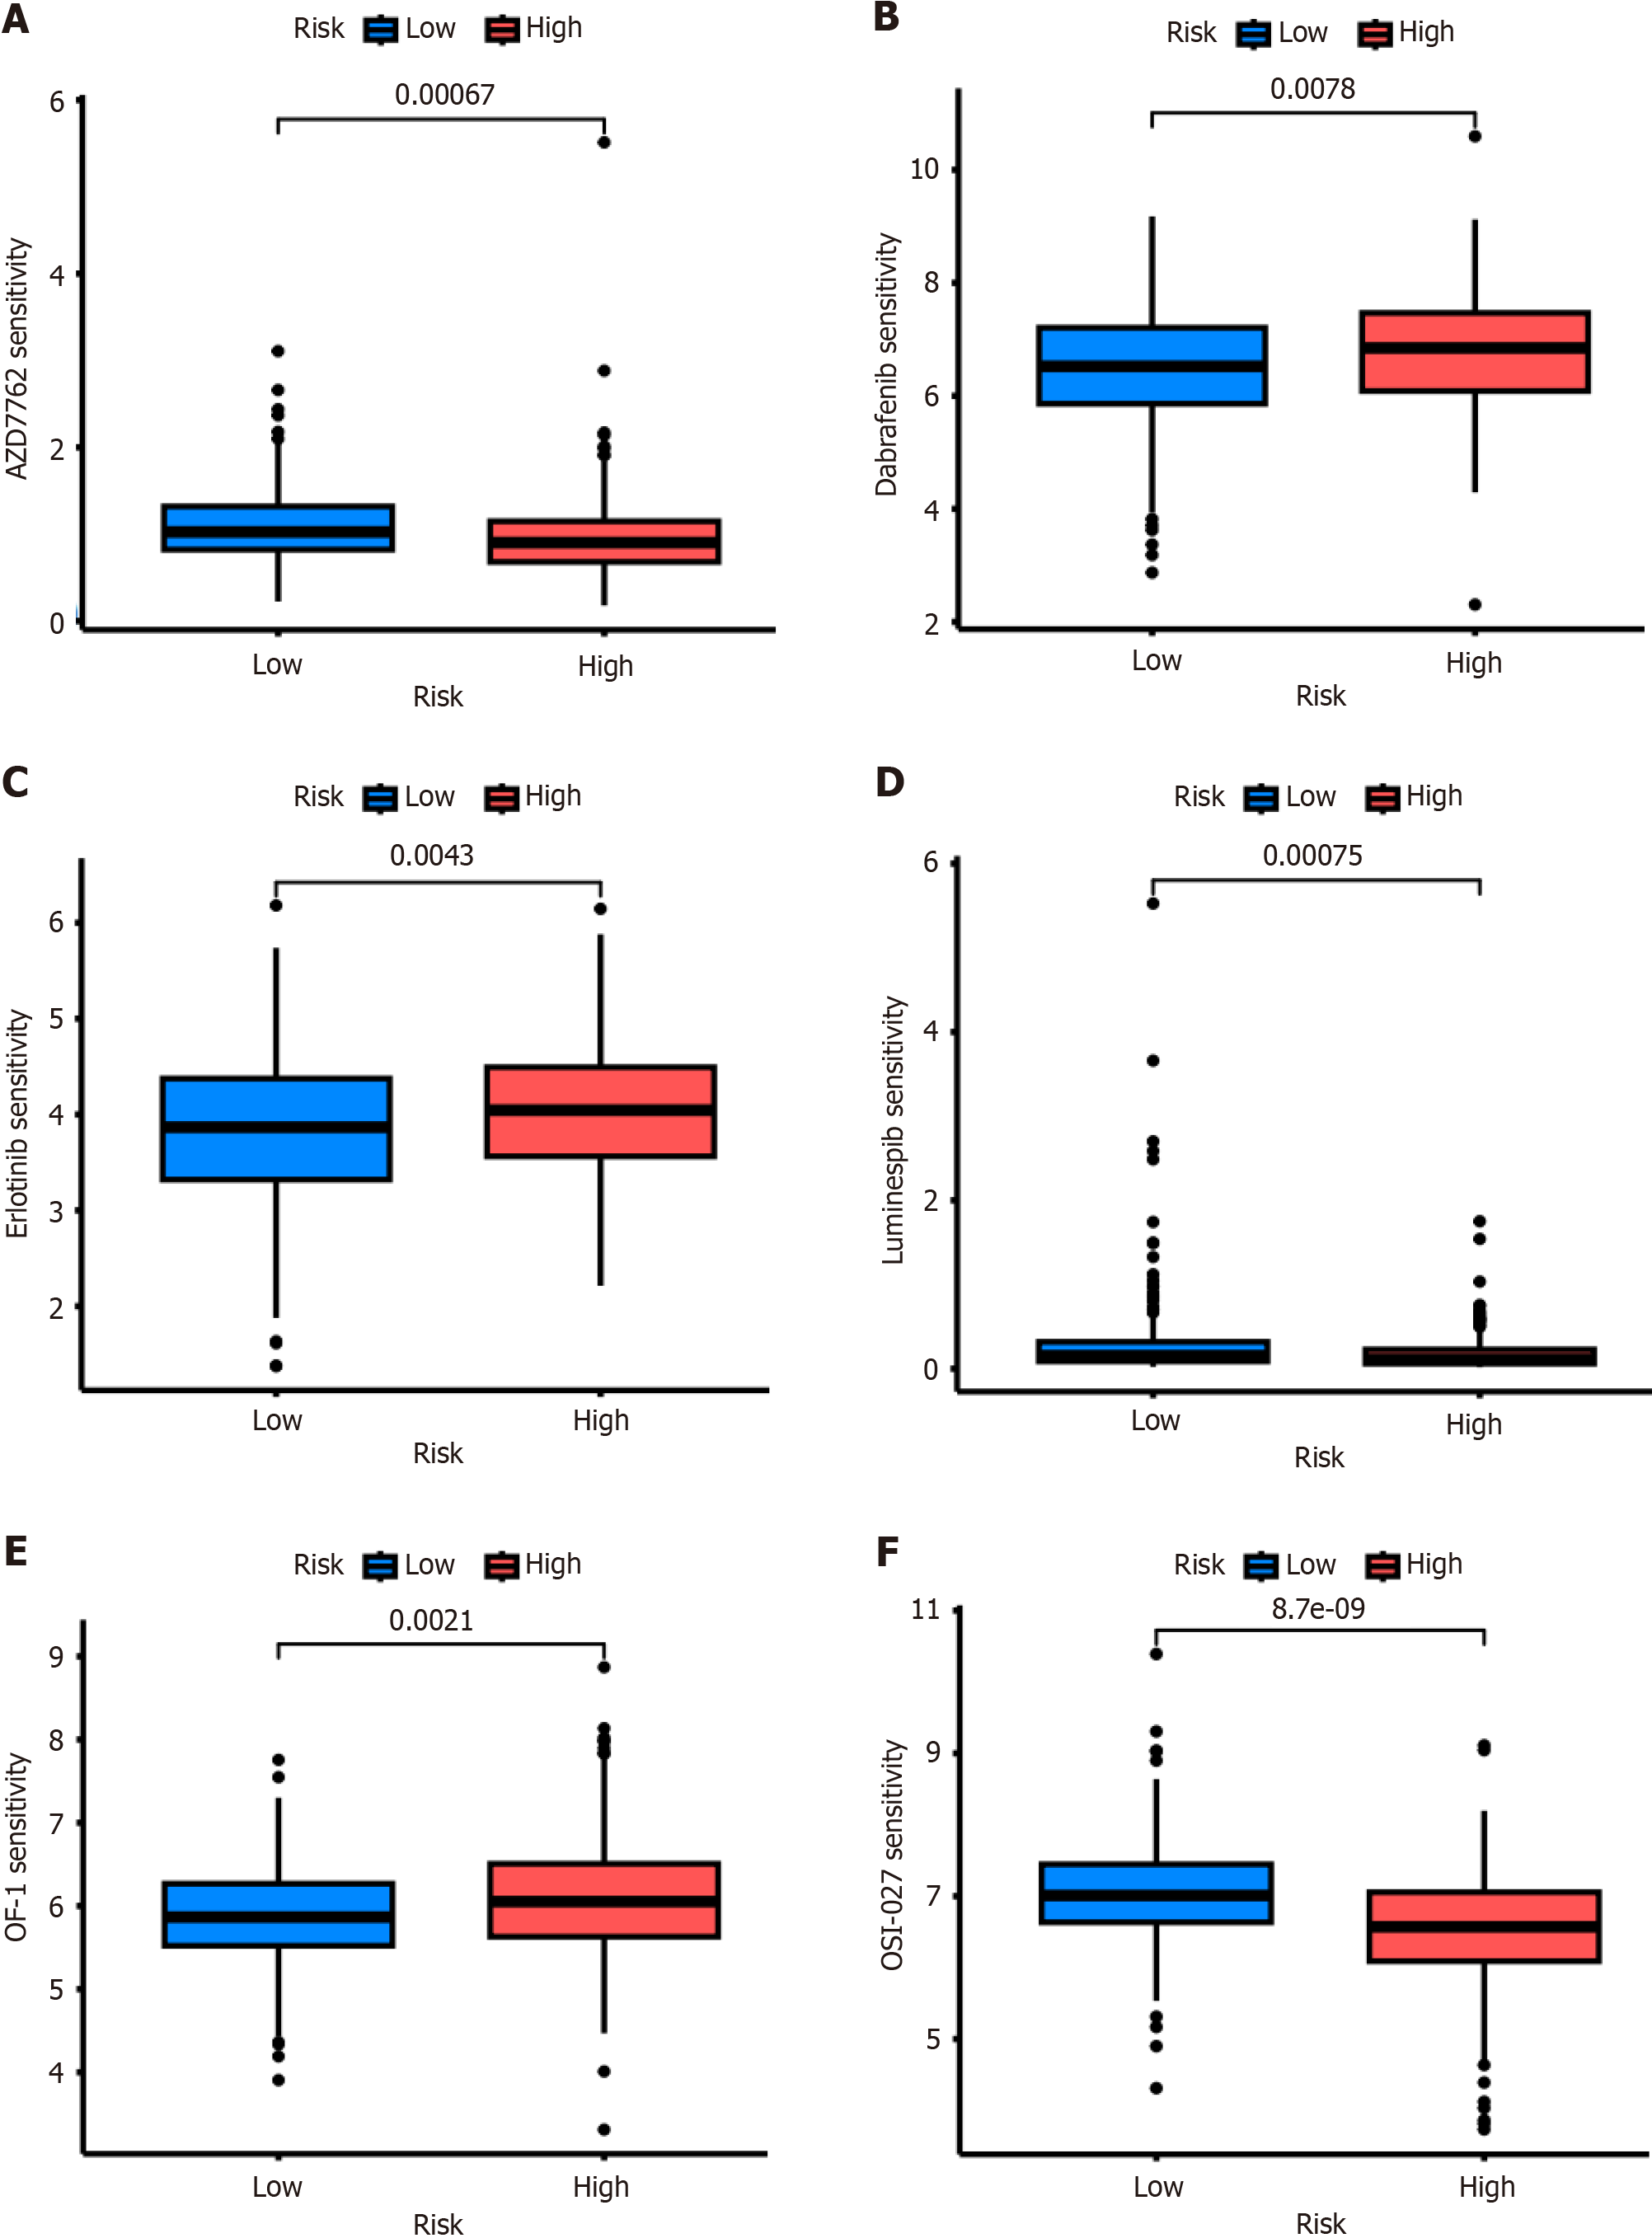
Figure 6 Drug sensitivity analysis.
Drug sensitivity analysis showed that patients with a high-risk signature were resistant or sensitive to chemotherapy and targeted therapy with different treatments. A: AZD7762; B: Dabrafenib; C: Erlotinib; D: Luminespib; E: OF-1; F: OSI-027.
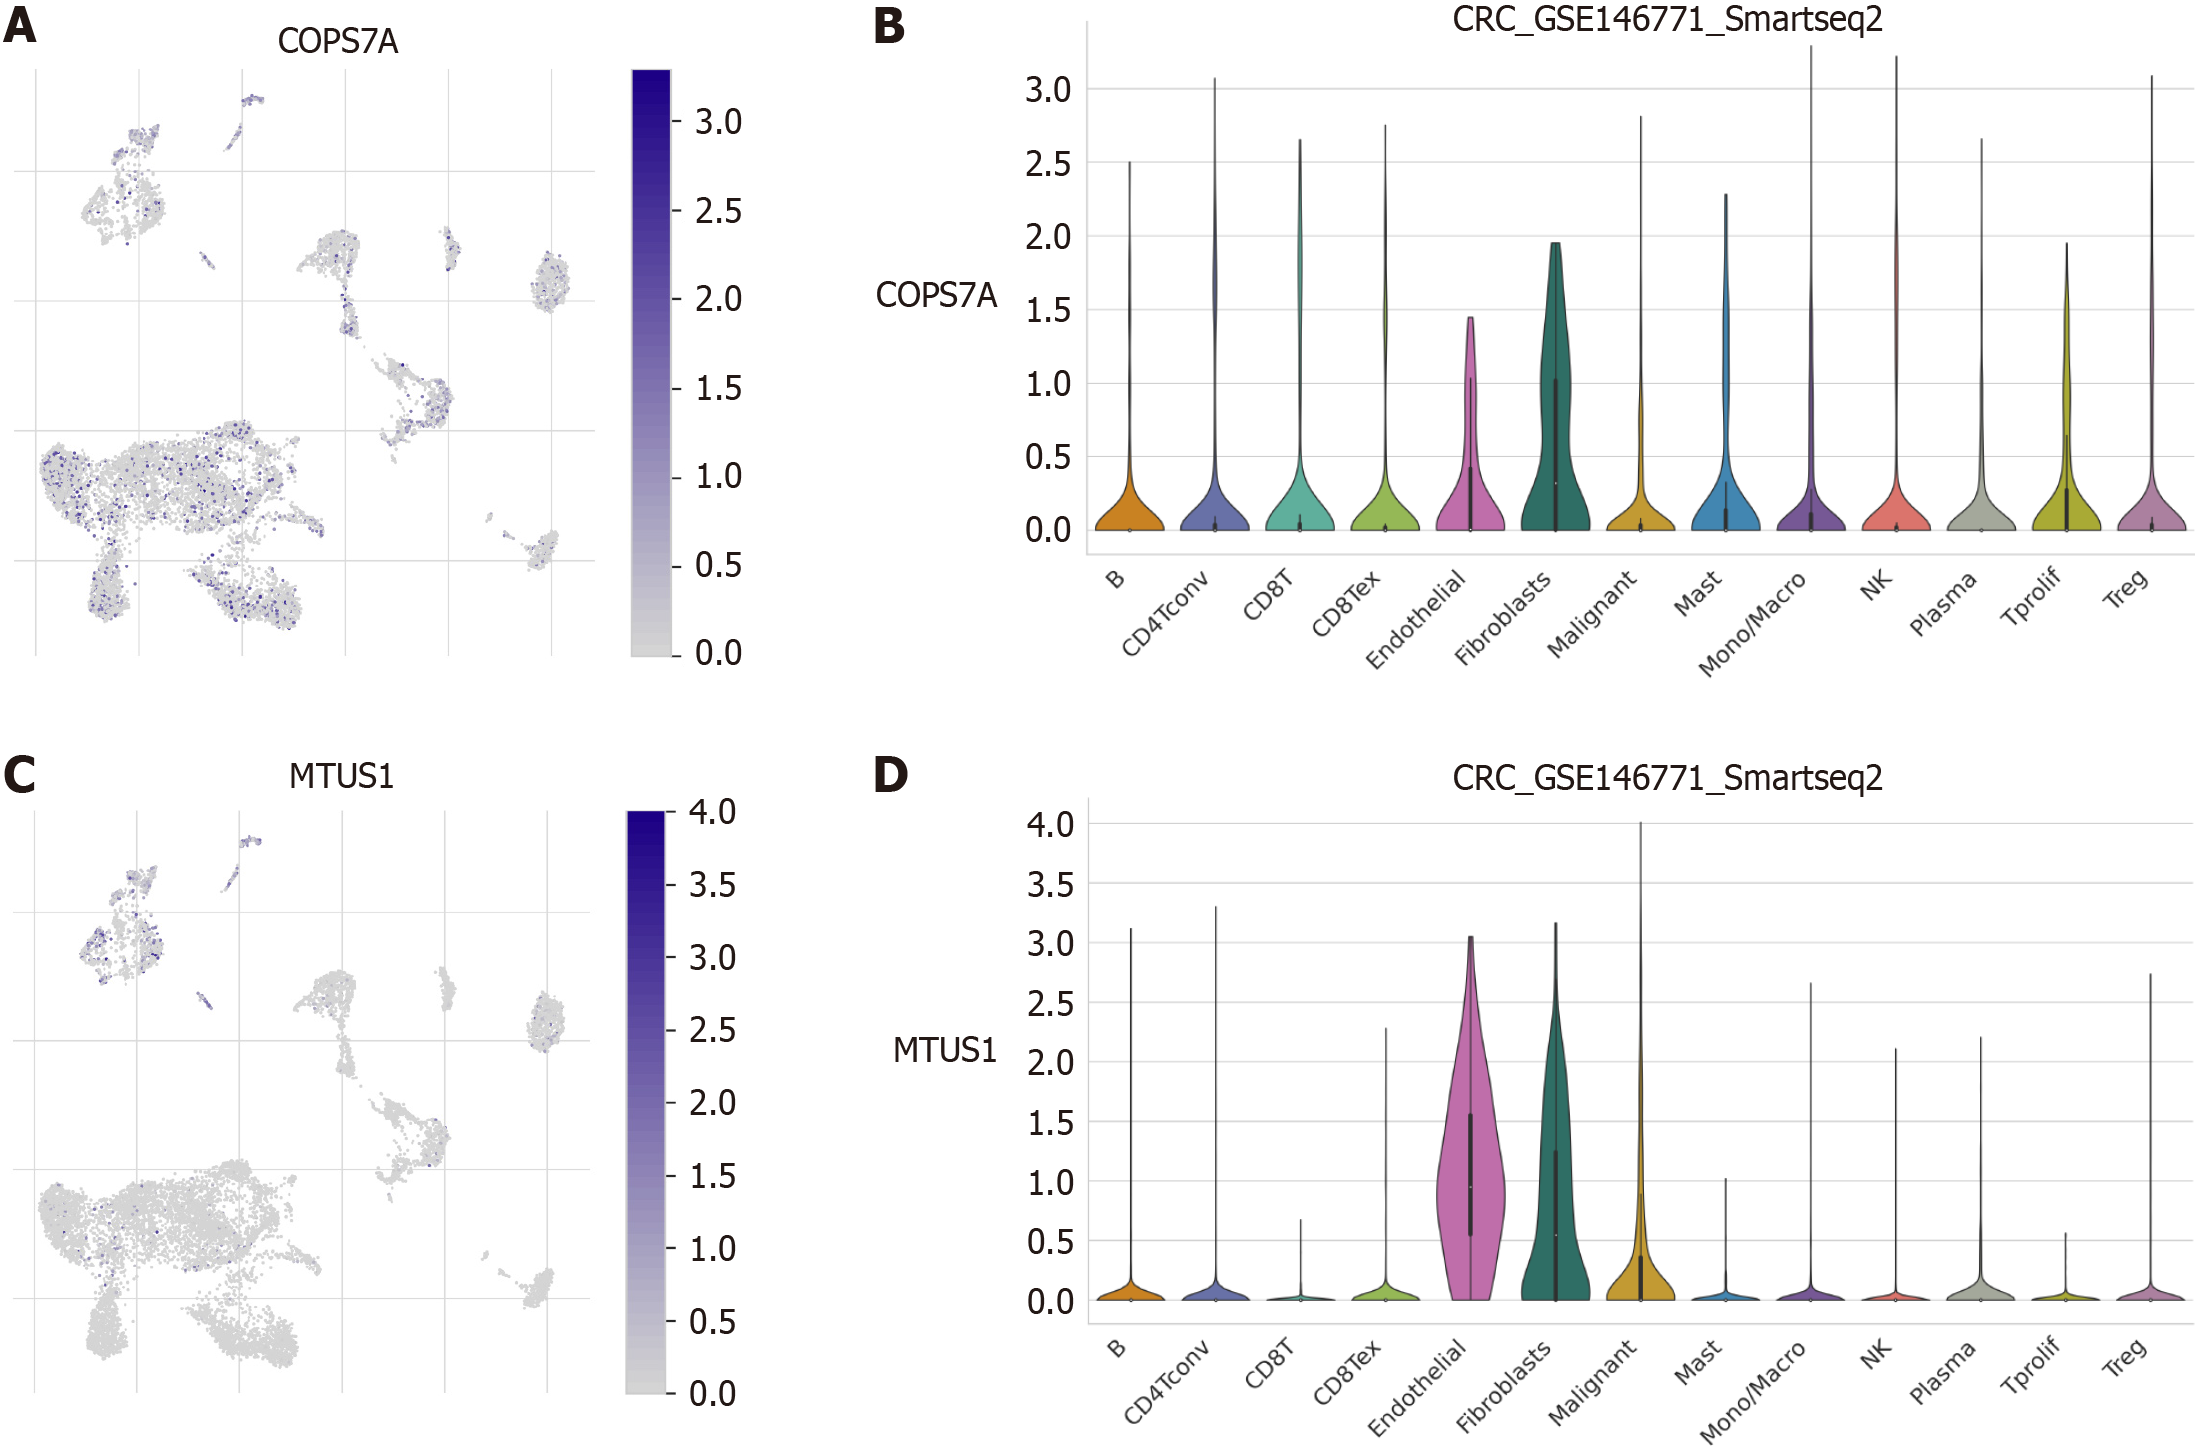
Figure 7 Single-cell transcriptome analysis.
A: COPS7A was expressed in every immune cell within GSE146771; B: COPS7A expression was relatively high in endothelial cells and fibroblasts; C: MTUS1 was expressed in a few clusters located in myeloid cells; D: MTUS1 expression was relatively high in endothelial cells, fibroblasts and malignant cells.
- Citation: Wang HY, Diao Y, Tan PZ, Liang H. Four centrosome-related genes to predict the prognosis and drug sensitivity of patients with colon cancer. World J Gastrointest Oncol 2024; 16(5): 1908-1924
- URL: https://www.wjgnet.com/1948-5204/full/v16/i5/1908.htm
- DOI: https://dx.doi.org/10.4251/wjgo.v16.i5.1908


