Copyright
©The Author(s) 2024.
World J Gastrointest Oncol. May 15, 2024; 16(5): 1878-1889
Published online May 15, 2024. doi: 10.4251/wjgo.v16.i5.1878
Published online May 15, 2024. doi: 10.4251/wjgo.v16.i5.1878
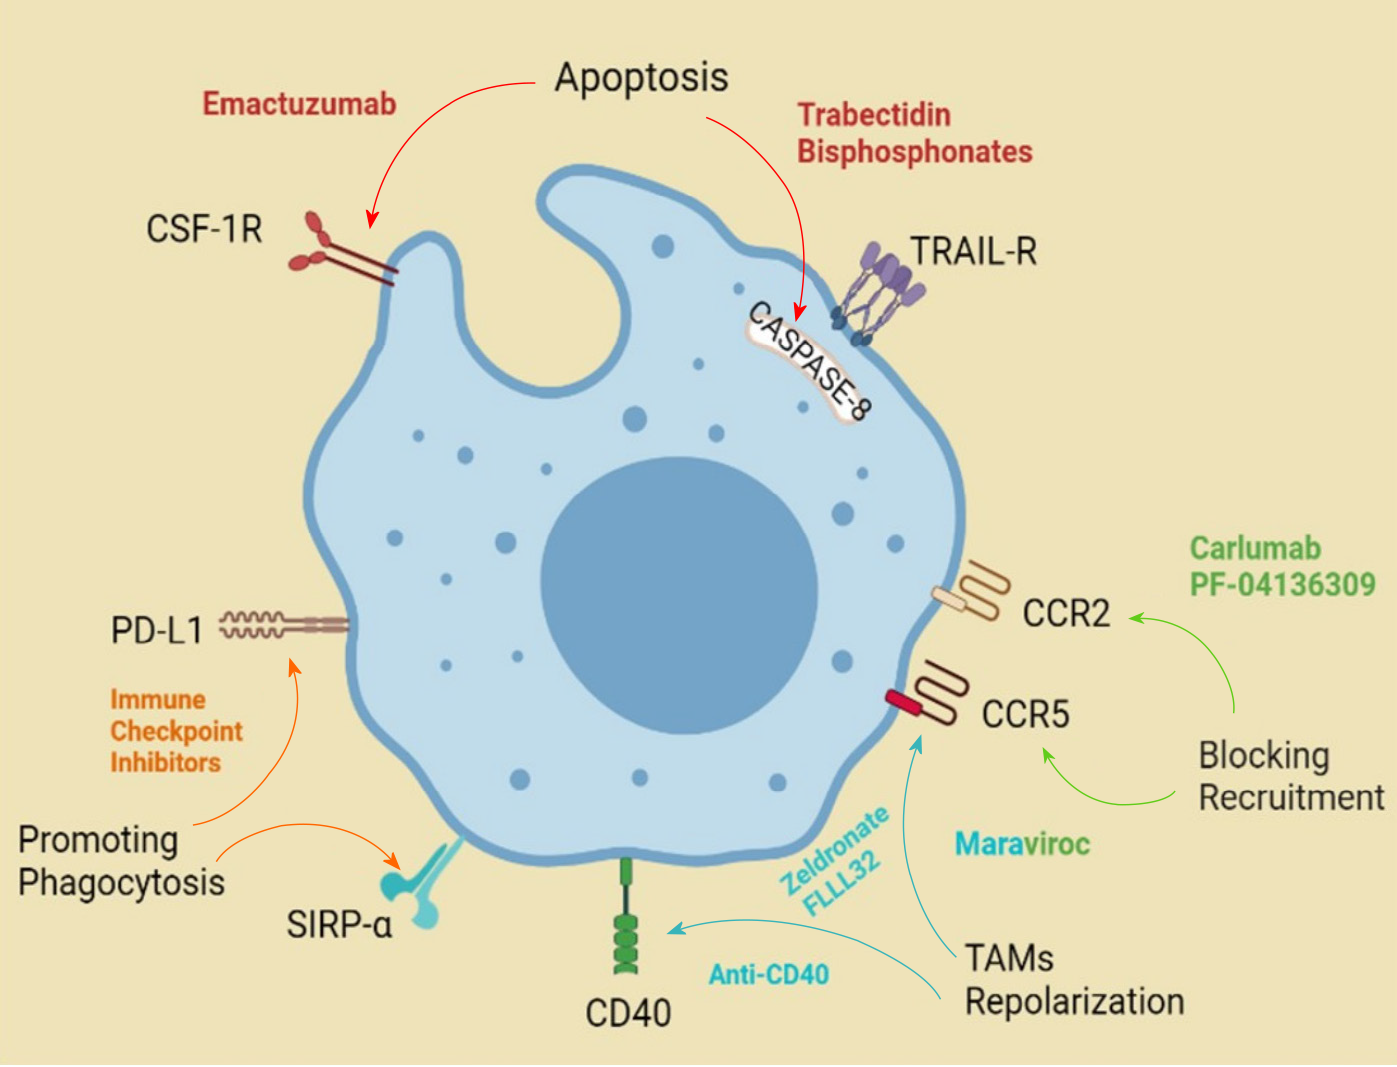
Figure 1 Complex array of cellular receptors of tumor-associated macrophages engaged in tumor-associated macrophage modulation.
Created with BioRender.com.
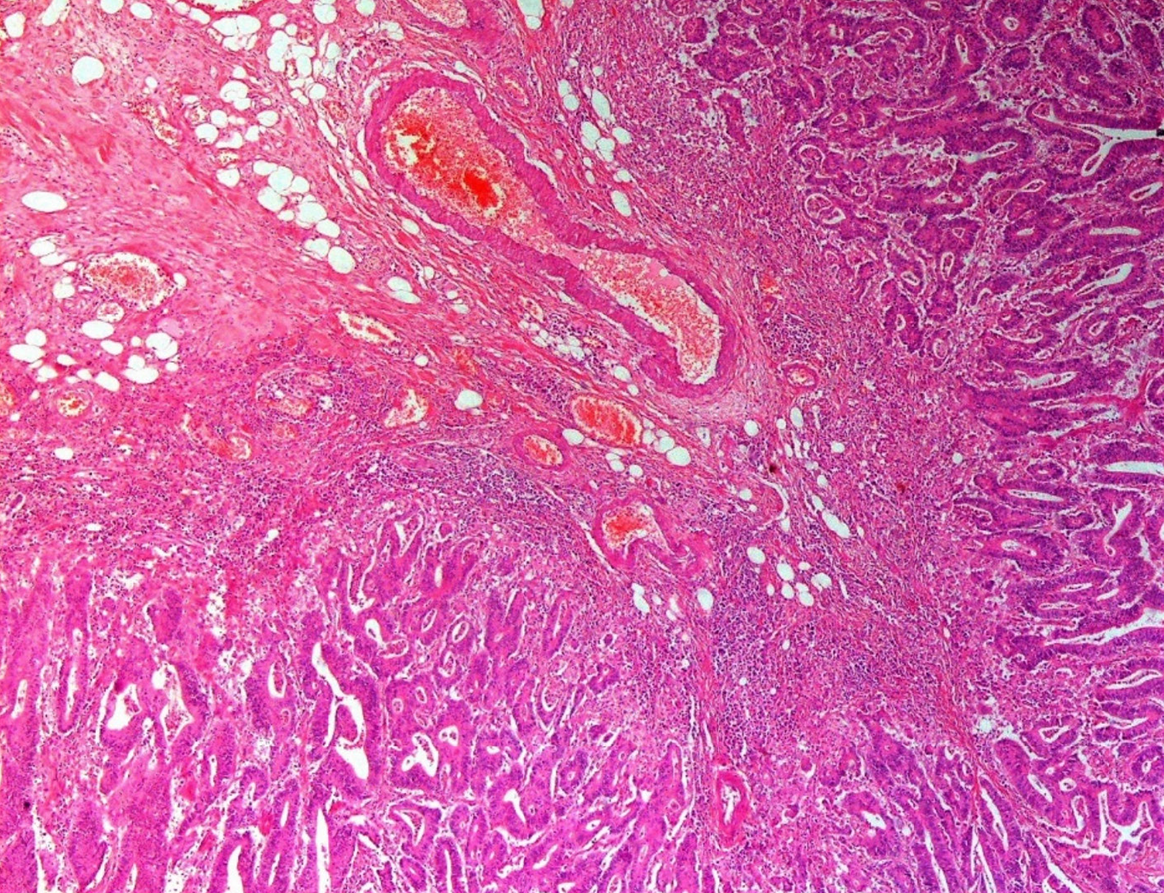
Figure 2 Colorectal carcinoma.
The invasive front (hematoxylin and eosin, × 40 magnification).
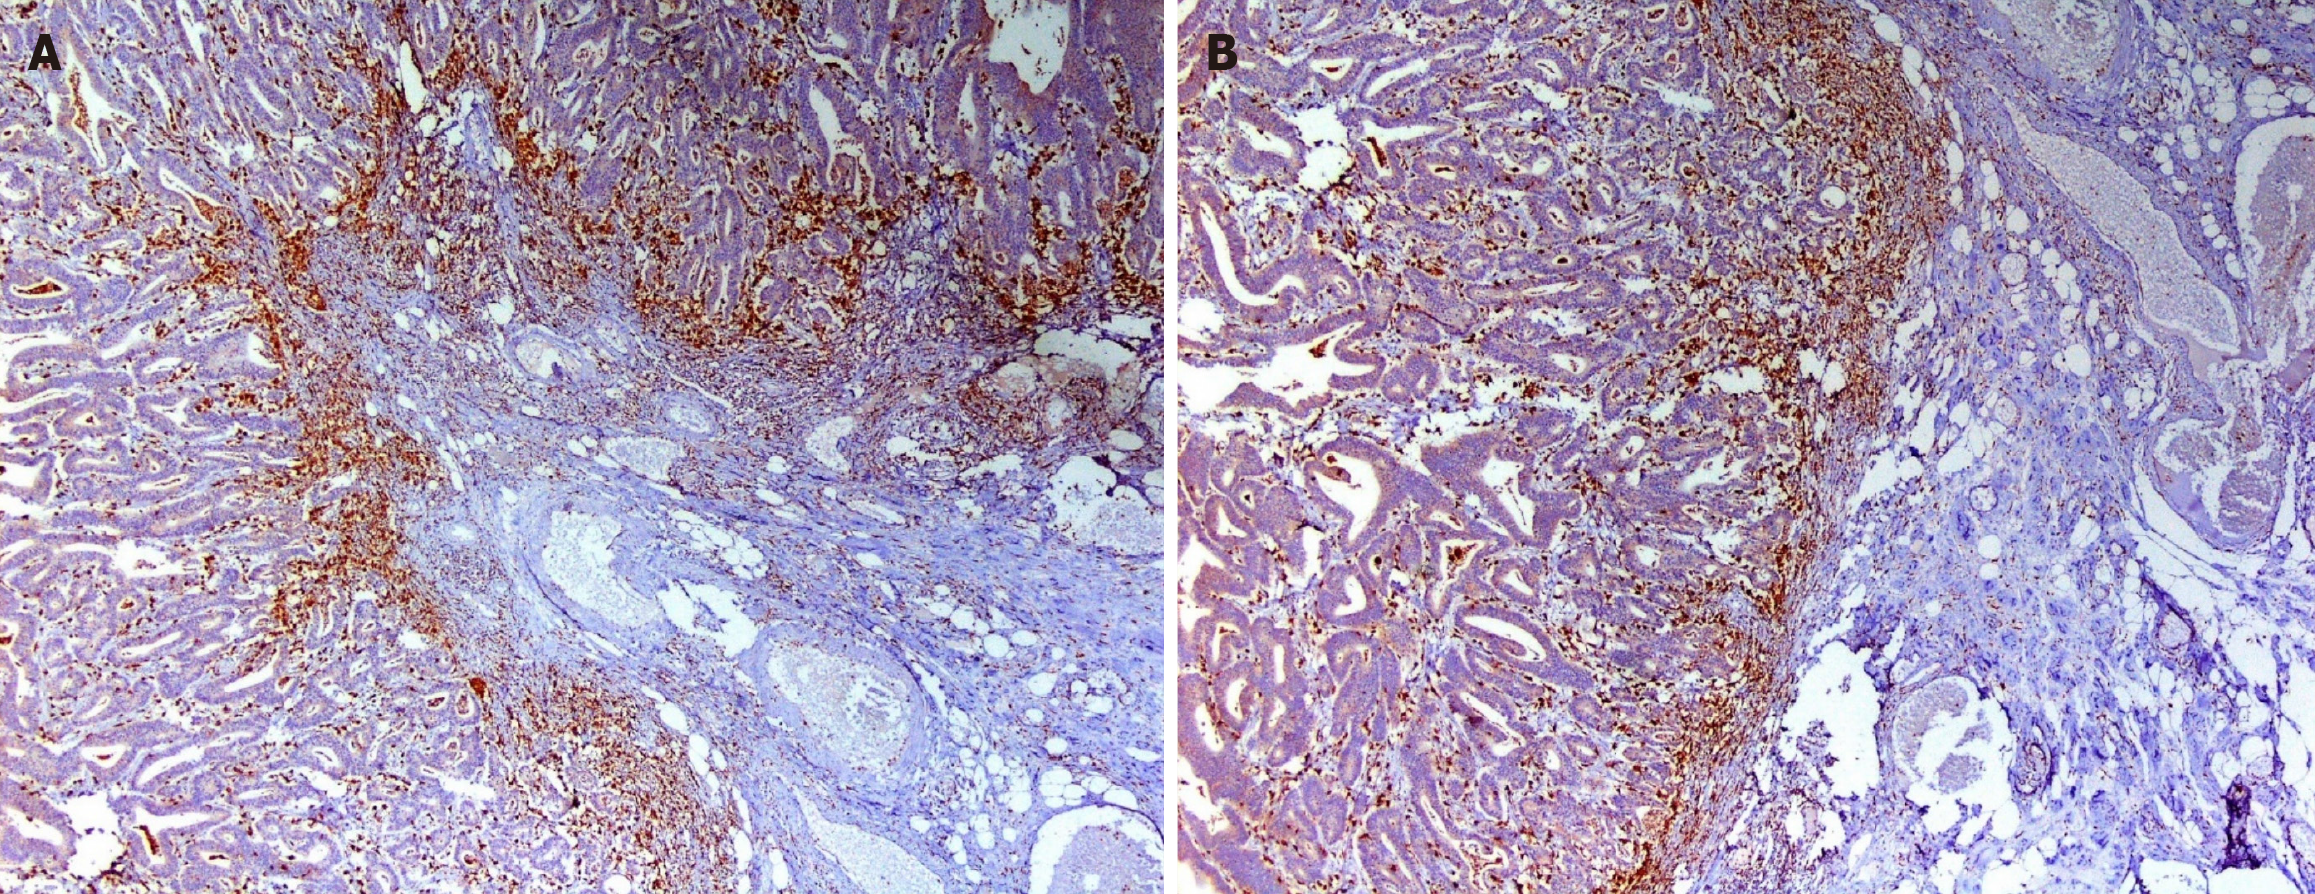
Figure 3 Macrophages at the tumor invasive front.
A: CD 163+; B: CD 68+. Immunohistochemistry; × 40 magnification.
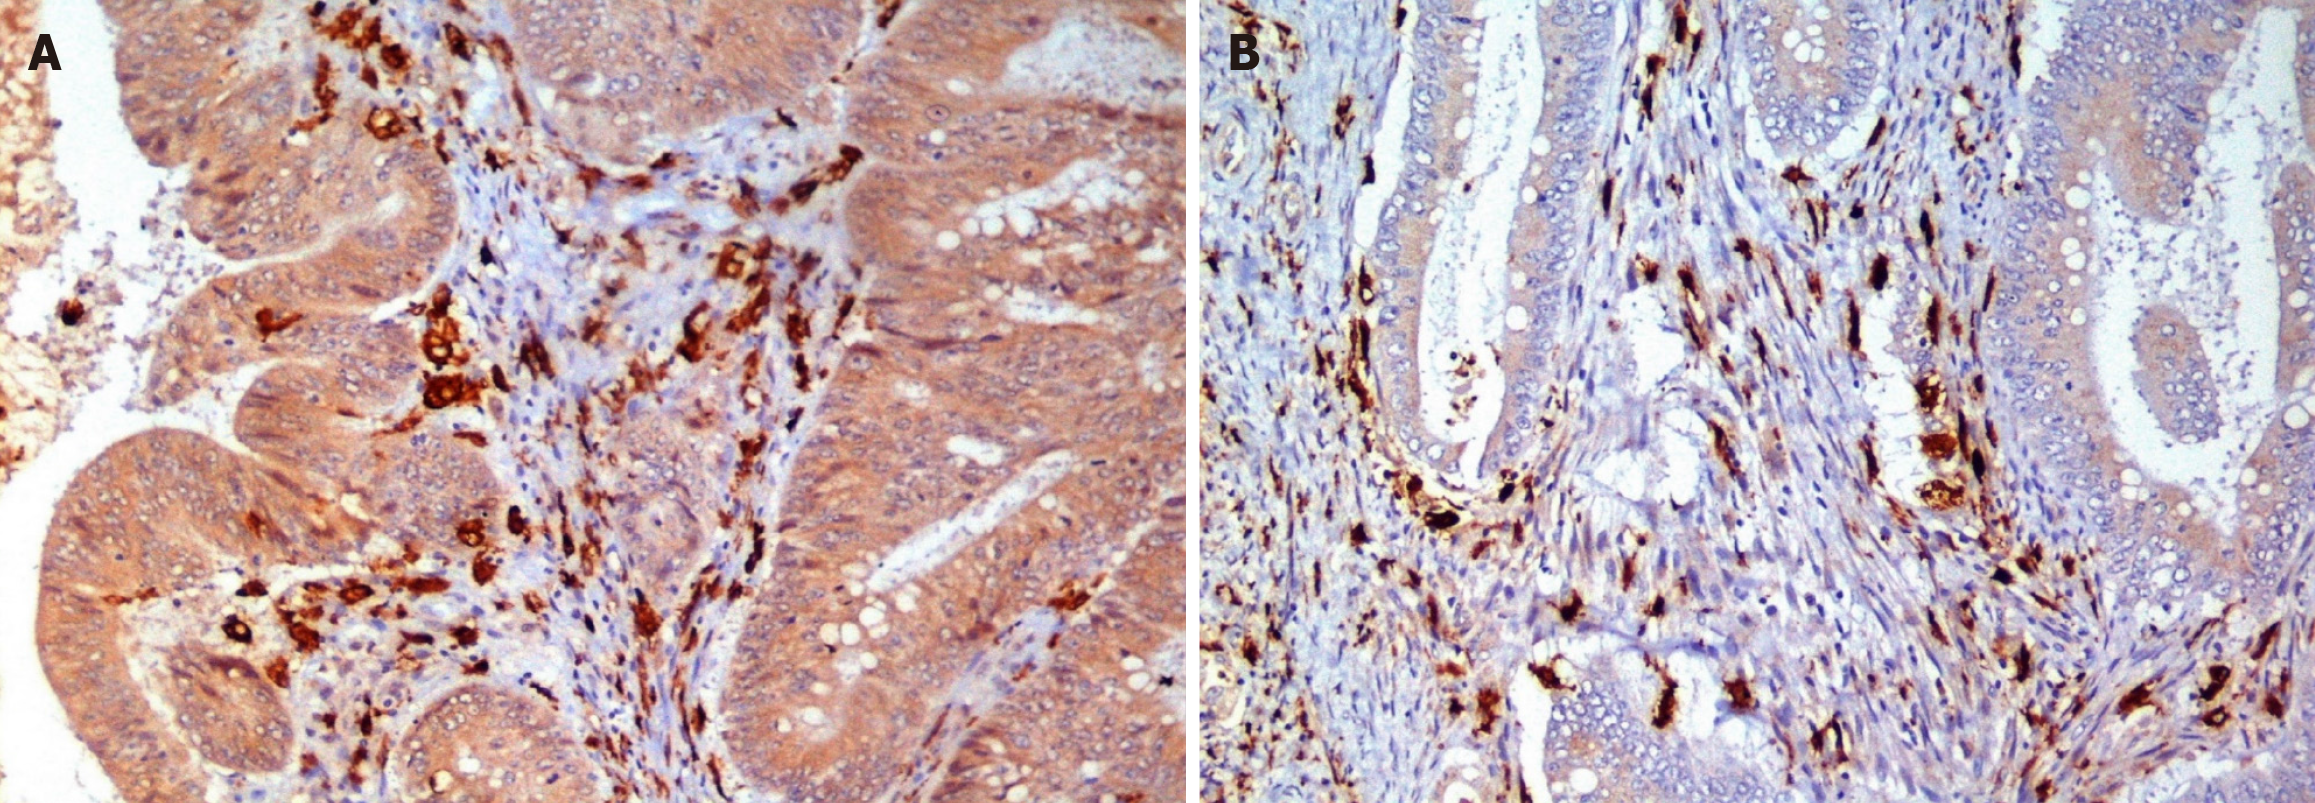
Figure 4 Tumor stroma infiltrated by macrophages, exhibiting membranous and cytoplasmic staining.
A: CD 163+; B: CD 68+. Immunohistochemistry; × 200 magnification.
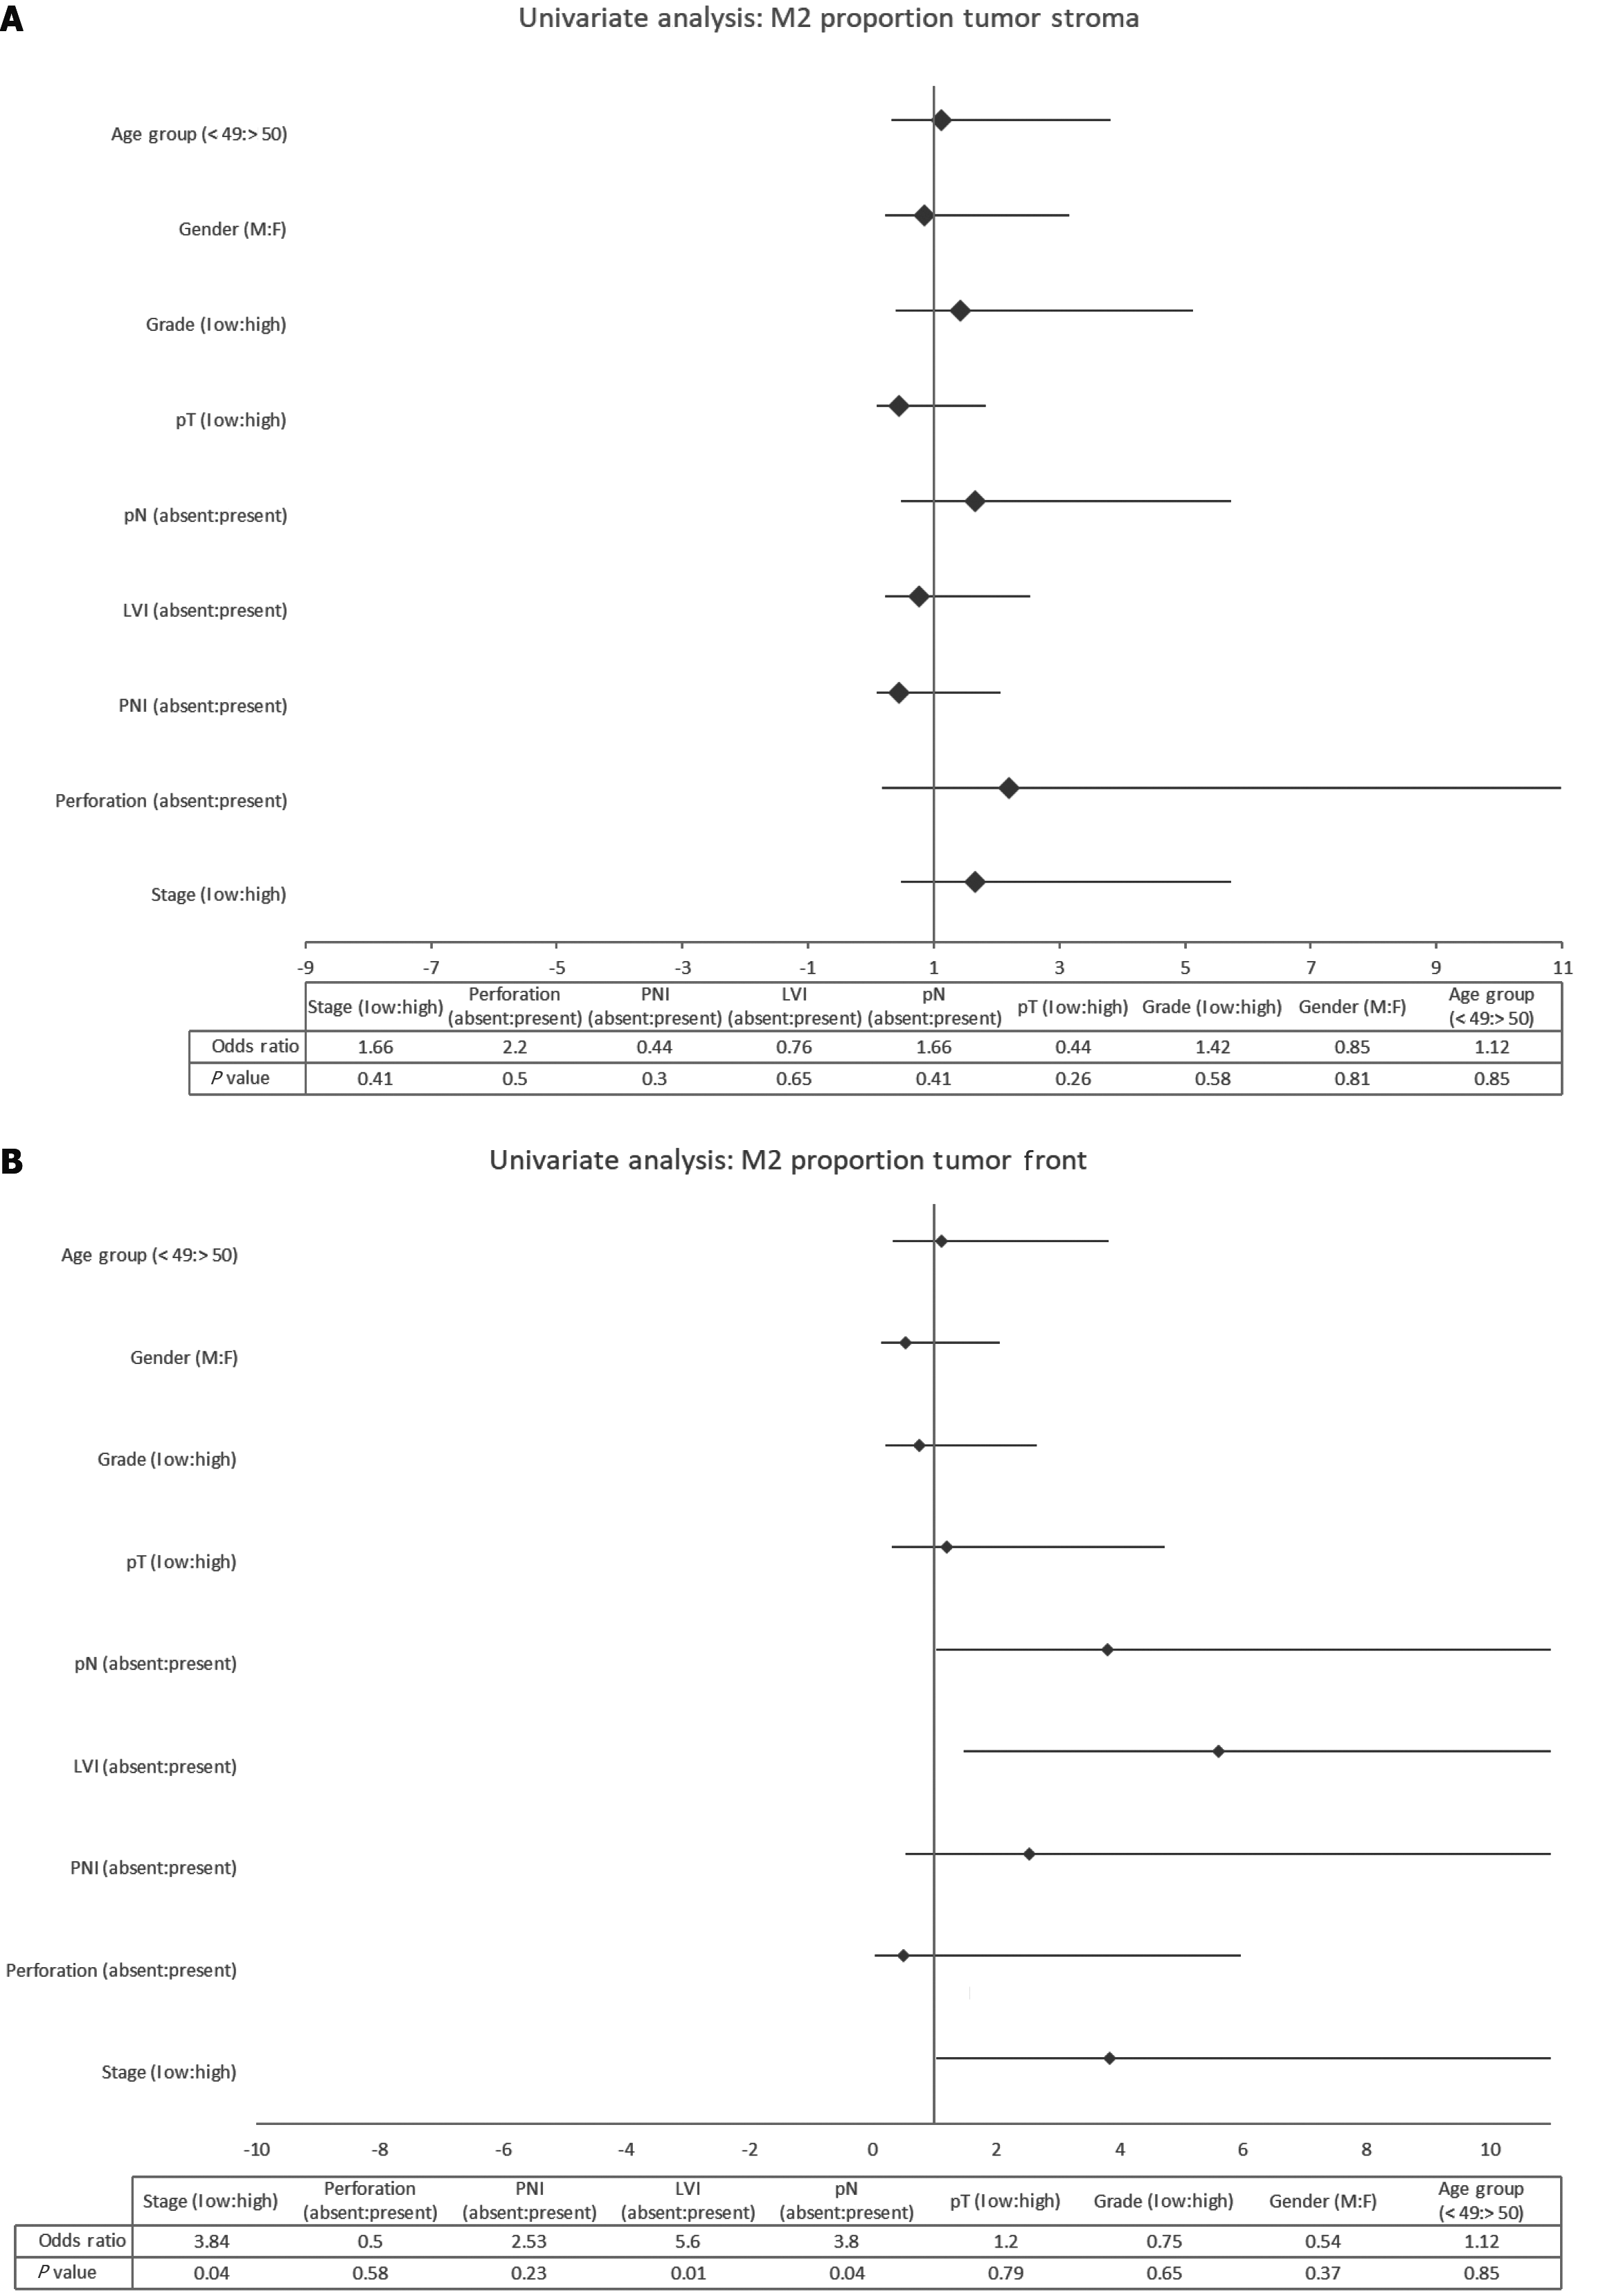
Figure 5 Univariate analysis of M2 proportion in the tumor stroma and front.
A: Tumor stroma; B: Tumor front.
- Citation: Fazal F, Khan MA, Shawana S, Rashid R, Mubarak M. Correlation of tumor-associated macrophage density and proportion of M2 subtypes with the pathological stage of colorectal cancer. World J Gastrointest Oncol 2024; 16(5): 1878-1889
- URL: https://www.wjgnet.com/1948-5204/full/v16/i5/1878.htm
- DOI: https://dx.doi.org/10.4251/wjgo.v16.i5.1878


