Copyright
©The Author(s) 2024.
World J Gastrointest Oncol. May 15, 2024; 16(5): 1849-1860
Published online May 15, 2024. doi: 10.4251/wjgo.v16.i5.1849
Published online May 15, 2024. doi: 10.4251/wjgo.v16.i5.1849
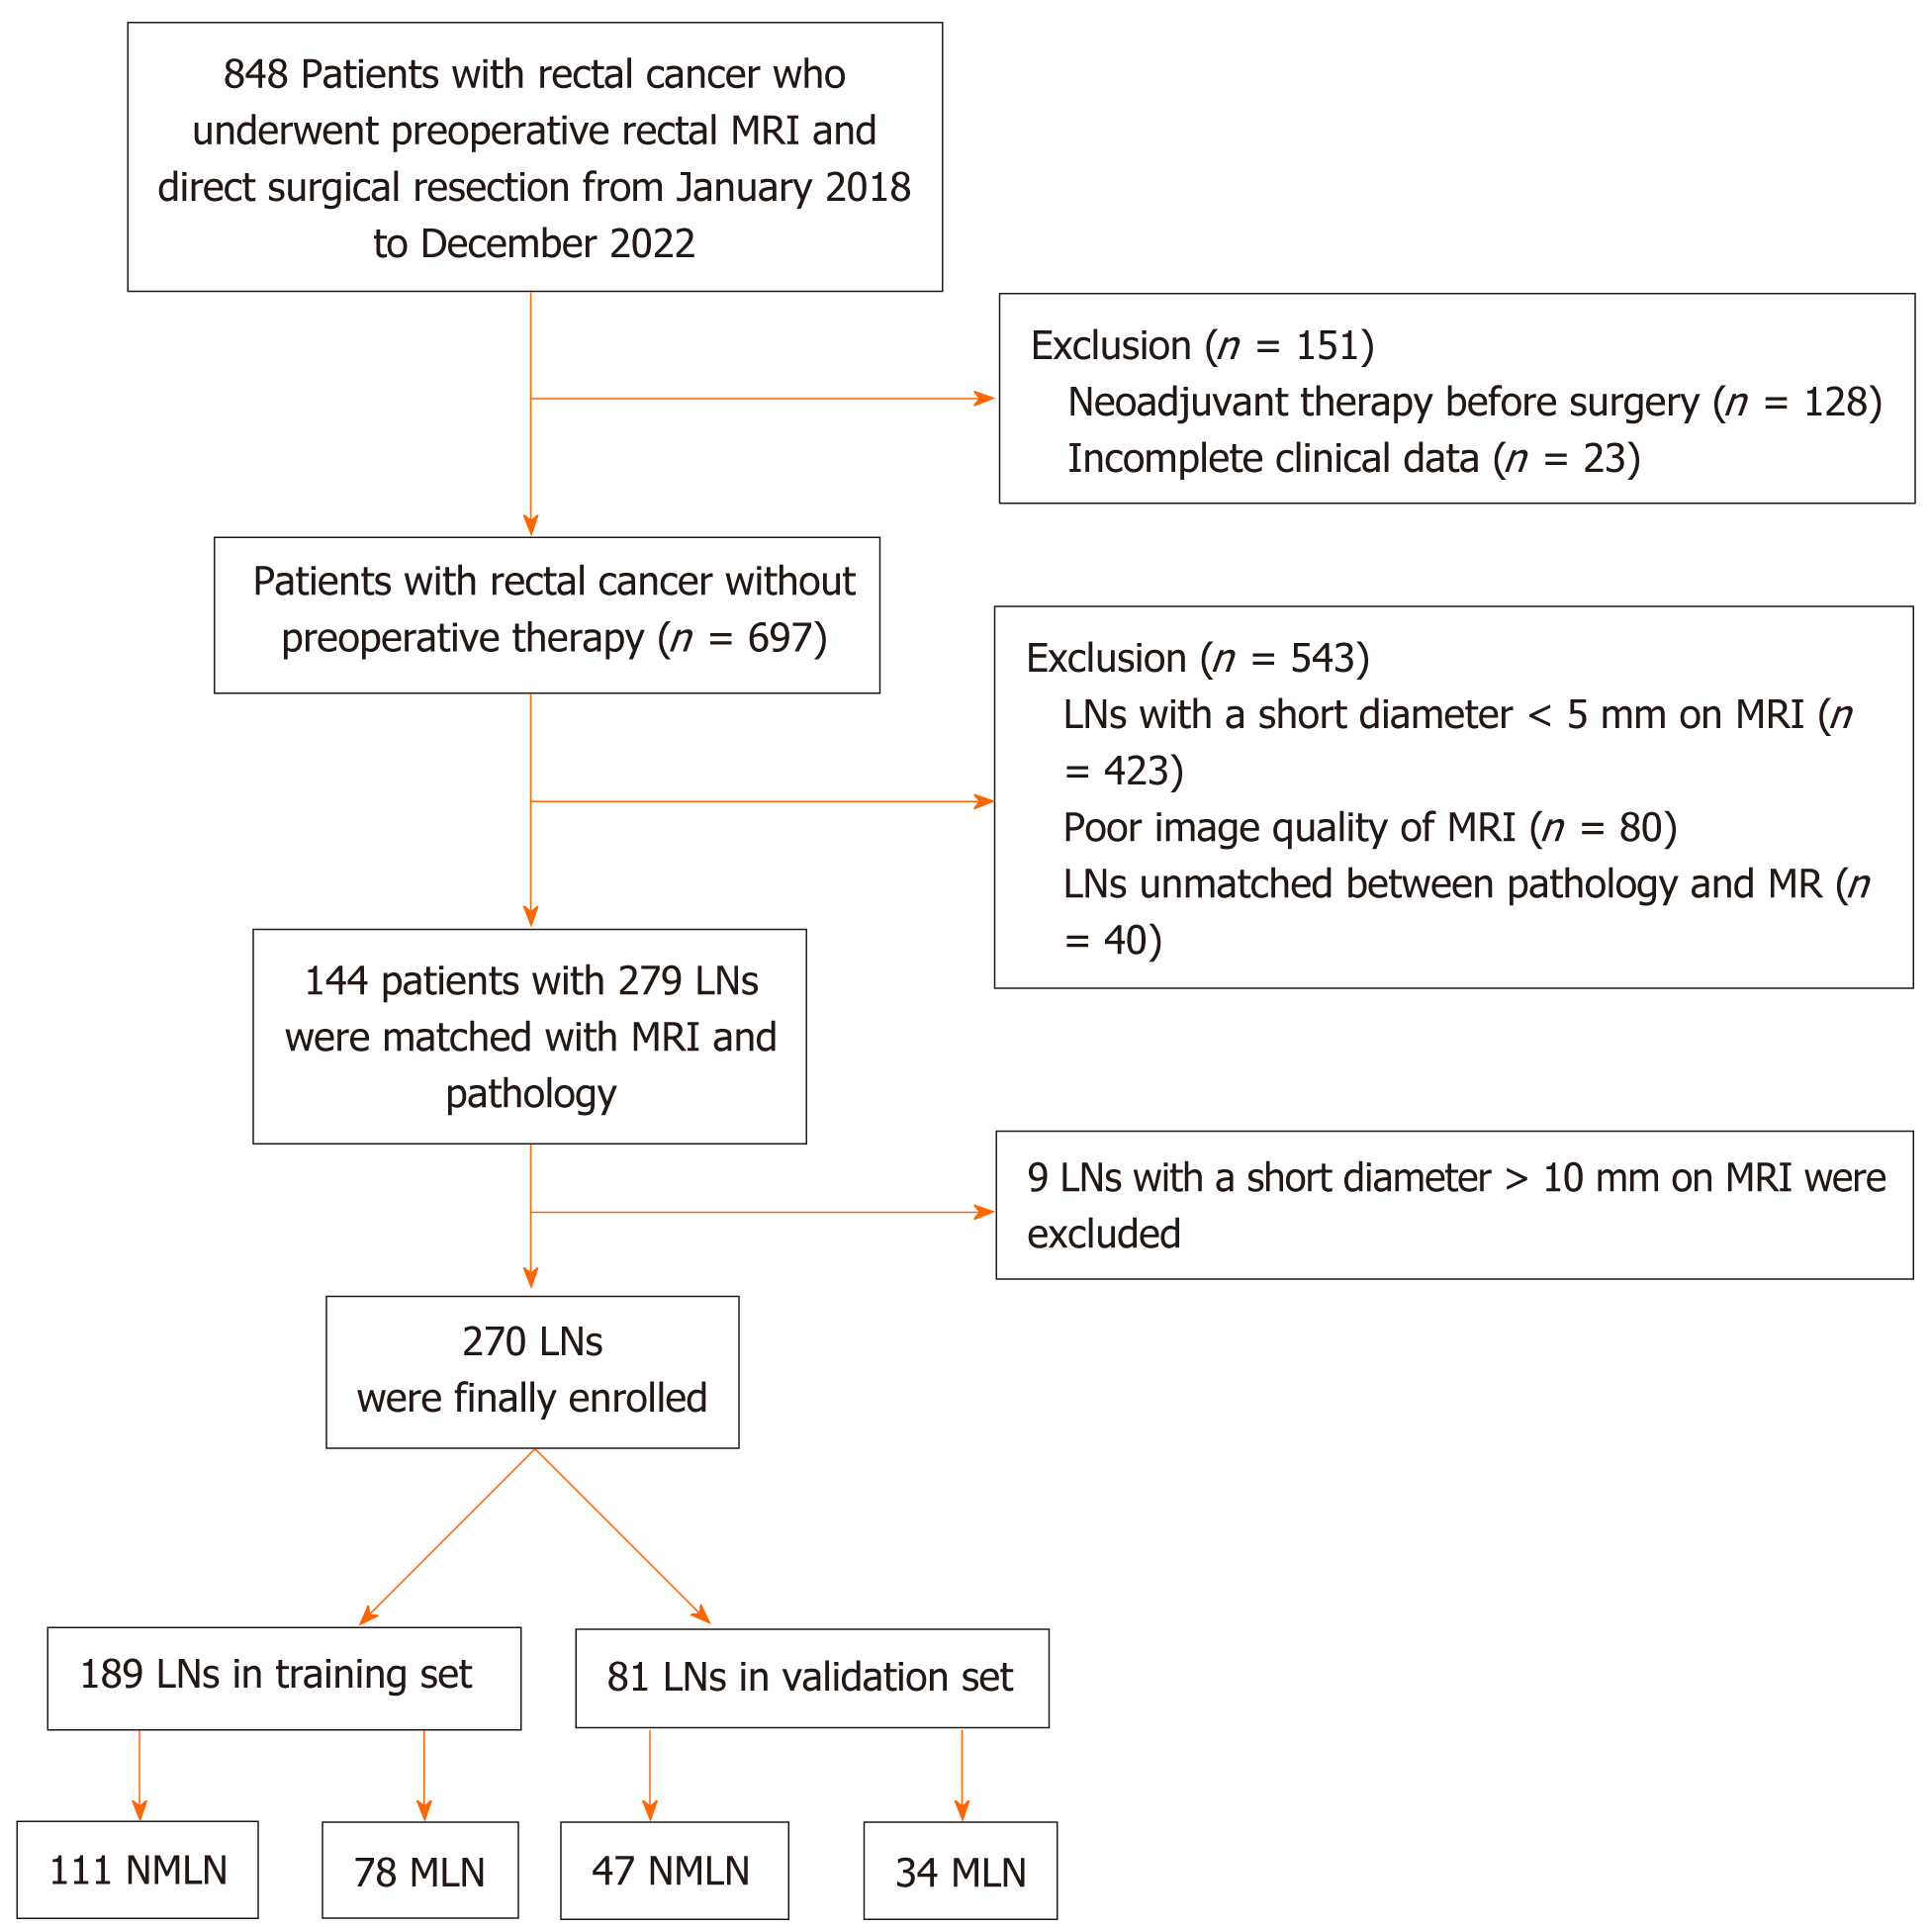
Figure 1 Flowchart for the selection of evaluable lymph nodes with a short diameter of within 5-10 mm.
LNs: Lymph nodes; NLNM: Non-lymph node metastasis; LNM: Lymph node metastasis.
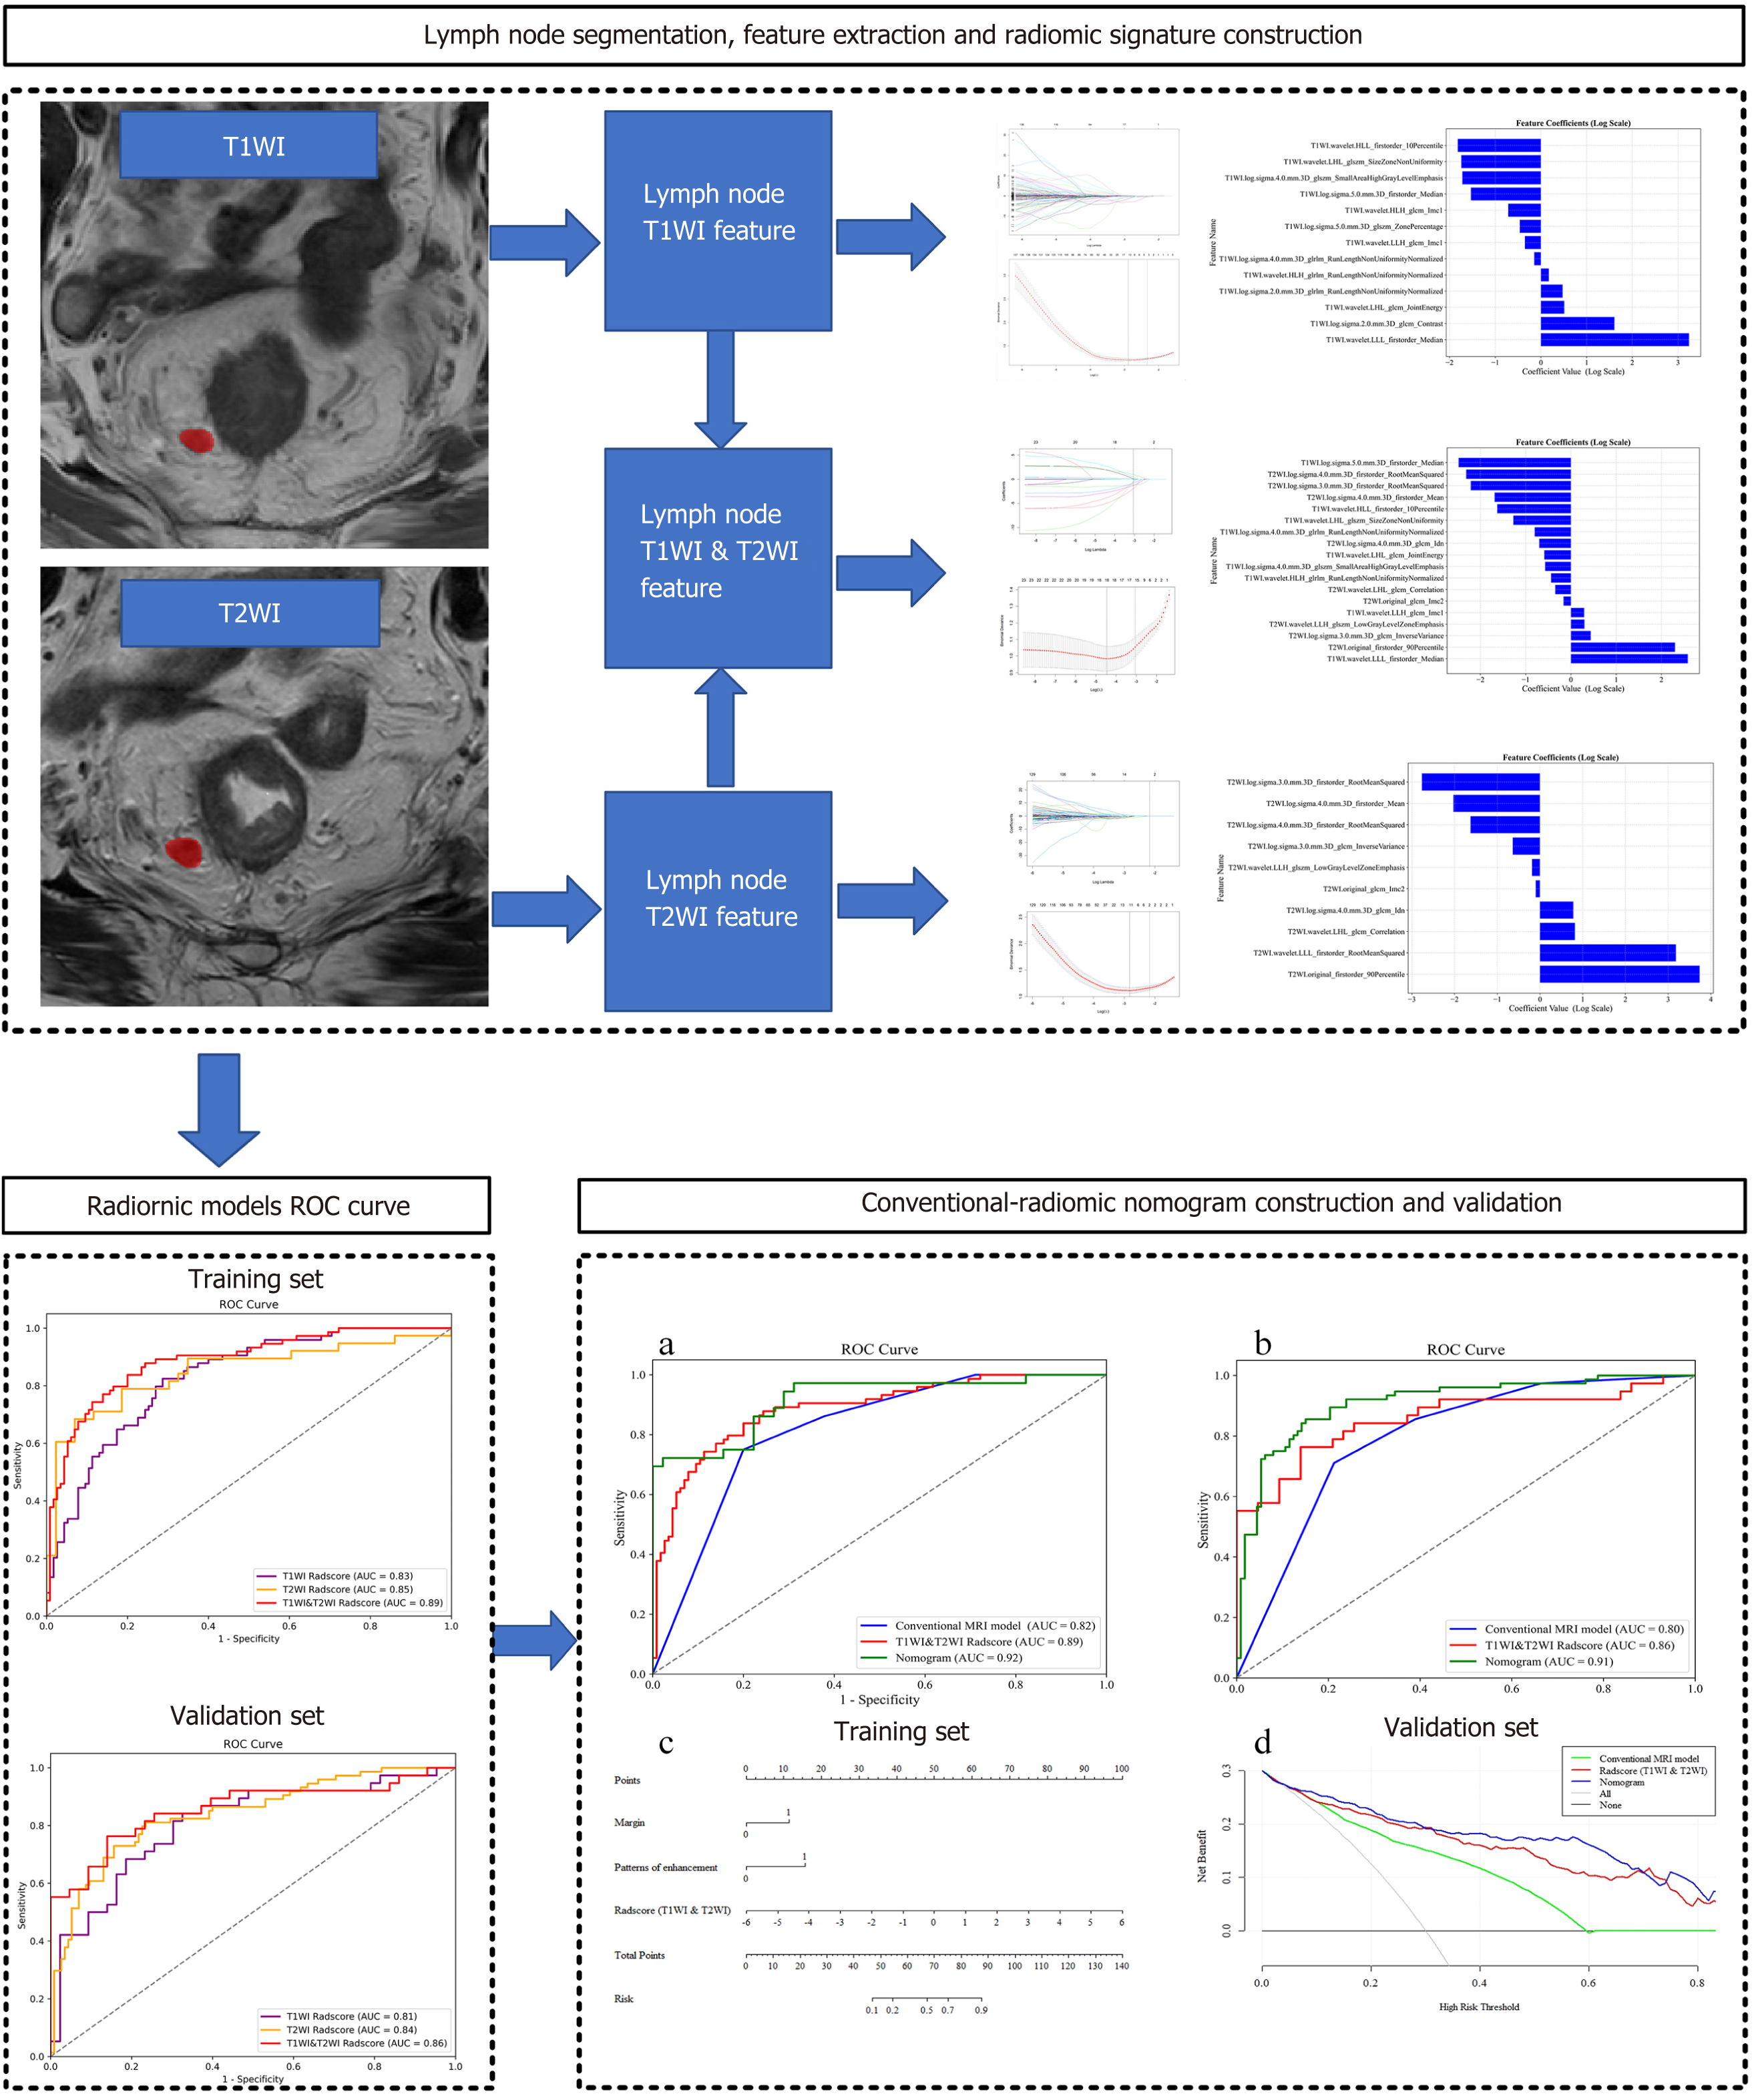
Figure 2 Workflow of radiomics process in study.
ROC: Receiver operating characteristic; T1WI: T1-weighted imaging; T2WI: T2-weighted imaging.
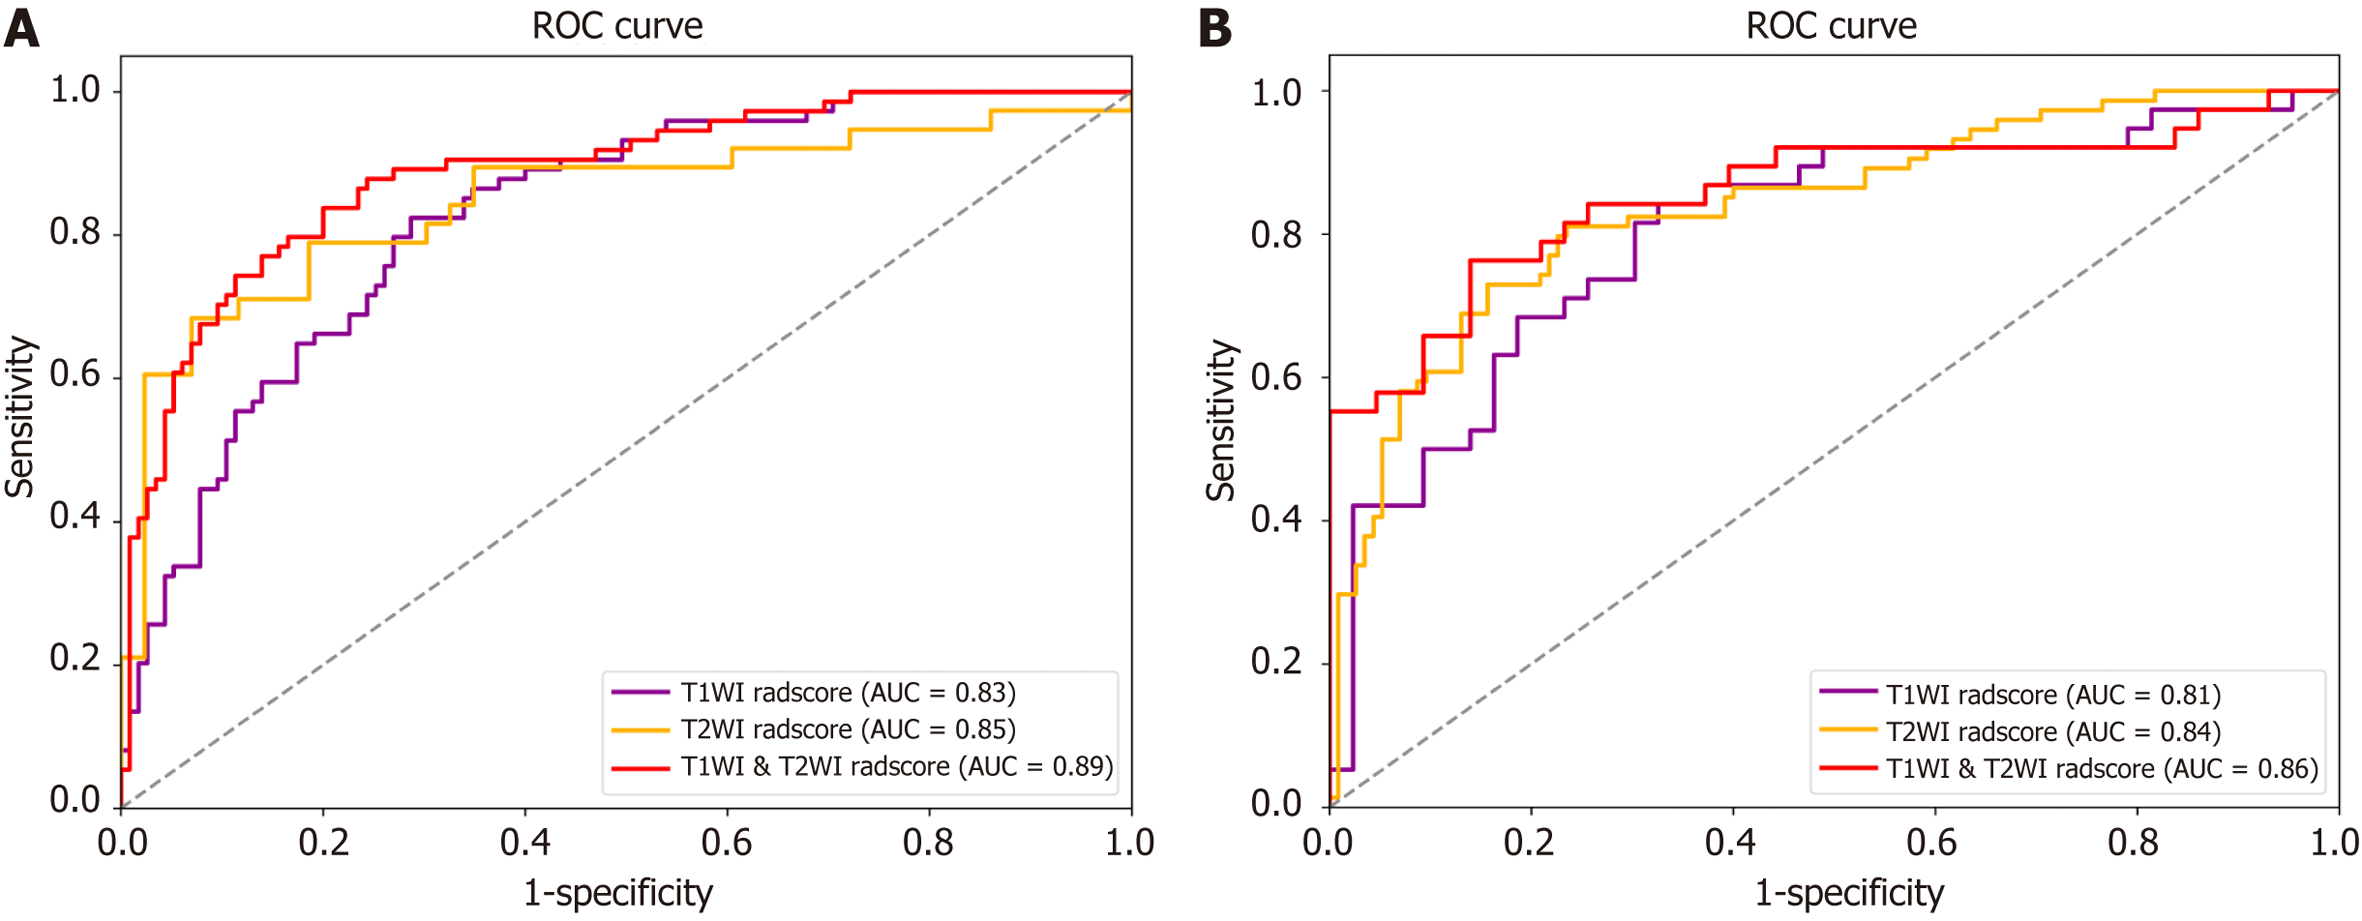
Figure 3 Receiver operating characteristic curves.
A and B: Receiver operating characteristic curves of the T1-weighted imaging (T1WI)-Radscore, T2-weighted imaging (T2WI)-Radscore, T1WI & T2WI-Radscore in the training (A) and validation (B) set, respectively. AUC: Area under the curve; ROC: Receiver operating characteristic.
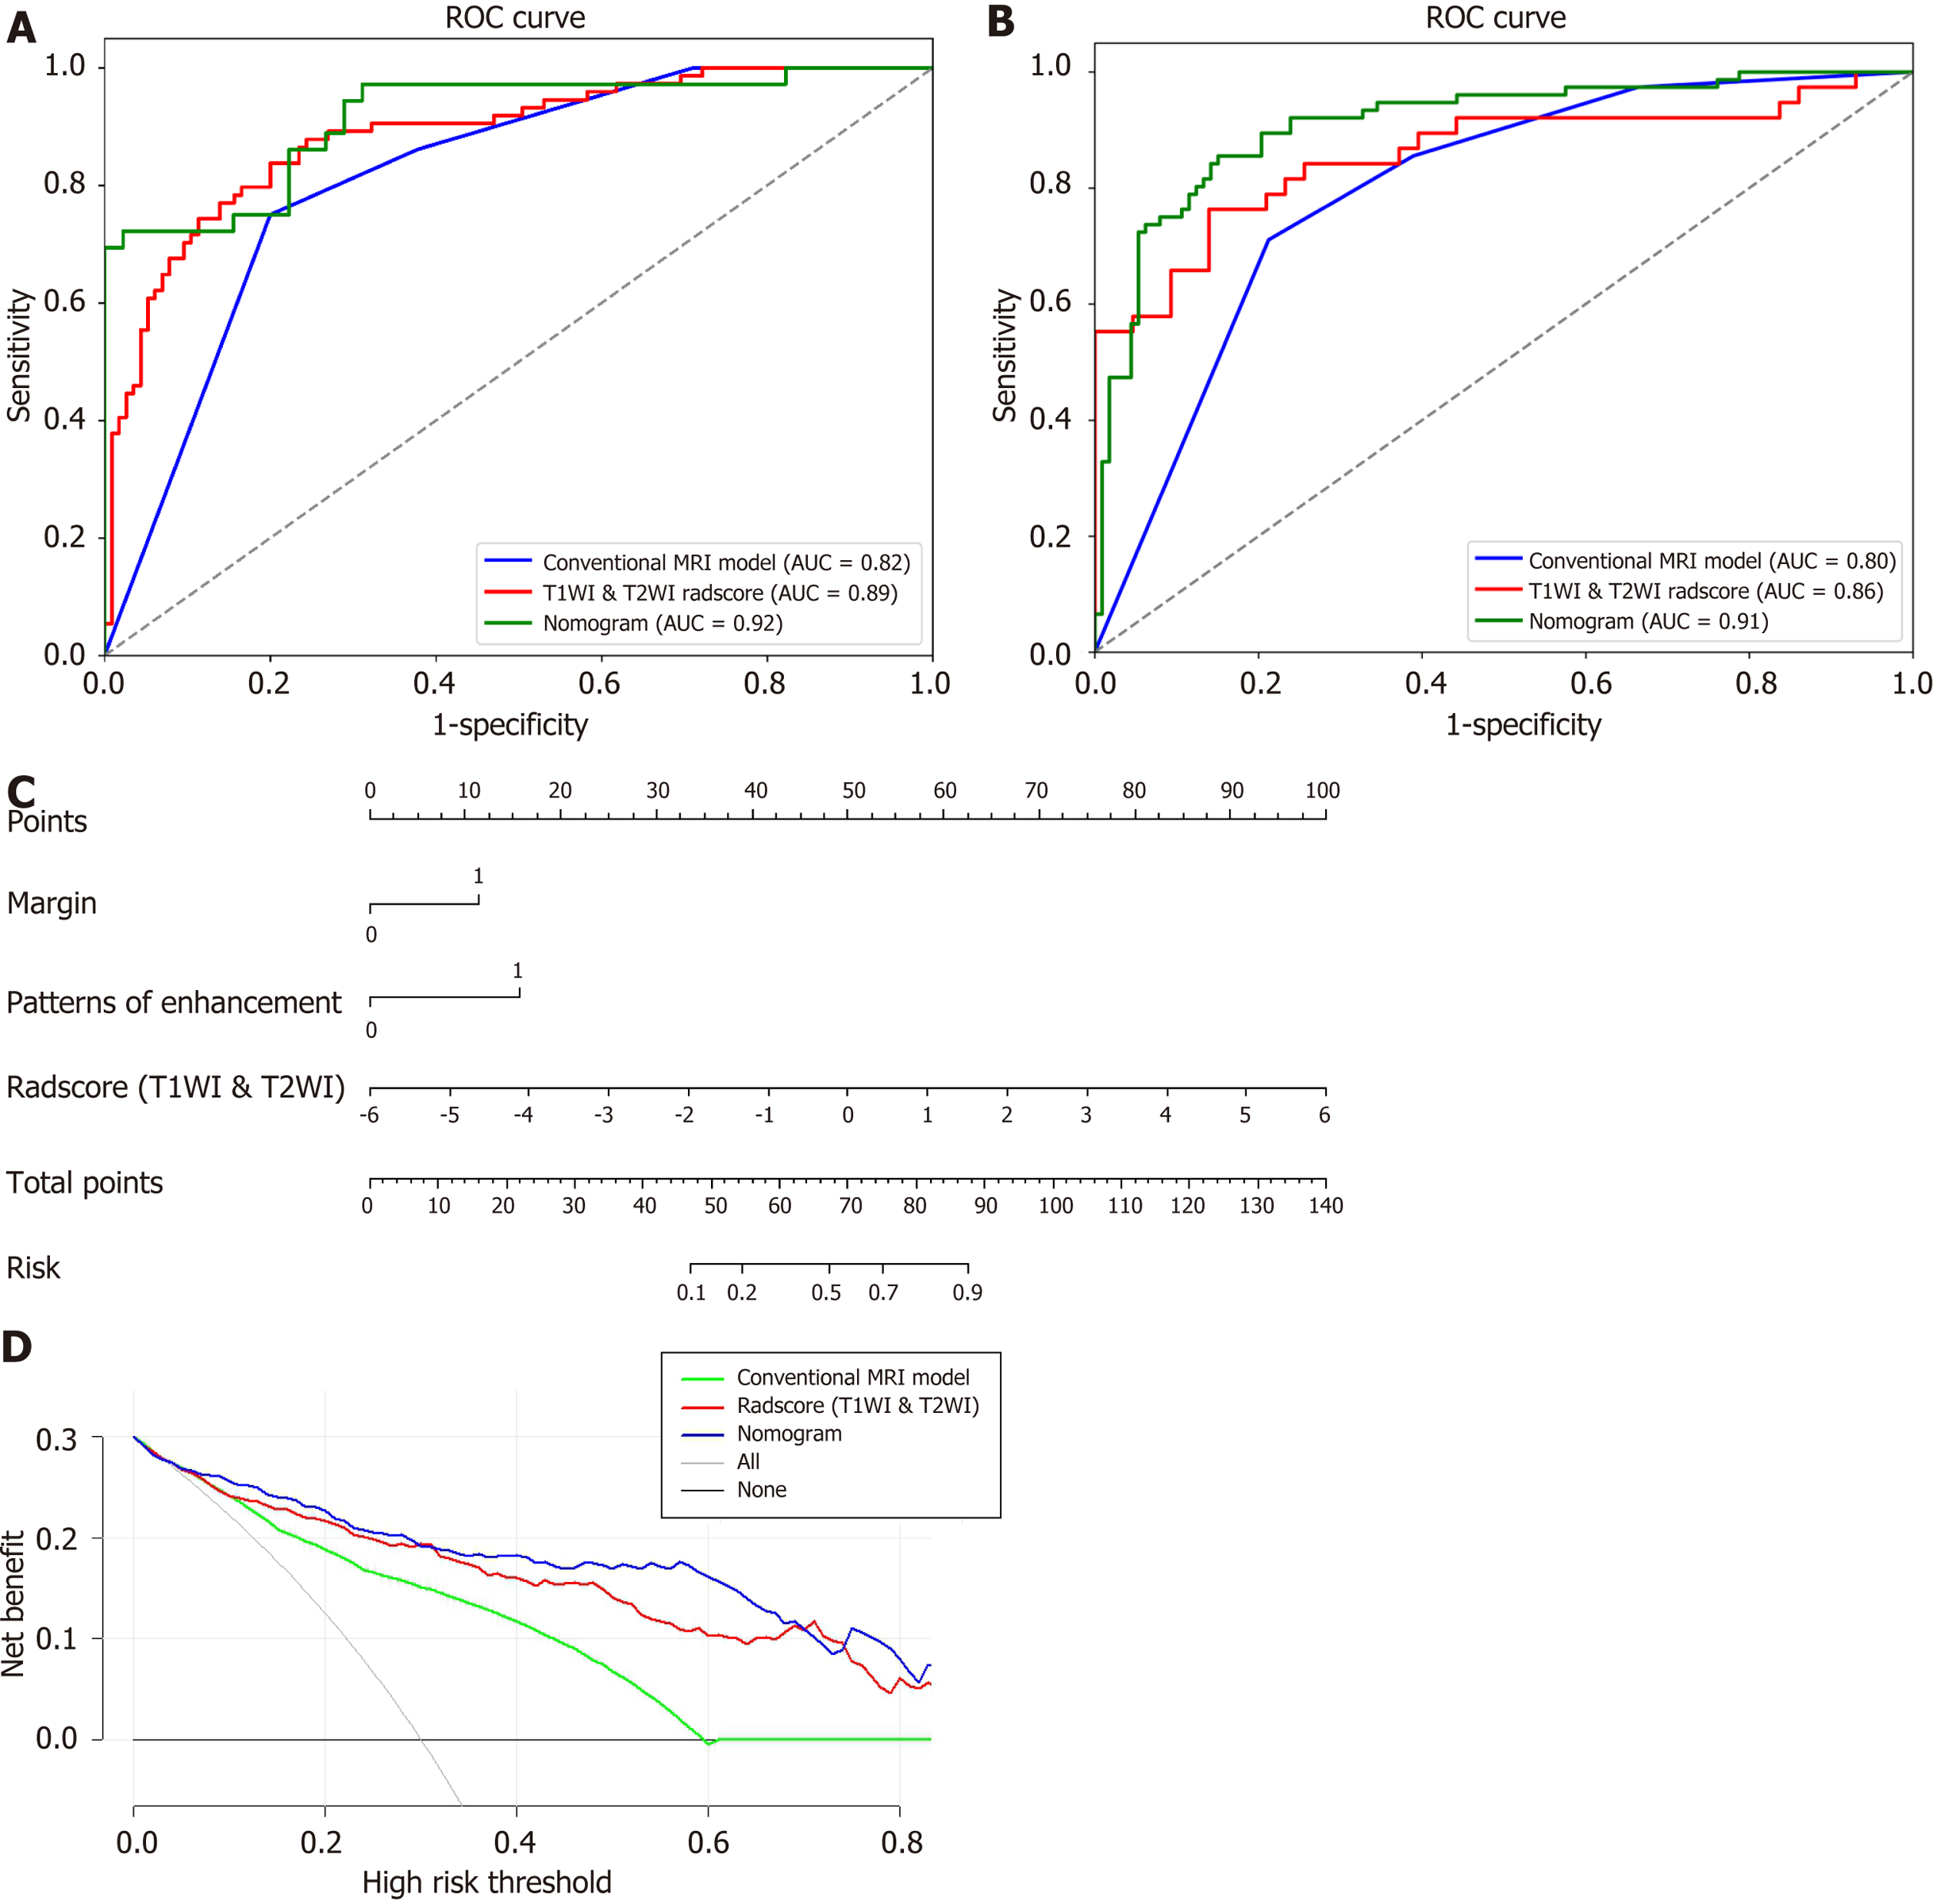
Figure 4 Performance of the final selected model to predict lymph node metastasis.
A and B: Receiver operating characteristic curves of conventional magnetic resonance imaging (MRI) model, T1-weighted imaging (T1WI) & T2-weighted imaging (T2WI)-Radscore and nomogram to predict lymph node metastasis (LNM) with rectal cancer in training set (A), validation set (B); C: Predictive nomogram of LNM; D: Decision curve analysis of models to investigate the clinical usefulness in predicting LNM. It indicates both T1WI & T2WI-Radscore and nomogram obtain more benefit than “treat all”, “treat none”, and the Conventional MRI model when the threshold probability is > 15%. AUC: Area under the curve; ROC: Receiver operating characteristic.
- Citation: Ye YX, Yang L, Kang Z, Wang MQ, Xie XD, Lou KX, Bao J, Du M, Li ZX. Magnetic resonance imaging-based lymph node radiomics for predicting the metastasis of evaluable lymph nodes in rectal cancer. World J Gastrointest Oncol 2024; 16(5): 1849-1860
- URL: https://www.wjgnet.com/1948-5204/full/v16/i5/1849.htm
- DOI: https://dx.doi.org/10.4251/wjgo.v16.i5.1849


