Copyright
©The Author(s) 2024.
World J Gastrointest Oncol. May 15, 2024; 16(5): 1833-1848
Published online May 15, 2024. doi: 10.4251/wjgo.v16.i5.1833
Published online May 15, 2024. doi: 10.4251/wjgo.v16.i5.1833
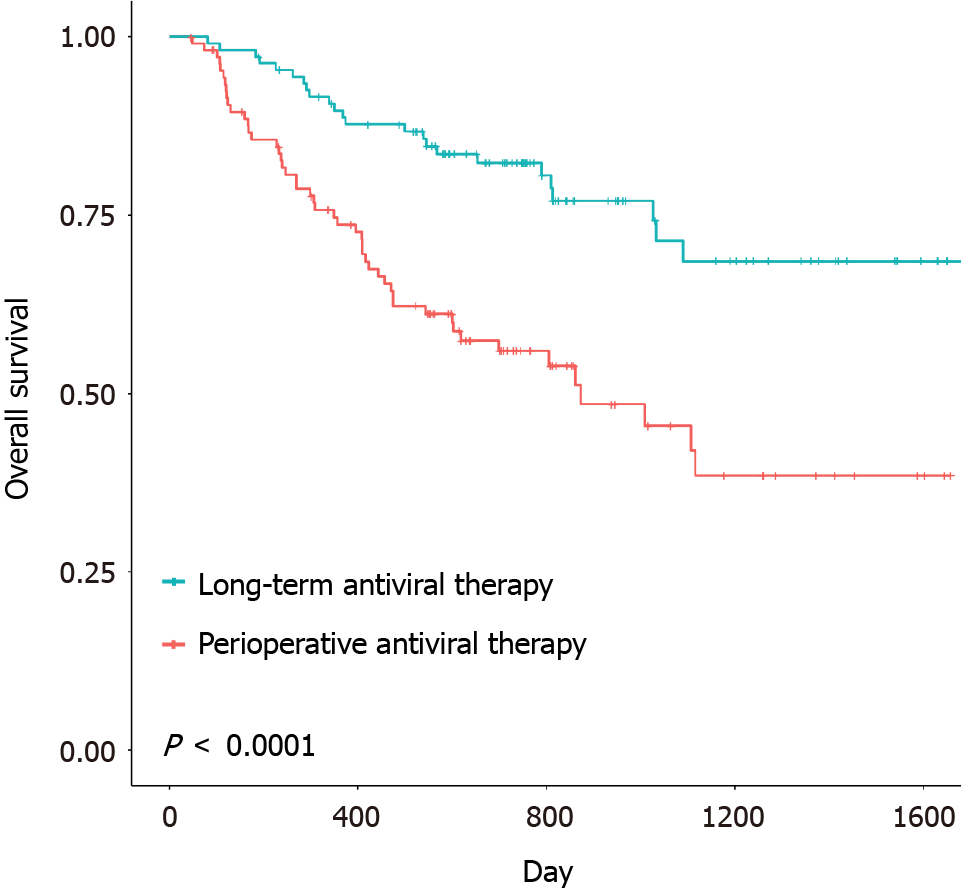
Figure 1 Comparison of overall survival between the two groups.
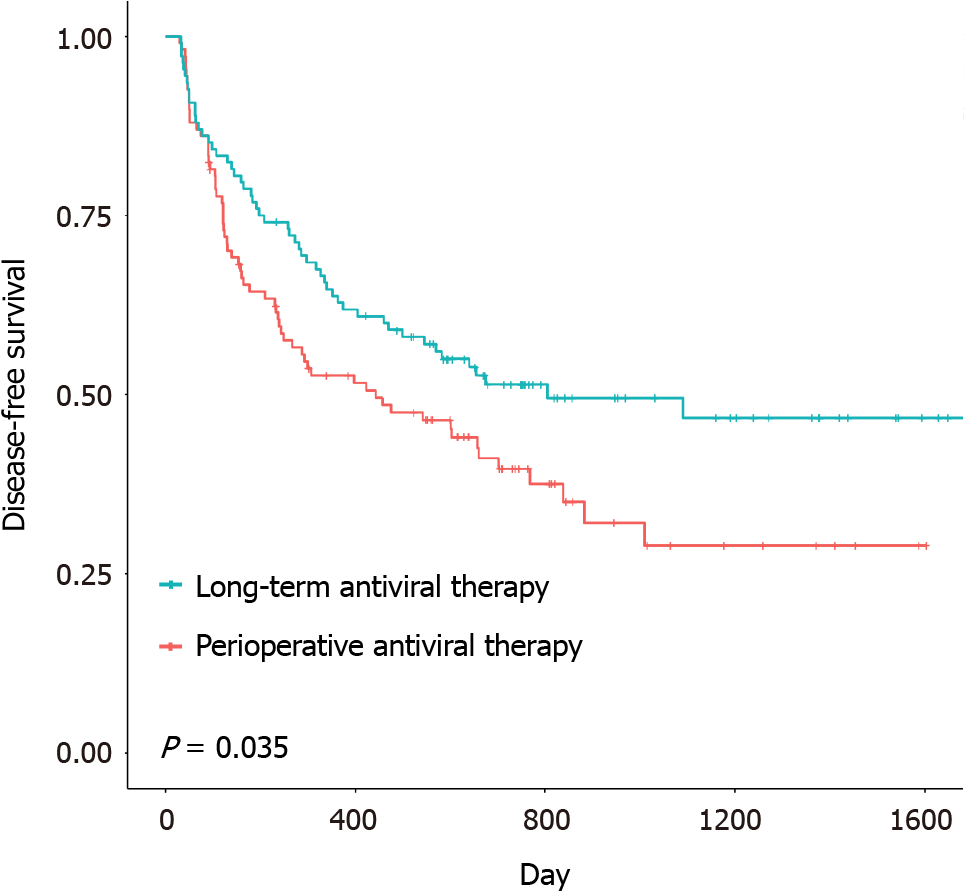
Figure 2 Comparison of disease-free survival between the two groups.
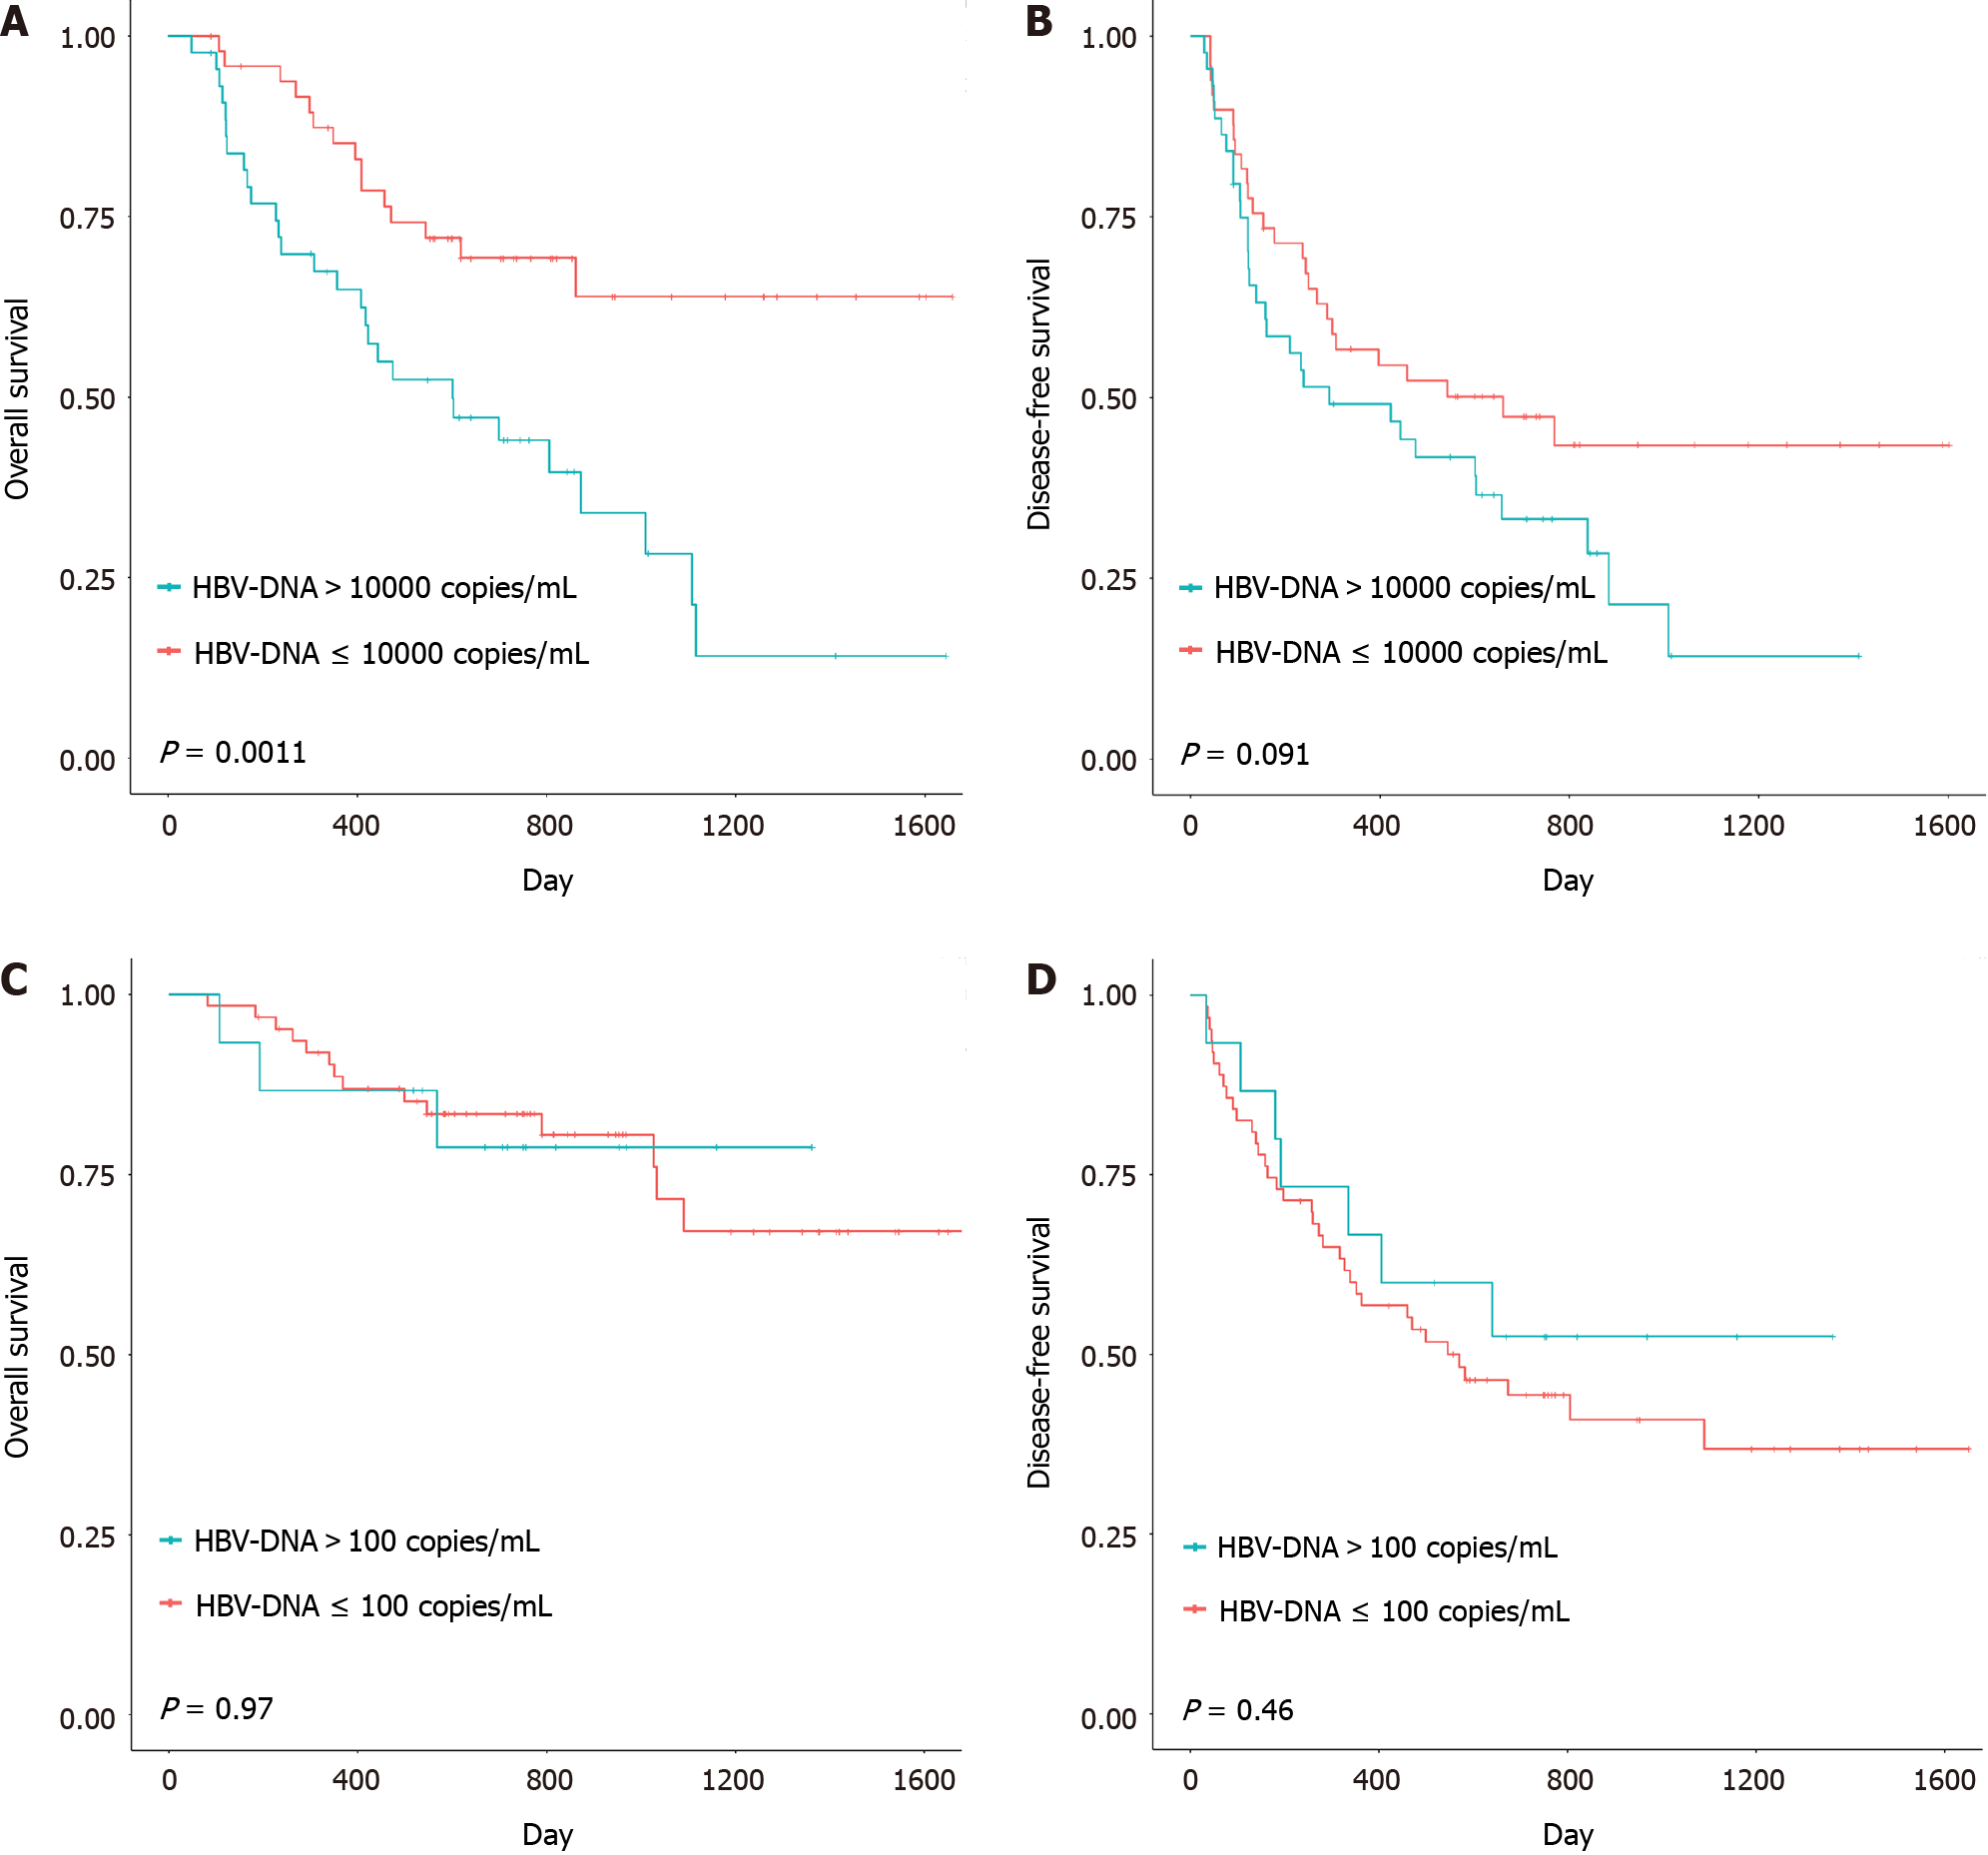
Figure 3 Kaplan–Meier analysis of survival between the subgroups separated by different levels of hepatitis B virus-DNA.
A: The difference between overall survival (OS) in the perioperative antiviral therapy group; B: The difference between disease-free survival (DFS) in the perioperative antiviral therapy group; C: The difference between OS in the long-term antiviral therapy group; D: The difference between DFS in the long-term antiviral therapy group. HBV: Hepatitis B virus.
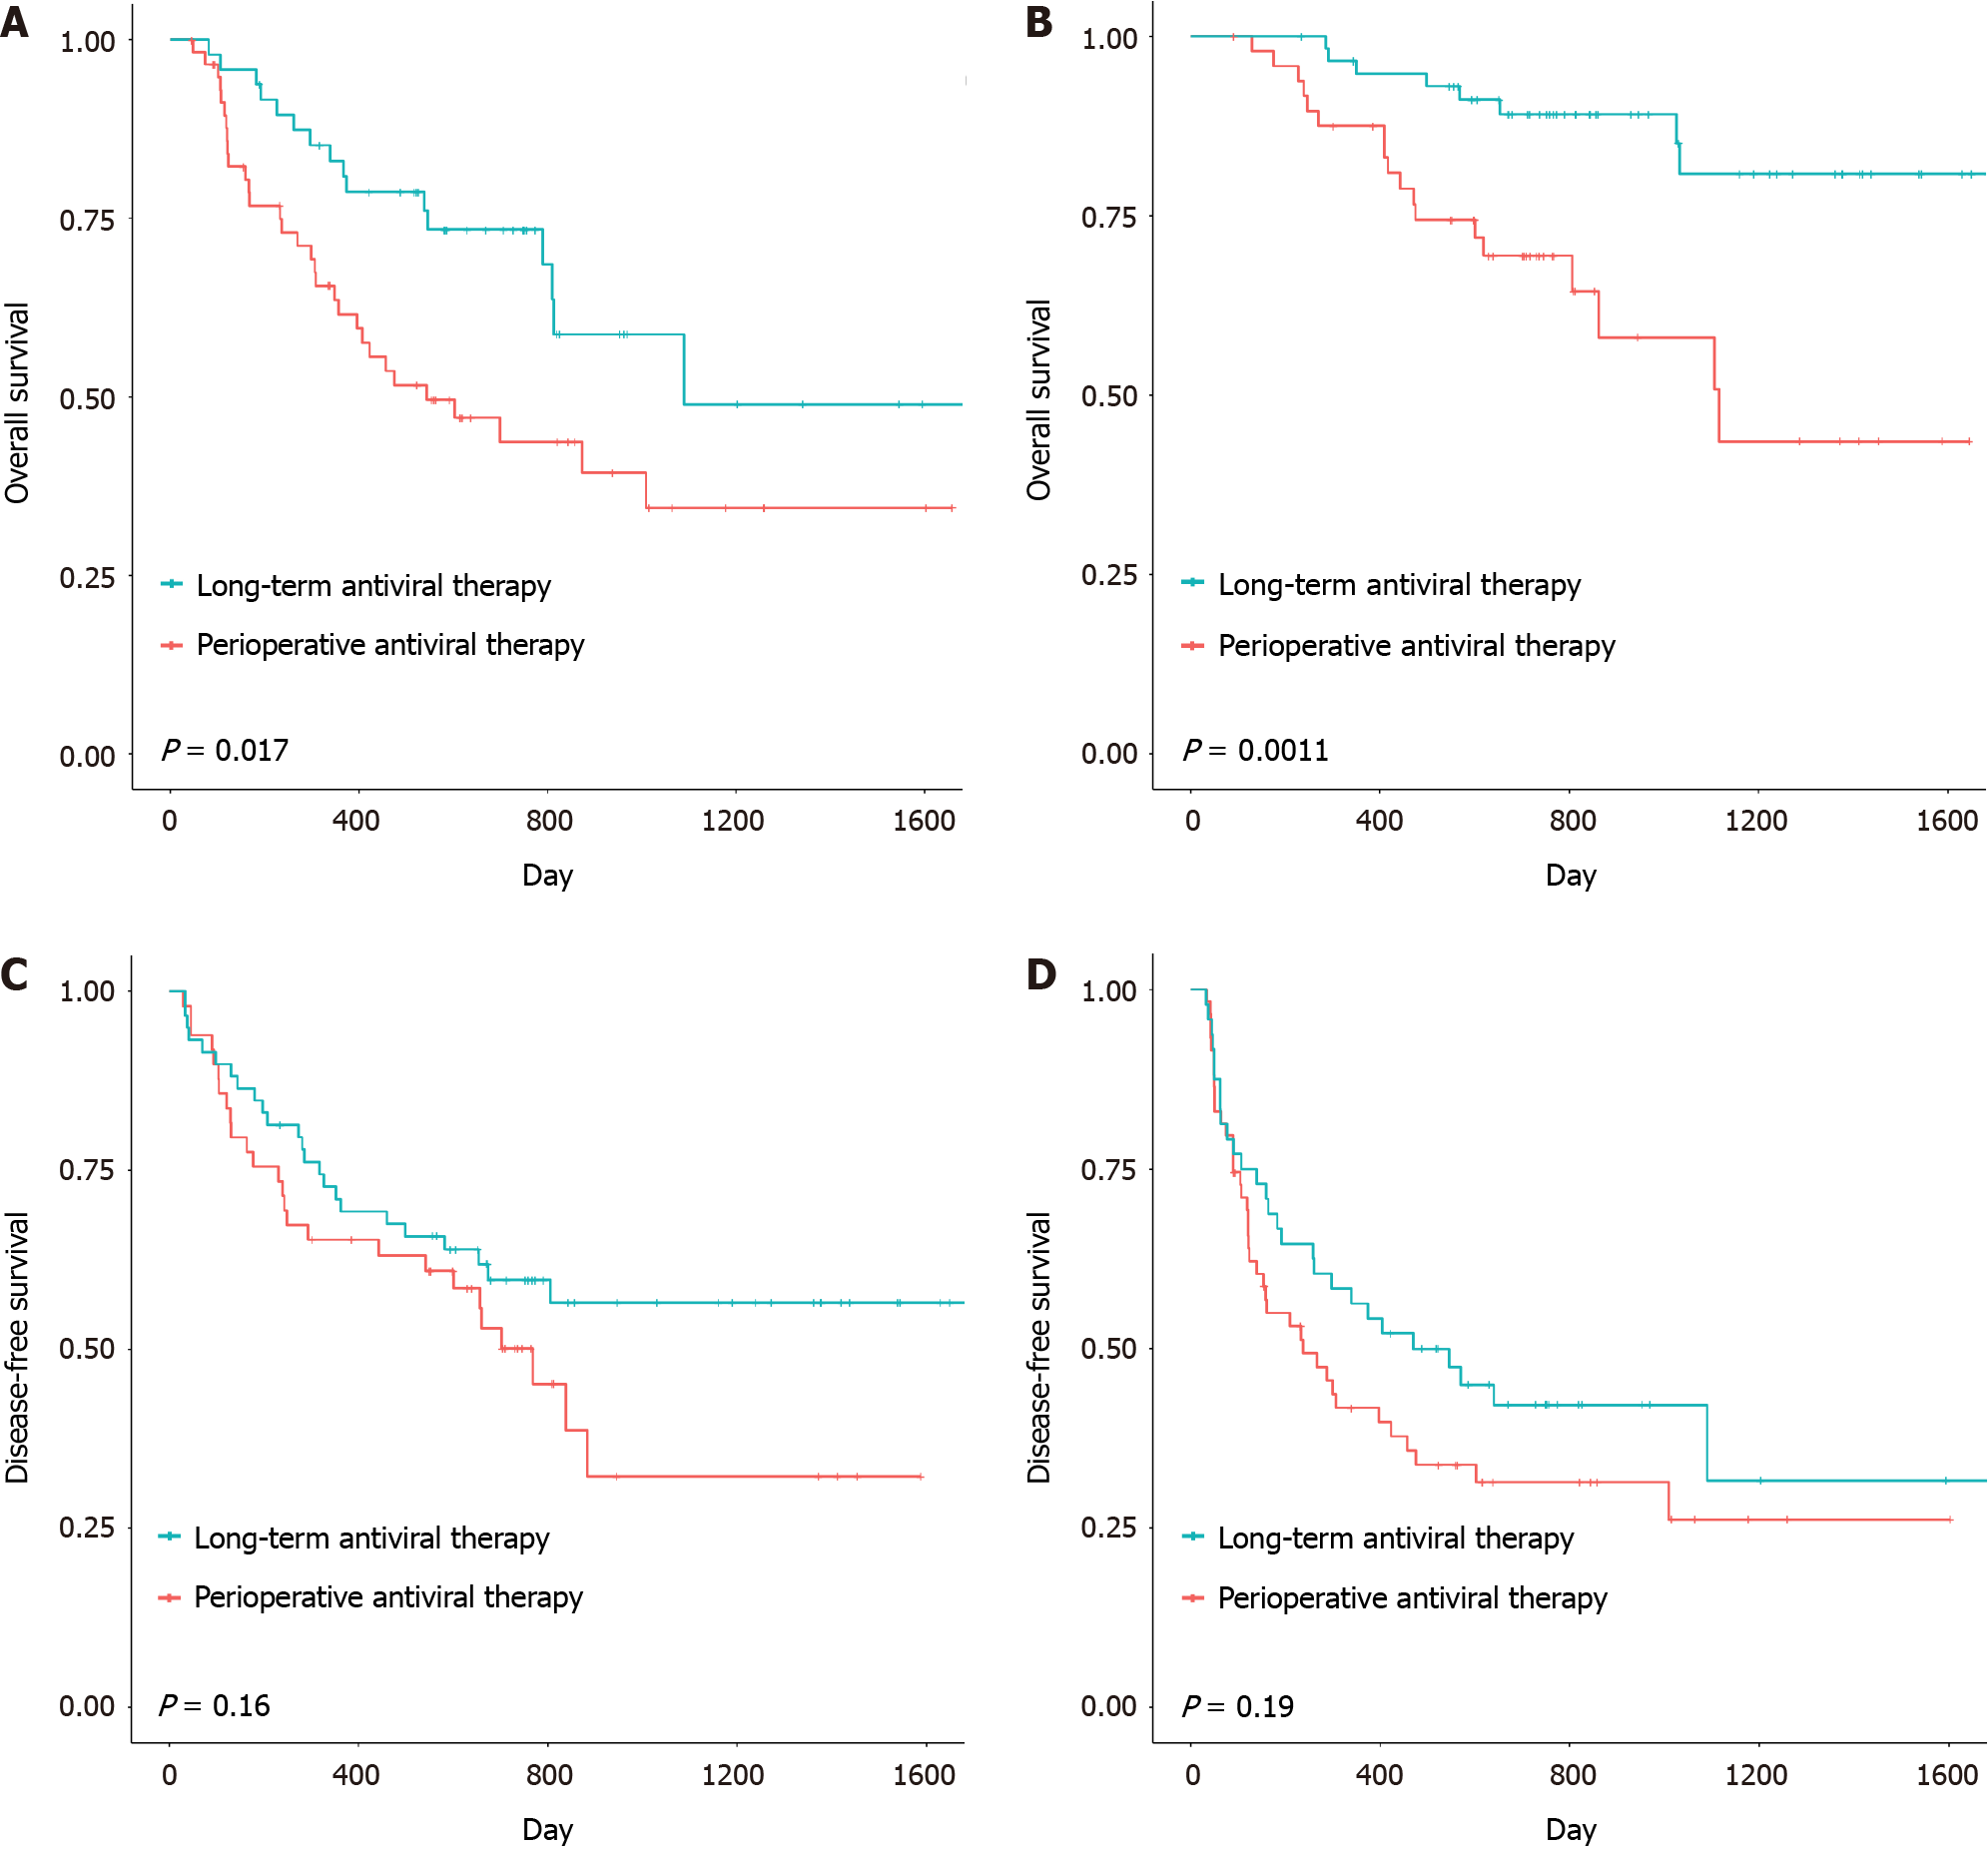
Figure 4 Kaplan–Meier analysis of patient outcomes in subgroups based on the different types of surgery performed.
A: The difference between overall survival (OS) in two groups received type II, III hepatectomy; B: The difference between OS in two groups received type I hepatectomy; C: The difference between disease-free survival (DFS) in two groups received type I hepatectomy; D: The difference between DFS in two groups received type II, III hepatectomy.
- Citation: Mu F, Hu LS, Xu K, Zhao Z, Yang BC, Wang YM, Guo K, Shi JH, Lv Y, Wang B. Perioperative remedial antiviral therapy in hepatitis B virus-related hepatocellular carcinoma resection: How to achieve a better outcome. World J Gastrointest Oncol 2024; 16(5): 1833-1848
- URL: https://www.wjgnet.com/1948-5204/full/v16/i5/1833.htm
- DOI: https://dx.doi.org/10.4251/wjgo.v16.i5.1833


