Copyright
©The Author(s) 2024.
World J Gastrointest Oncol. May 15, 2024; 16(5): 1756-1762
Published online May 15, 2024. doi: 10.4251/wjgo.v16.i5.1756
Published online May 15, 2024. doi: 10.4251/wjgo.v16.i5.1756
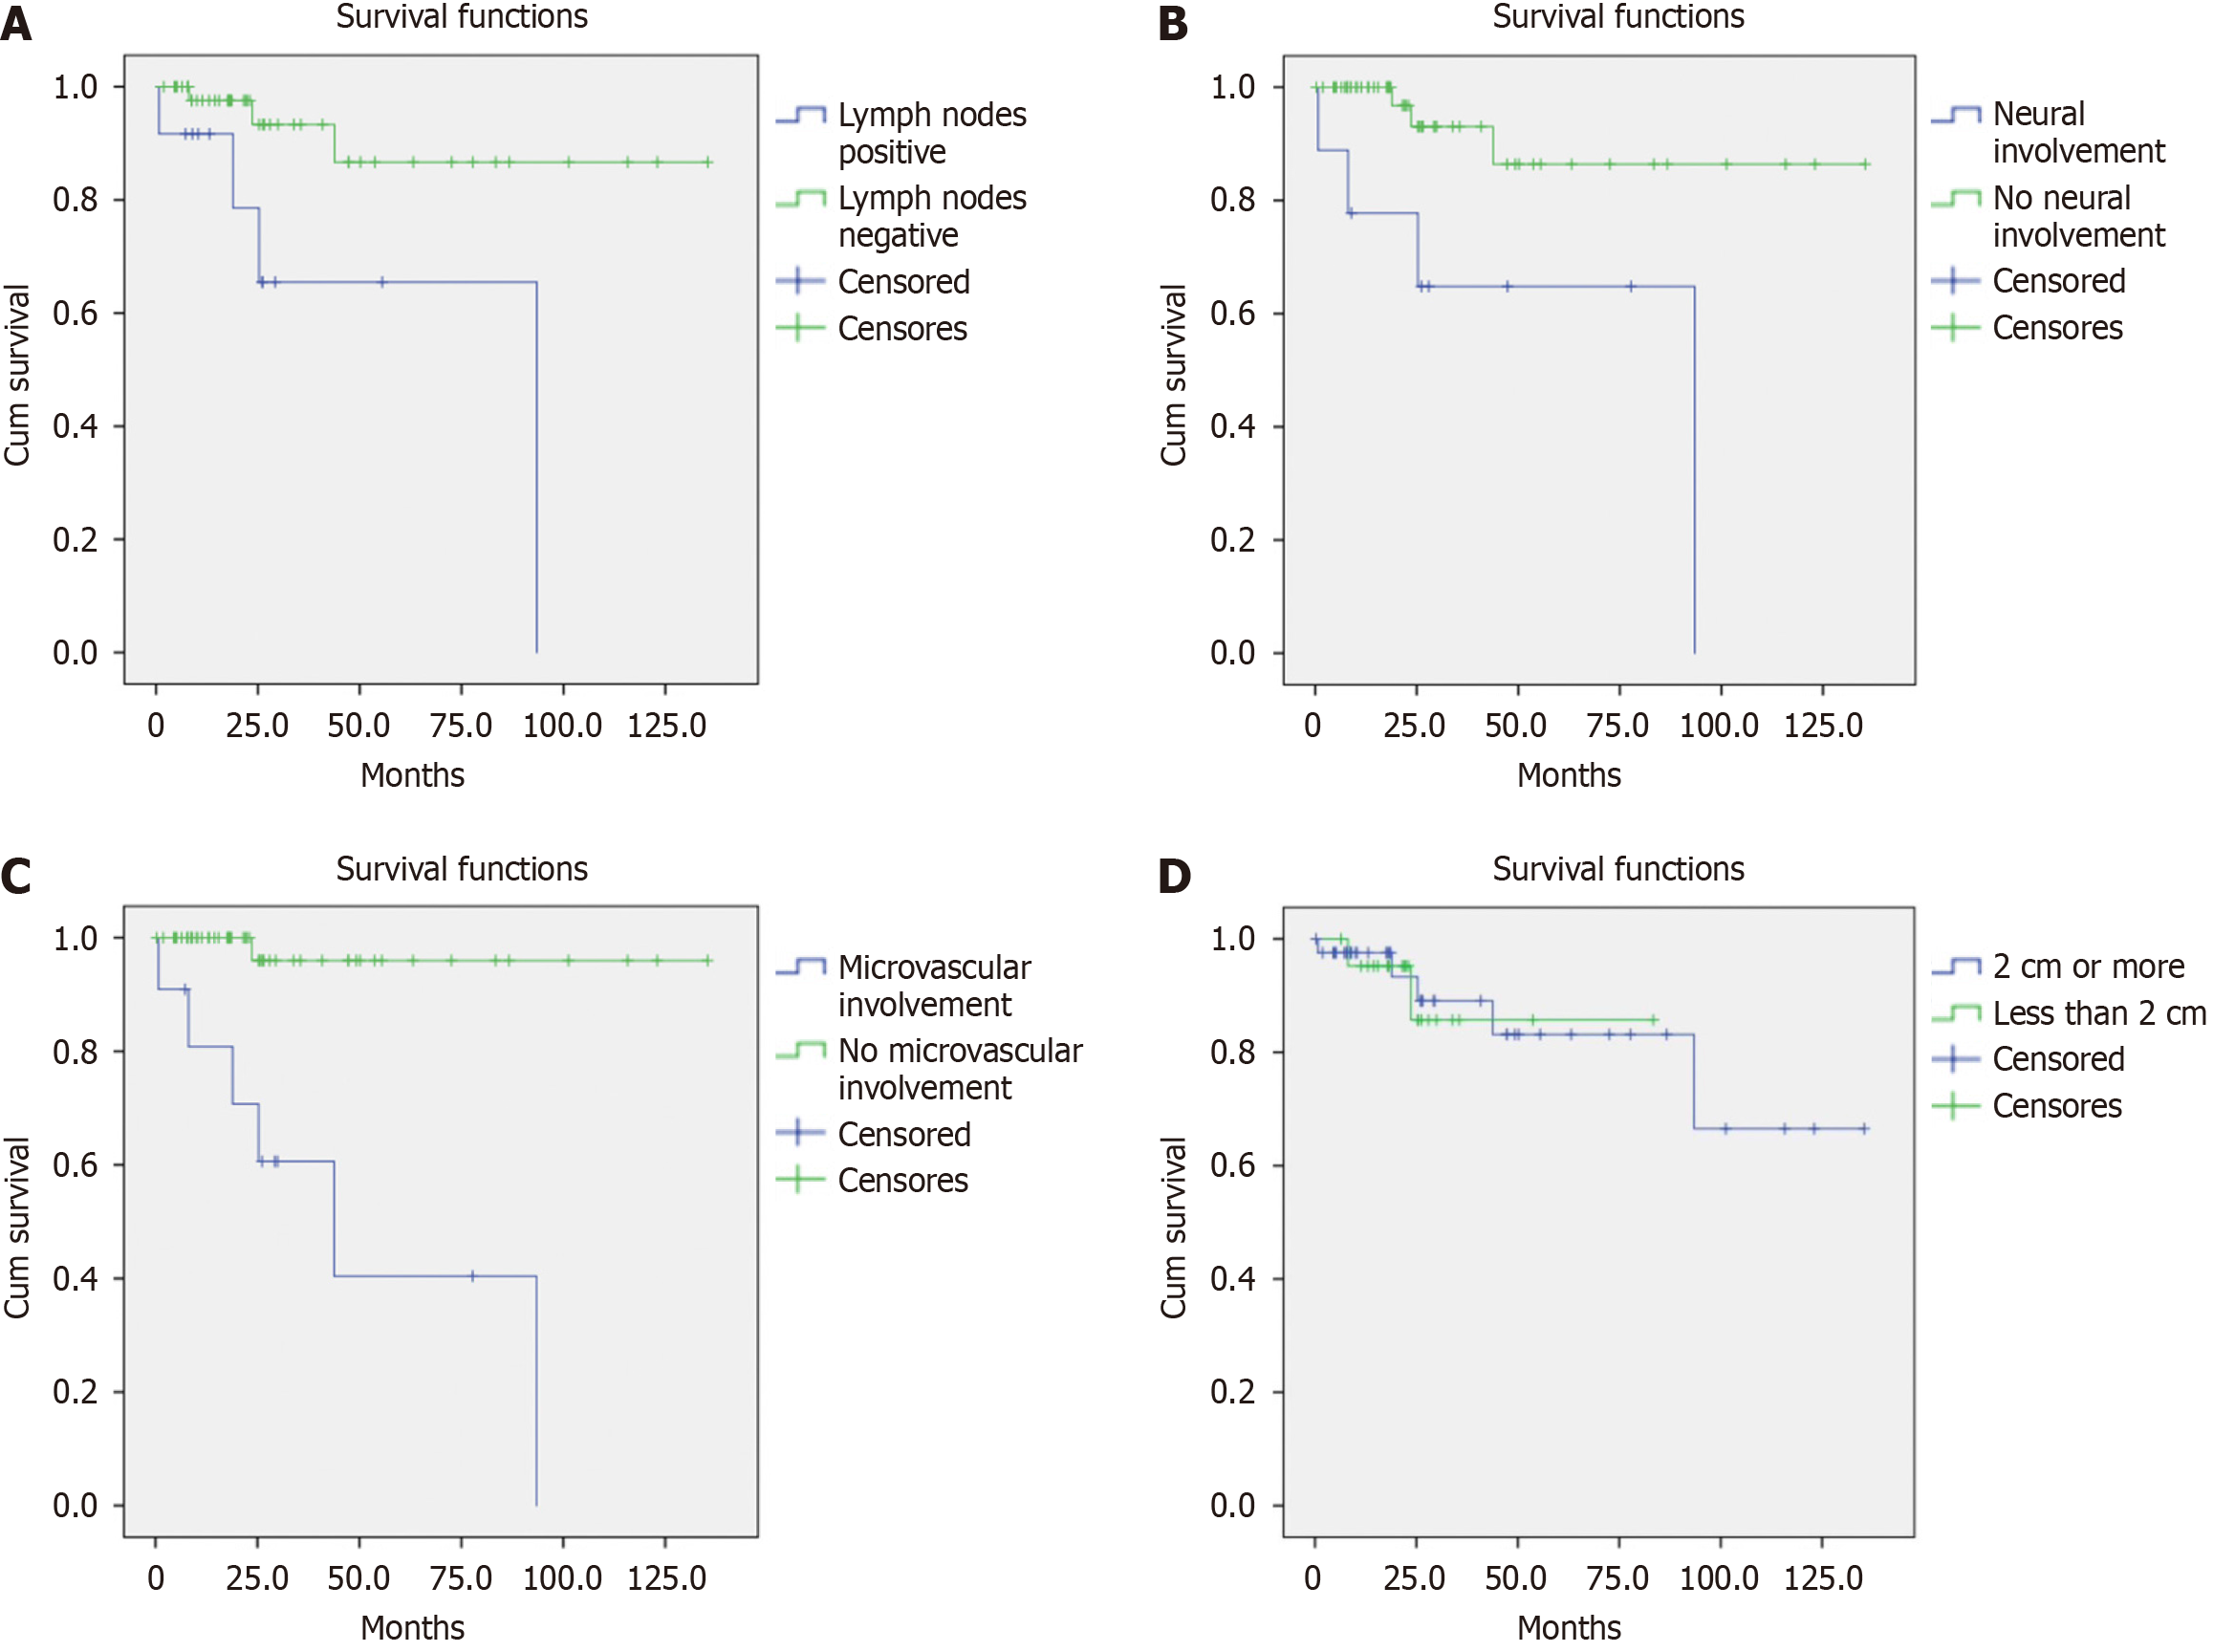
Figure 1 Survival.
A: Survival as a Function of Nodal Involvement. Kaplan-Meier survival curve illustrating patient survival based on lymph node involvement. The purple line represents patients with lymph node involvement; the green line represents patients without lymph node involvement. The difference between the two populations is statistically significant with a P value of 0.011; B: Survival as a Function of Neural Involvement. Kaplan-Meier survival curve illustrating patient survival based on perineural involvement. Patients with perineural involvement are represented by the purple line; patients without perineural involvement are represented by the green line. The difference between the two populations is statistically significant with a P value of 0.005; C: Survival as a function of lymphovascular involvement. Kaplan-Meier survival curve illustrating patient survival as a function of the presence or absence of lymphovascular involvement. The purple line represents patients with lymphovascular involvement; the green line represents patients without lymphovascular involvement. The difference between the two populations is characterized by a P value <0.0001; D: Survival rate as a function of tumor size. Kaplan-Meier survival curve illustrating patient survival rates as a function of tumor size. The green line represents patients with tumors smaller than 2 cm in diameter; the purple line represents patients with tumors larger than 2 cm in diameter. The difference between the two populations is characterized by a P value of 0.88 which was not statistically significant.
- Citation: Hoyos S, Posada-Moreno P, Guzman-Arango N, Chanci-Drago R, Chavez J, Andrés-Duarte A, Salazar-Ochoa S. Pancreatic neuroendocrine tumors: Are tumors smaller than 2 cm truly indolent? World J Gastrointest Oncol 2024; 16(5): 1756-1762
- URL: https://www.wjgnet.com/1948-5204/full/v16/i5/1756.htm
- DOI: https://dx.doi.org/10.4251/wjgo.v16.i5.1756


