Copyright
©The Author(s) 2024.
World J Gastrointest Oncol. Apr 15, 2024; 16(4): 1613-1625
Published online Apr 15, 2024. doi: 10.4251/wjgo.v16.i4.1613
Published online Apr 15, 2024. doi: 10.4251/wjgo.v16.i4.1613
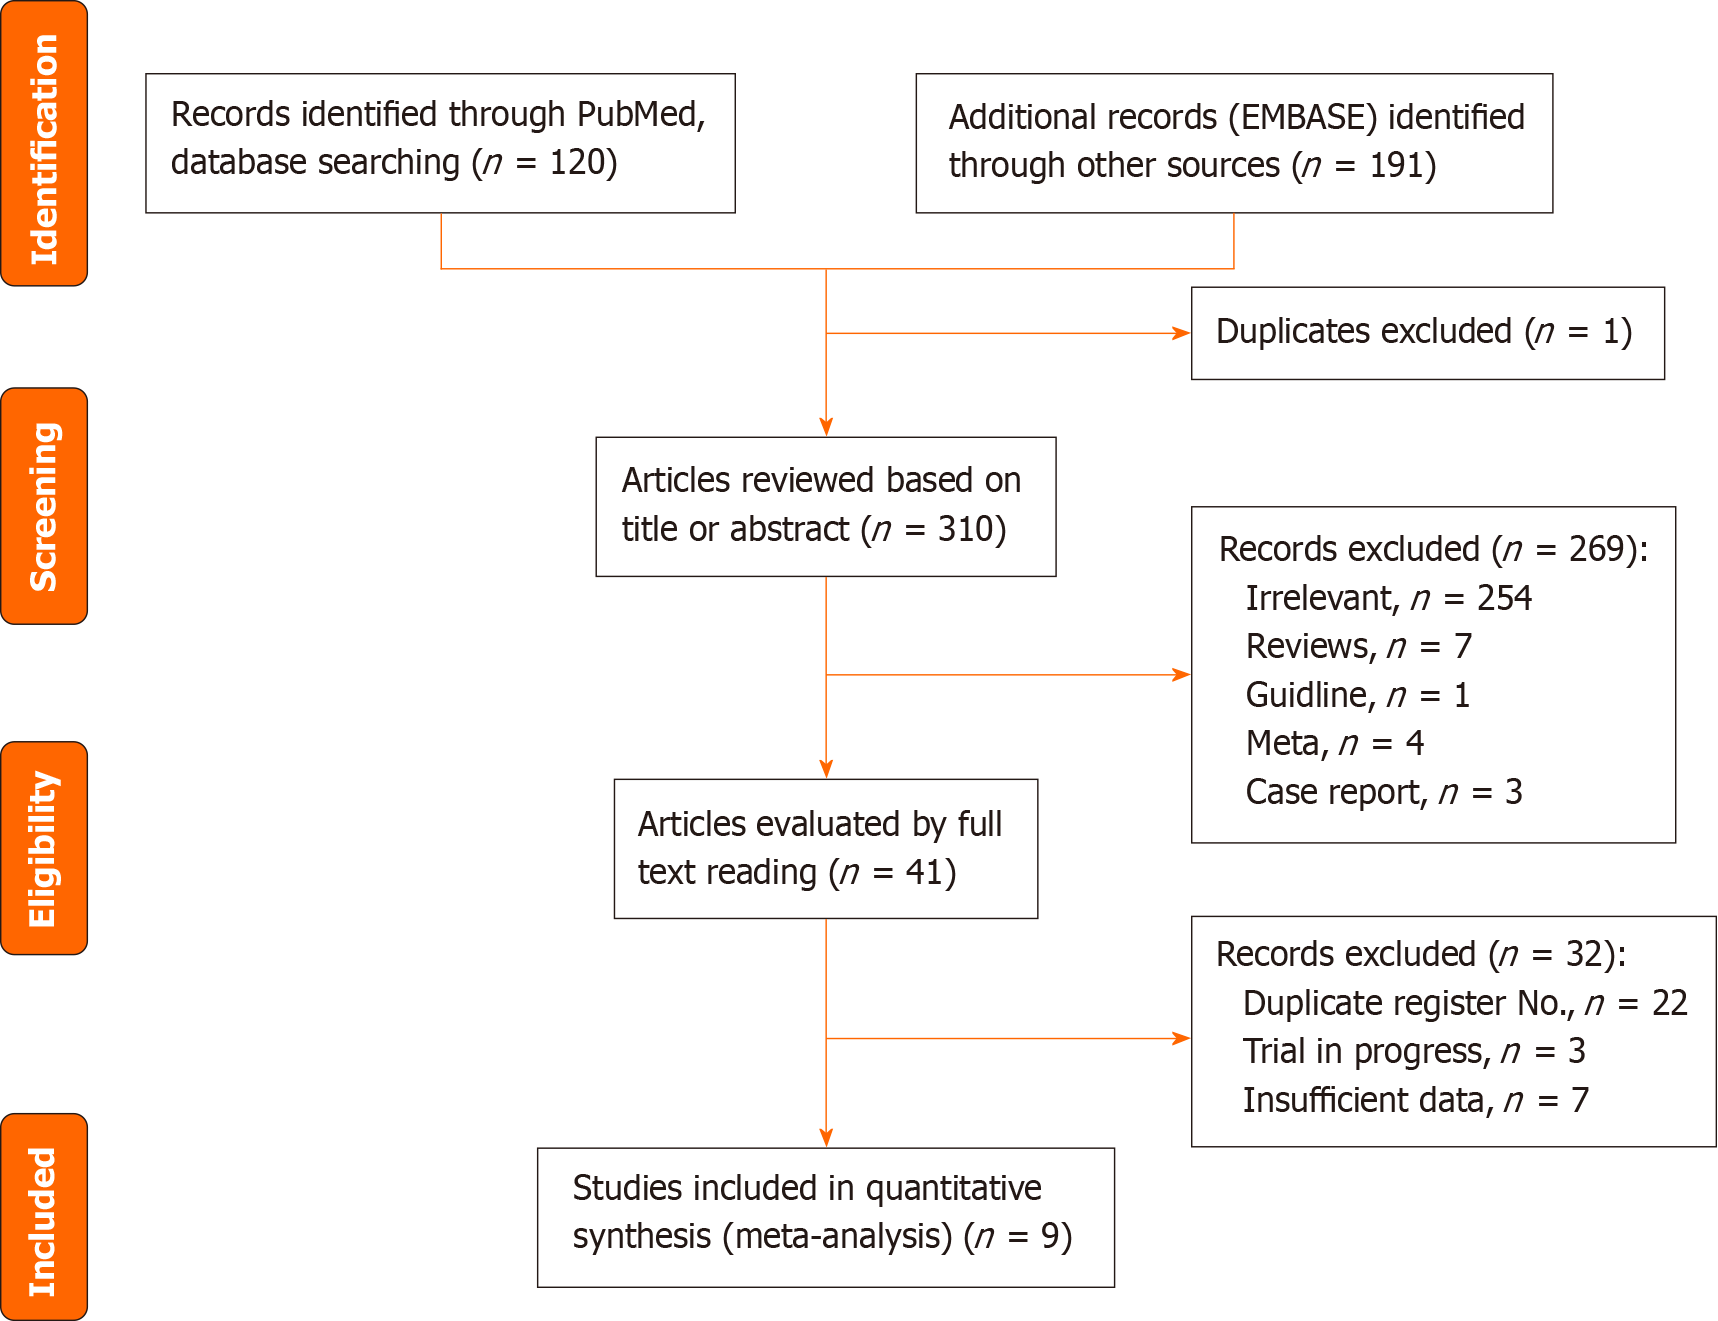
Figure 1
Flow diagram of study inclusions and exclusions for the meta-analysis.
Figure 2 Risk of bias of each included study.
Red circles: Studies with a high risk of bias. Green circles: Studies with a low risk of bias. Yellow circles: Studies with insufficient information for assessing the risk of bias.
Figure 3 The forest plot of overall survival, progression-free survival, objective response rate and all grades adverse events.
A: The forest plot of overall survival; B: The forest plot of progression-free survival; C: The forest plot of objective response rate; D: The forest plot of all grades adverse events. HR: Hazard ratio; OR: Odds ratio; CI: Confidence interval.
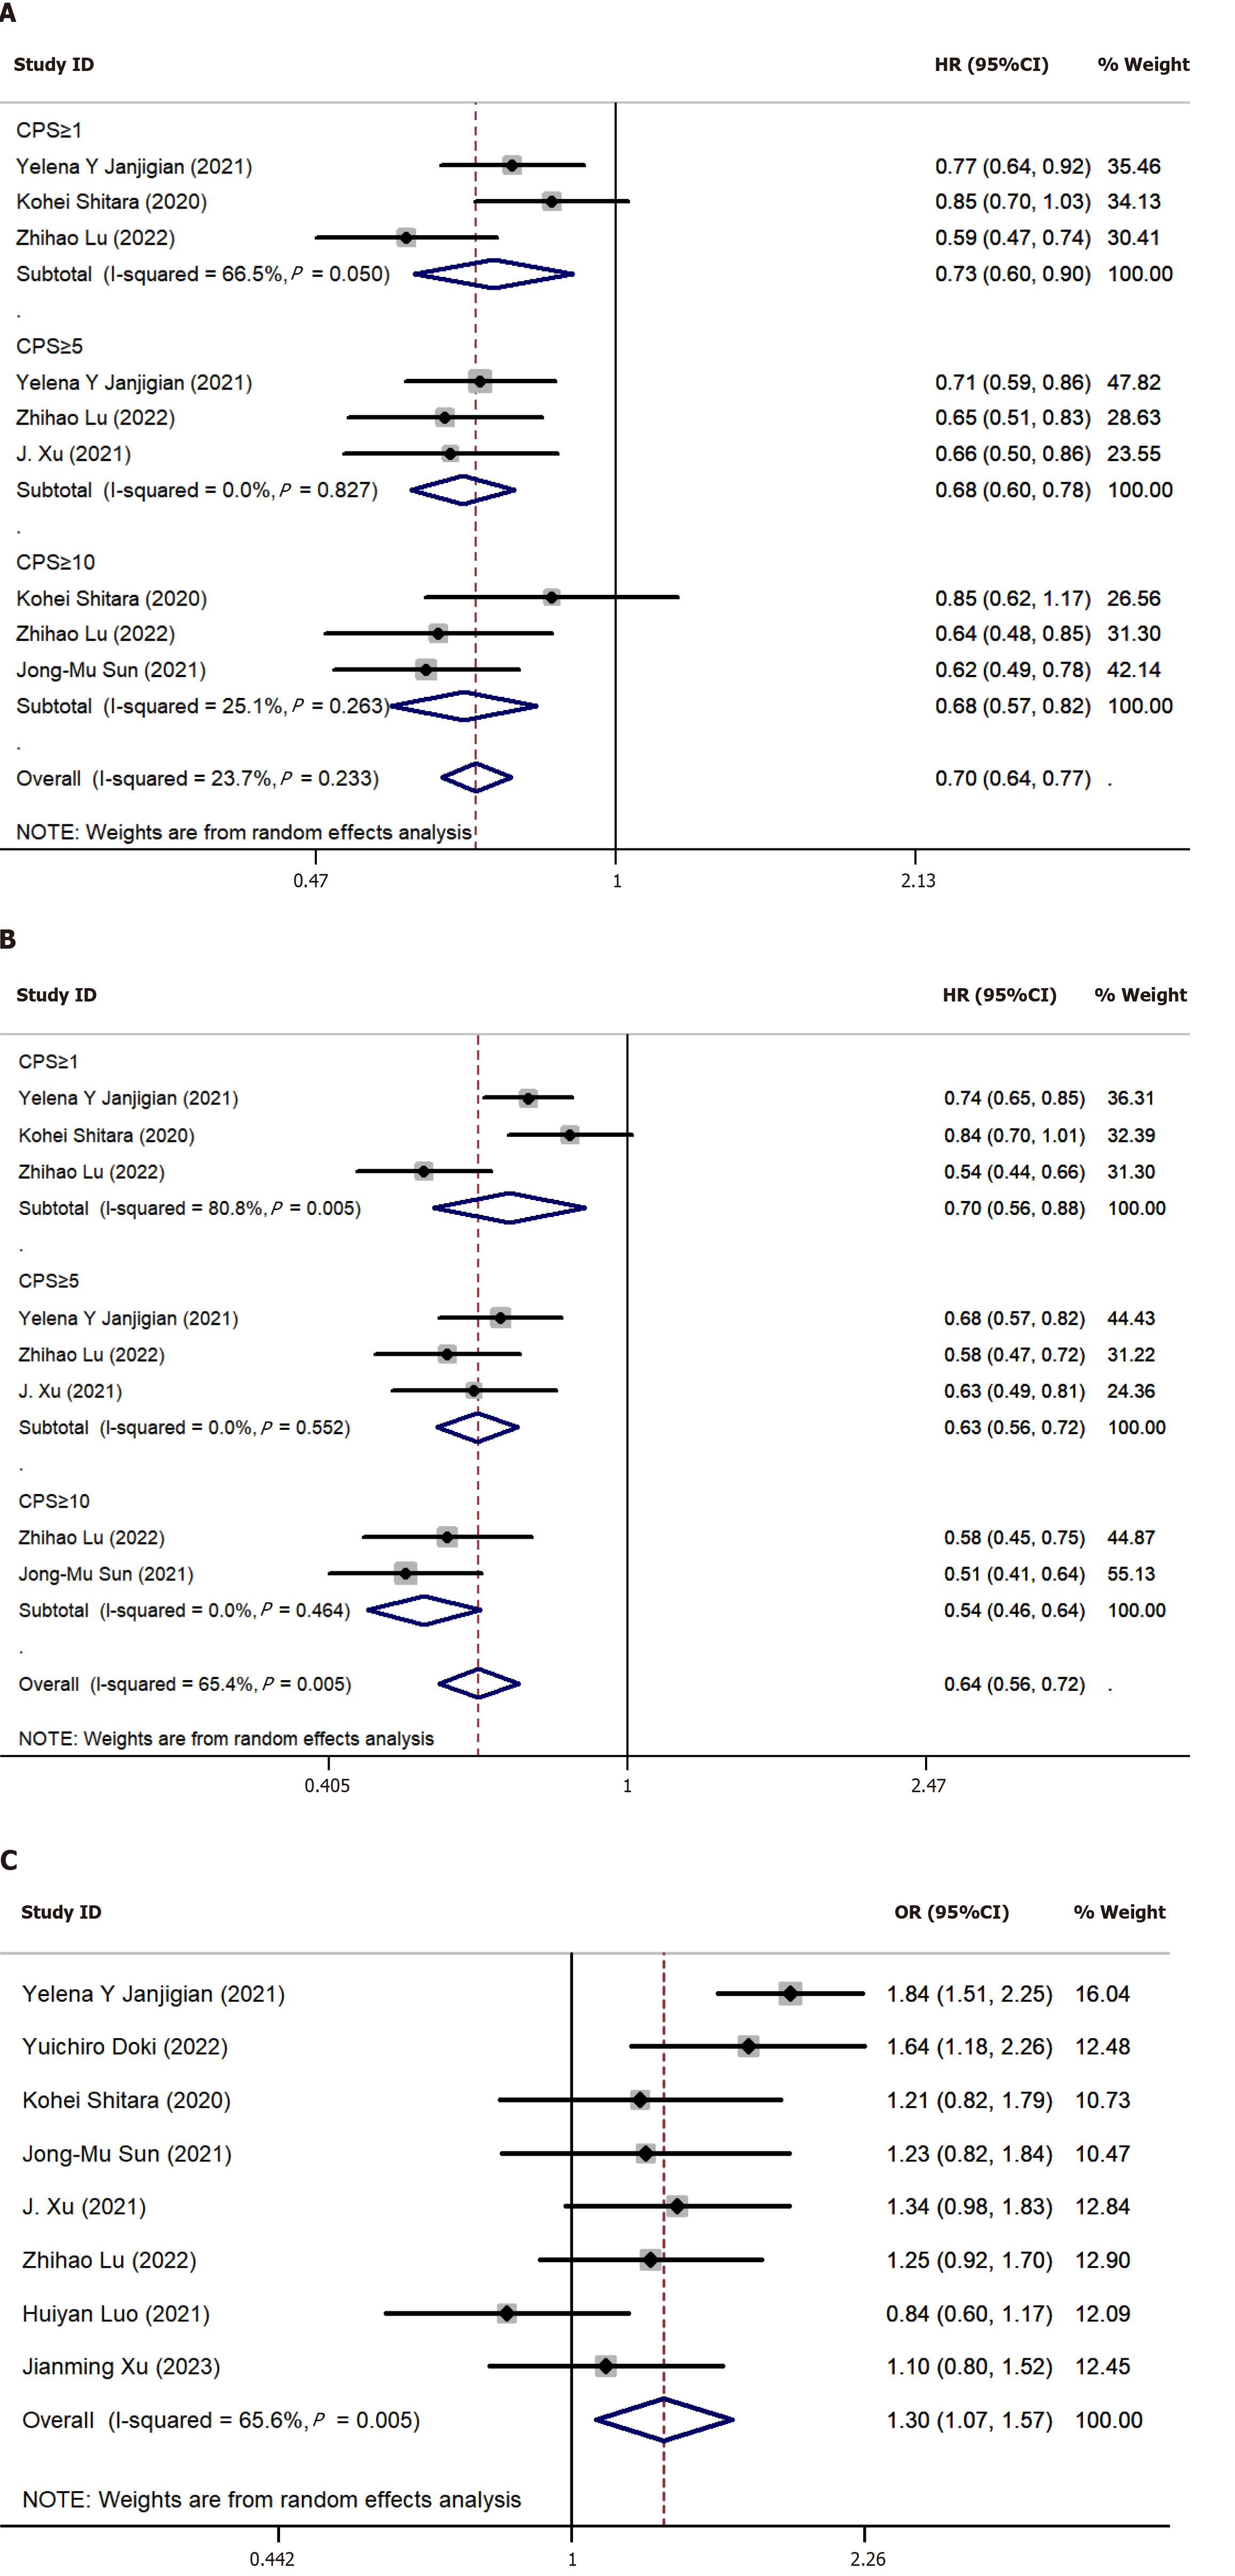
Figure 4 Subgroup analysis of overall survival and progression-free survival based on programmed death-ligand 1 combined positive score and ≥ 3 grades adverse events.
A: Subgroup analysis of overall survival based on programmed death-ligand 1 (PD-L1) combined positive score (CPS); B: Subgroup analysis of progression-free survival based on PD-L1 CPS score; C: Subgroup analysis of ≥ 3 grades adverse events. HR: Hazard ratio; OR: Odds ratio; CI: Confidence interval.
- Citation: Zhang XM, Yang T, Xu YY, Li BZ, Shen W, Hu WQ, Yan CW, Zong L. Effectiveness and tolerability of programmed cell death protein-1 inhibitor + chemotherapy compared to chemotherapy for upper gastrointestinal tract cancers. World J Gastrointest Oncol 2024; 16(4): 1613-1625
- URL: https://www.wjgnet.com/1948-5204/full/v16/i4/1613.htm
- DOI: https://dx.doi.org/10.4251/wjgo.v16.i4.1613


