Copyright
©The Author(s) 2024.
World J Gastrointest Oncol. Apr 15, 2024; 16(4): 1514-1531
Published online Apr 15, 2024. doi: 10.4251/wjgo.v16.i4.1514
Published online Apr 15, 2024. doi: 10.4251/wjgo.v16.i4.1514
Figure 1 Flowchart of construction of the cyclin dependent kinase inhibitor 2A-related competitive endogenous RNA network.
HCC: Hepatocellular carcinoma; TCGA: The Cancer Genome Atlas; CDKN2A: Cyclin dependent kinase inhibitor 2A; GAS5: Growth arrest specific 5; SOX11: SRY-box transcription factor 11; DElncRNAs: Differentially expressed long non-coding RNAs; DEmiRNAs: Differentially expressed microRNAs; DEmRNAs: Differentially expressed messenger RNAs.
Figure 2 The mutation landscape of cyclin dependent kinase inhibitor 2A in hepatocellular carcinoma based on cBioPortal database.
A: OncoPrint plot indicated different types and proportions of cyclin dependent kinase inhibitor 2A (CDKN2A) mutations; B and C: The association between CDKN2A copy number and mRNA expression are shown in the dot plot (B) and correlation plot (C); D: Demonstration of mutation sites, mutation types, and mutation cases on the two-dimensional structure of the CDKN2A protein; E: The cell cycle pathway mapper of CDKN2A in hepatocellular carcinoma. CDKN2A: Cyclin dependent kinase inhibitor 2A.
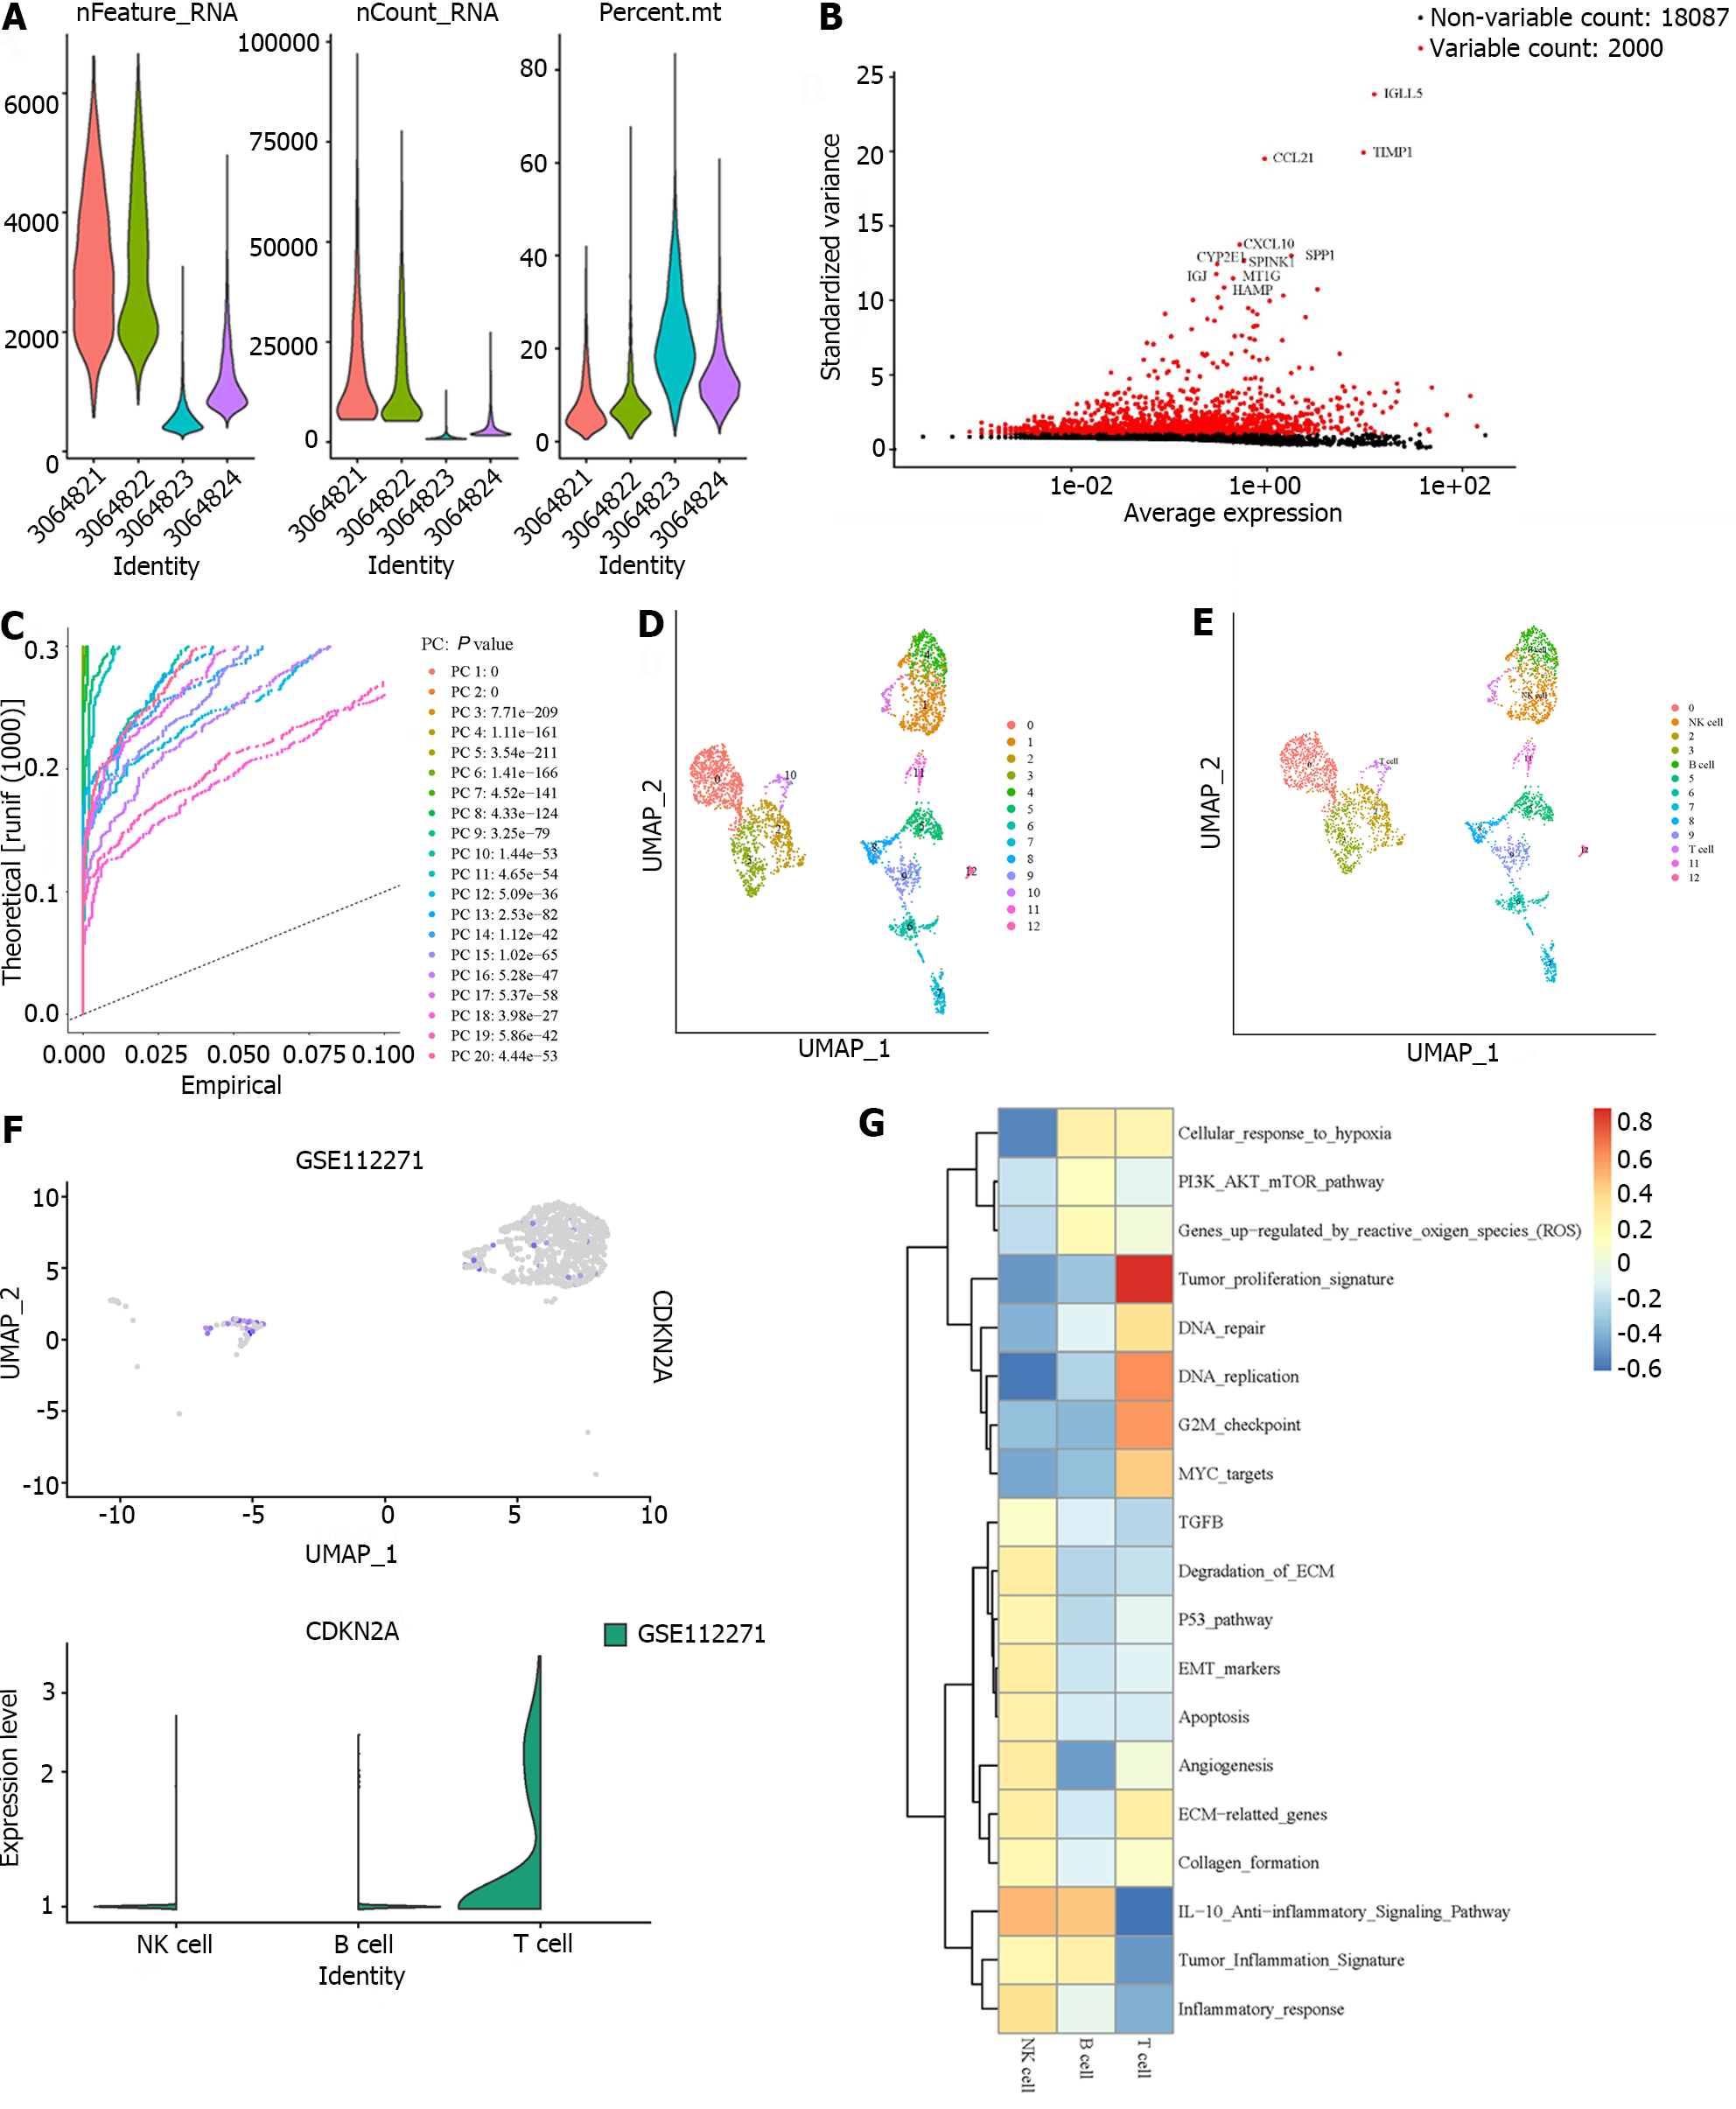
Figure 3 Single cell analysis of cyclin dependent kinase inhibitor 2A.
A: Quality control assessment and data filtering of single cell sequence data; B: Highly variable genes used for clustering and cell identification; C: Top 20 principal components were identified based on P value < 0.05; D: Visualization of different cell clusters; E: Corresponding annotation of the cell clusters; F: cyclin dependent kinase inhibitor 2A expression between different immune cell clusters; G: The pathways highly enriched in different immune cell clusters.
Figure 4 Screening of differentially expressed long non-coding RNAs, differentially expressed microRNAs, and differentially expressed messenger RNAs.
A-C: The volcano plots describe 2032 differentially expressed long non-coding RNAs (A; |log2fold change| > 0.5 and adjusted P value < 0.05), 23 differentially expressed microRNAs (B; |log2fold change| > 0.3 and adjusted P value < 0.05), and 2055 differentially expressed messenger RNAs (C; |log2fold change| > 0.5 and adjusted P value < 0.05); D-F: The horizontal axis of the heatmap indicates the samples, and the vertical axis of the heatmap indicates 15 significant differentially expressed genes. aP < 0.05, bP < 0.01, cP < 0.001. lncRNA: Long non-coding RNAs.
Figure 5 Construction and functional enrichment analysis of long noncoding RNA-miRNA-mRNA triple regulatory networks.
The diamonds denote long noncoding RNAs (lncRNAs), ellipses denote miRNAs, rectangles denote mRNAs. A: Cytoplasmic/nuclear localization of growth arrest-specific 5; B: The lncRNA-miRNA-mRNA triple regulatory network in hepatocellular carcinoma. Red indicates upregulated, and blue represents downregulated; C: Top 15 score genes identified by maximum clique centrality algorithm; D: Functional enrichment analysis of the differentially expressed messenger RNAs (DEmRNAs) in the network; E: Interactive network of the DEmRNAs. RCI: Relative concentration index; GAS5: Growth arrest-specific 5.
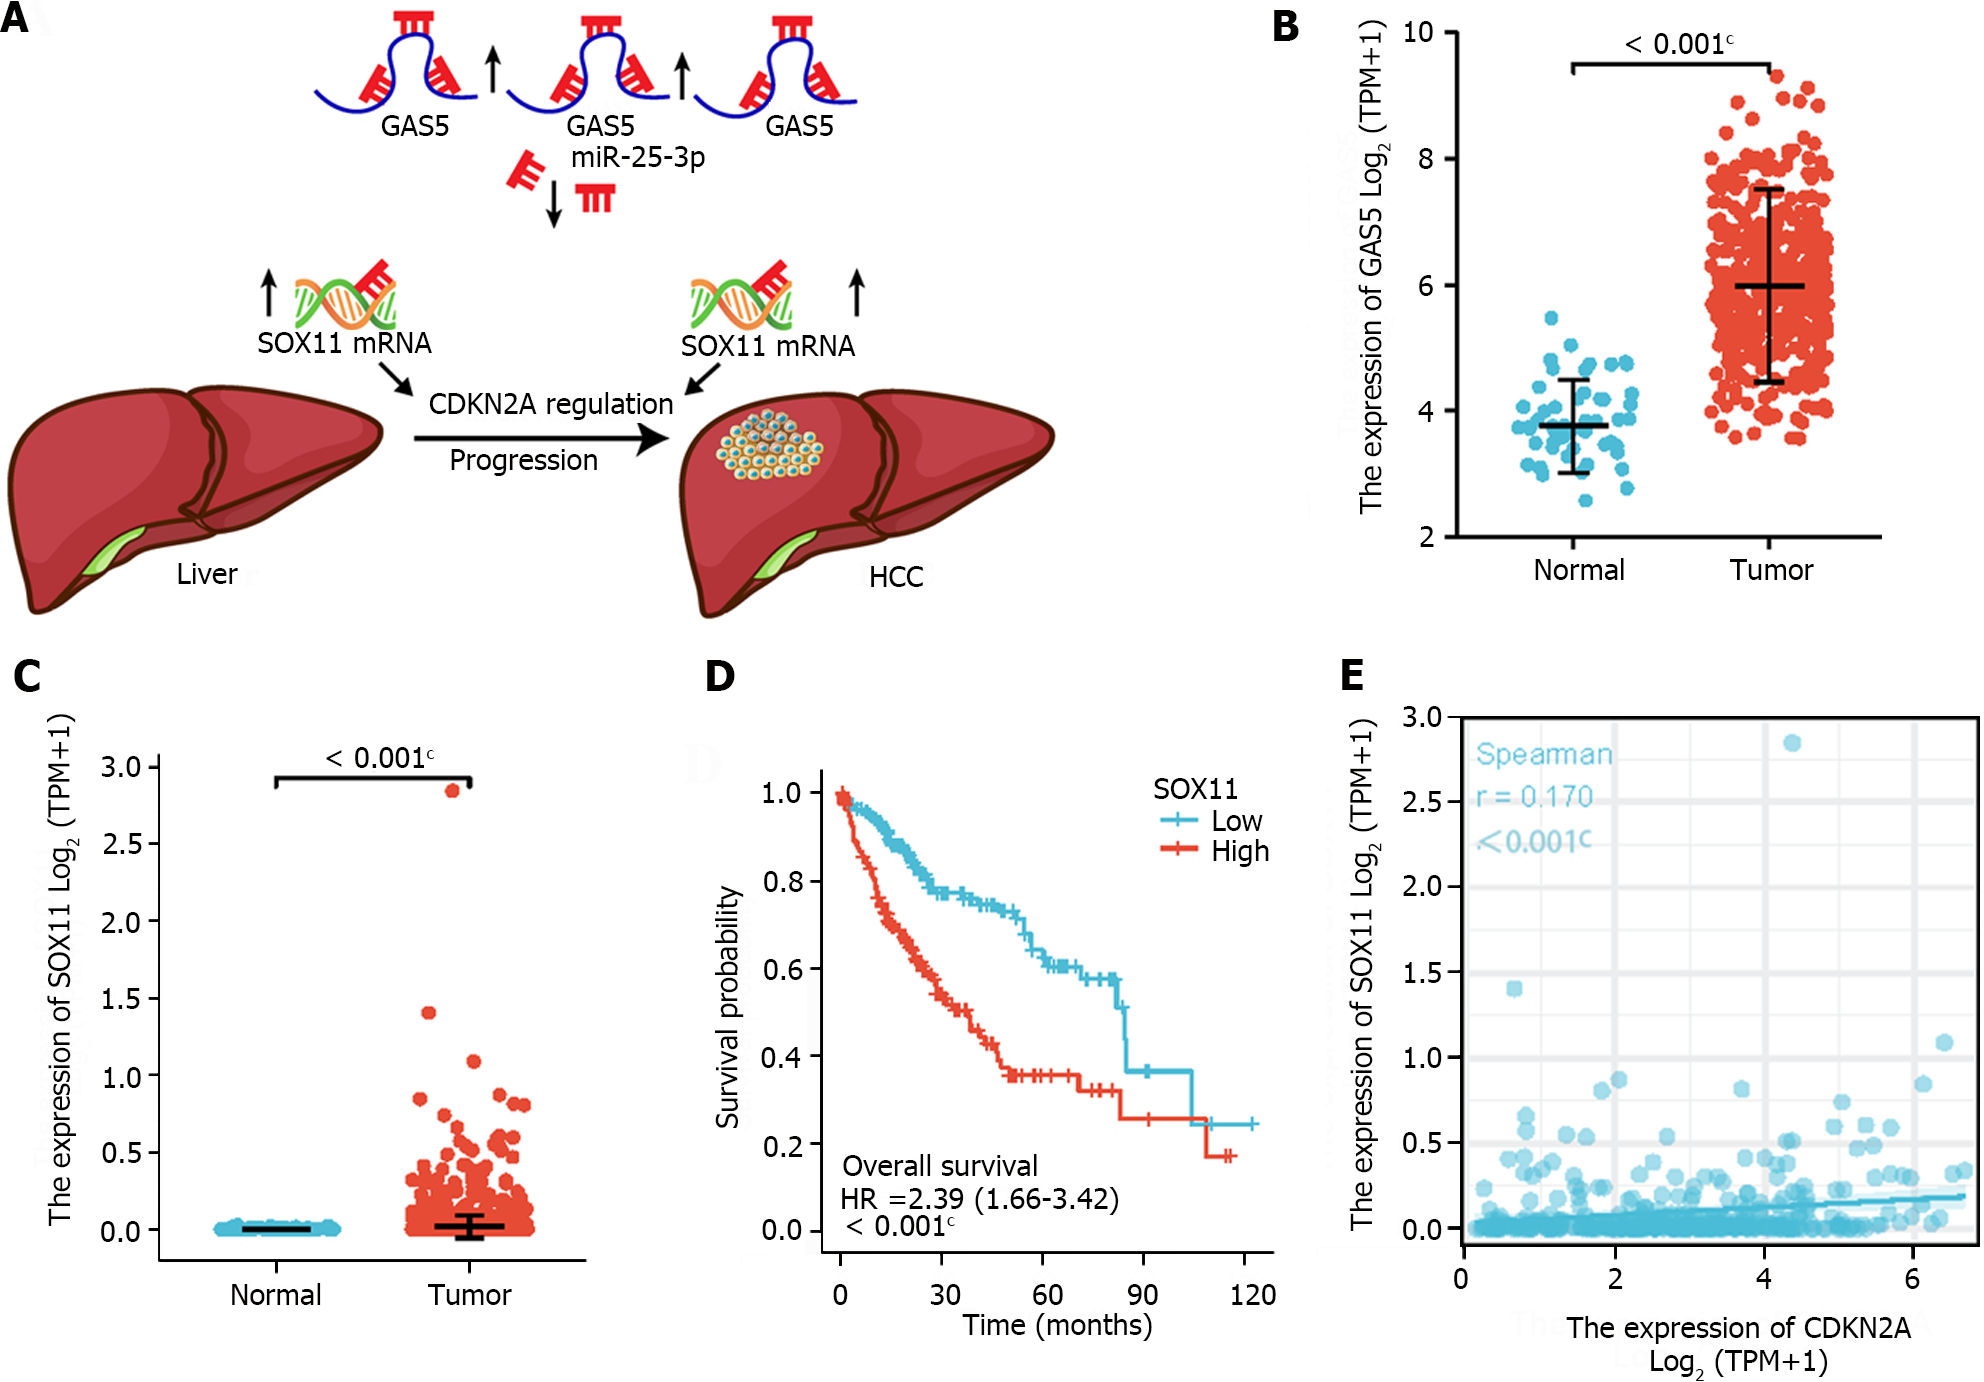
Figure 6 Construction and validation of the competitive endogenous RNA regulatory network.
A: The model of the competitive endogenous RNA axis in the progression of hepatocellular carcinoma (HCC); B: The expression of growth arrest-specific 5 was significantly upregulated in HCC; C: the expression of SRY-box transcription factor 11 (SOX11) was significantly upregulated in HCC; D: Kaplan-Meier curves of SOX11 in patients with HCC in the low and high expression groups; E: Correlation analysis between SOX11 and cyclin dependent kinase inhibitor 2A in HCC. HCC: Hepatocellular carcinoma; CDKN2A: Cyclin dependent kinase inhibitor 2A; GAS5: Growth arrest-specific 5; SOX11: SRY-box transcription factor 11.
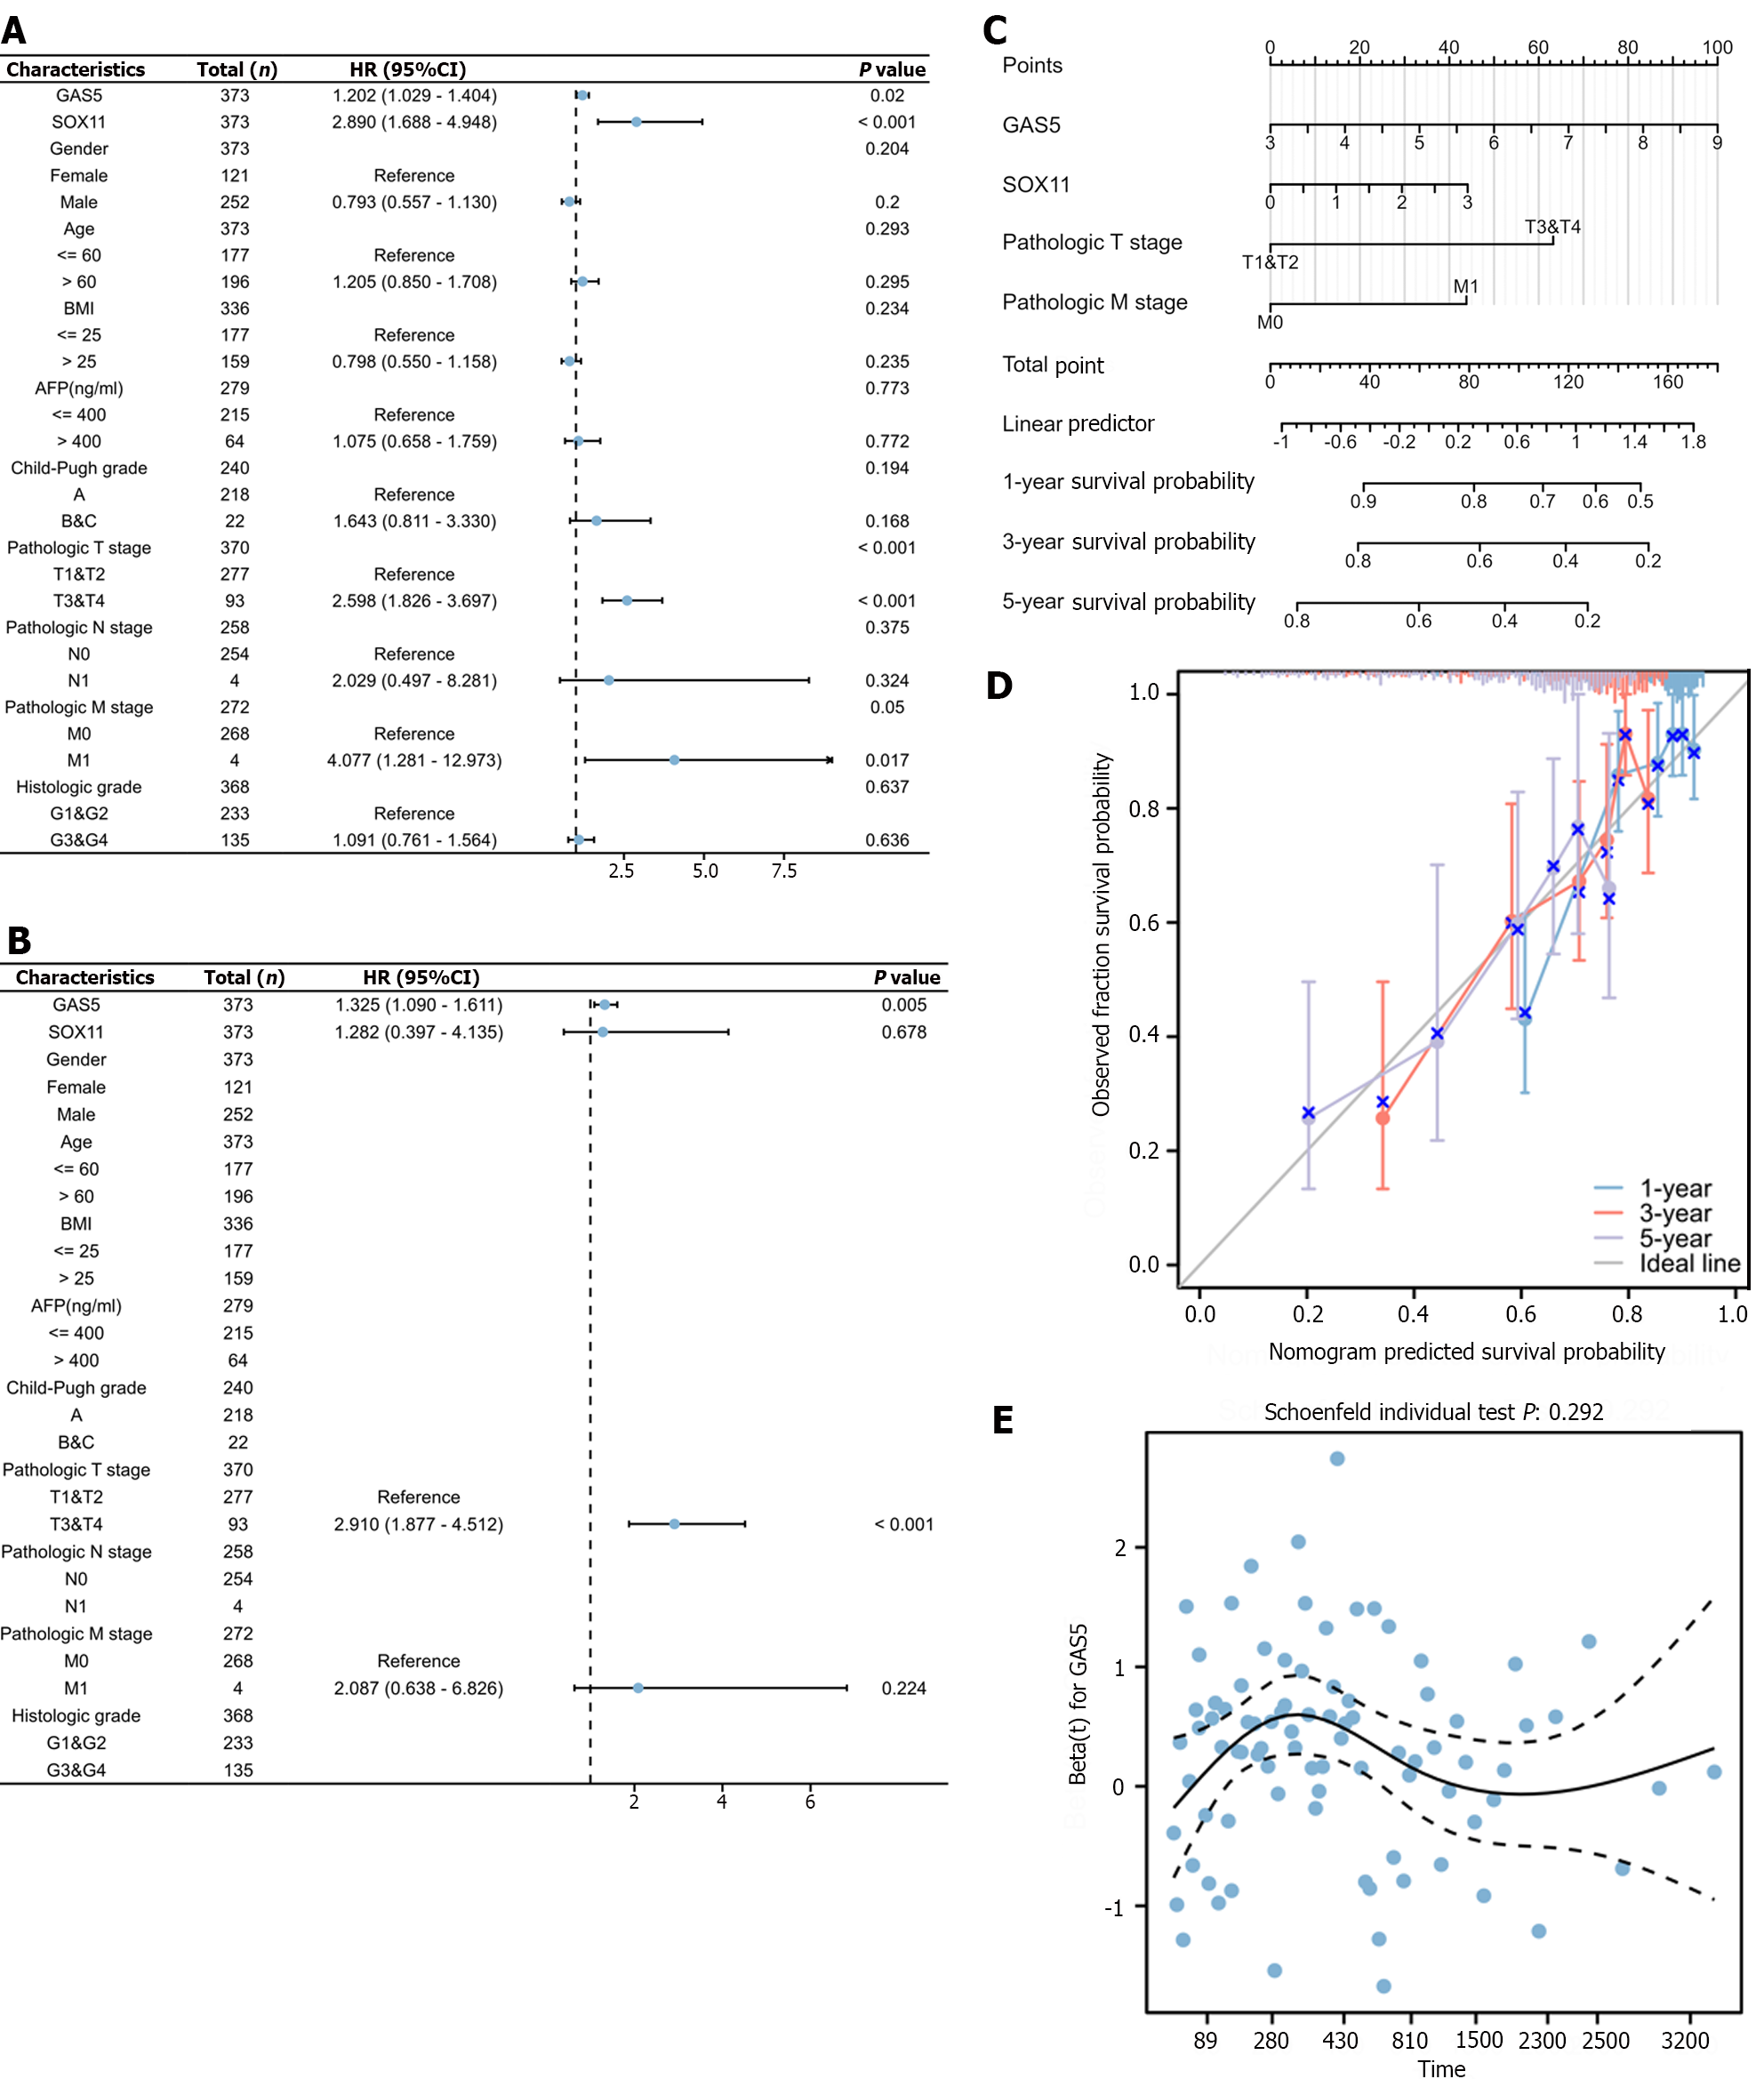
Figure 7 Clinical significance of growth arrest-specific 5 in hepatocellular carcinoma patients.
A and B: Univariate Cox analysis (A) and multivariate Cox analysis (B) of clinical characteristics, growth arrest-specific 5 (GAS5) expression and SRY-box transcription factor 11 (SOX11) expression; C: The predictive nomogram model; D: The corresponding calibration curve; E: The hazard proportional curve of GAS5. 95%CI: 95% confidence interval; HR: Hazard ratio; GAS5: Growth arrest-specific 5; SOX11: SRY-box transcription factor 11.
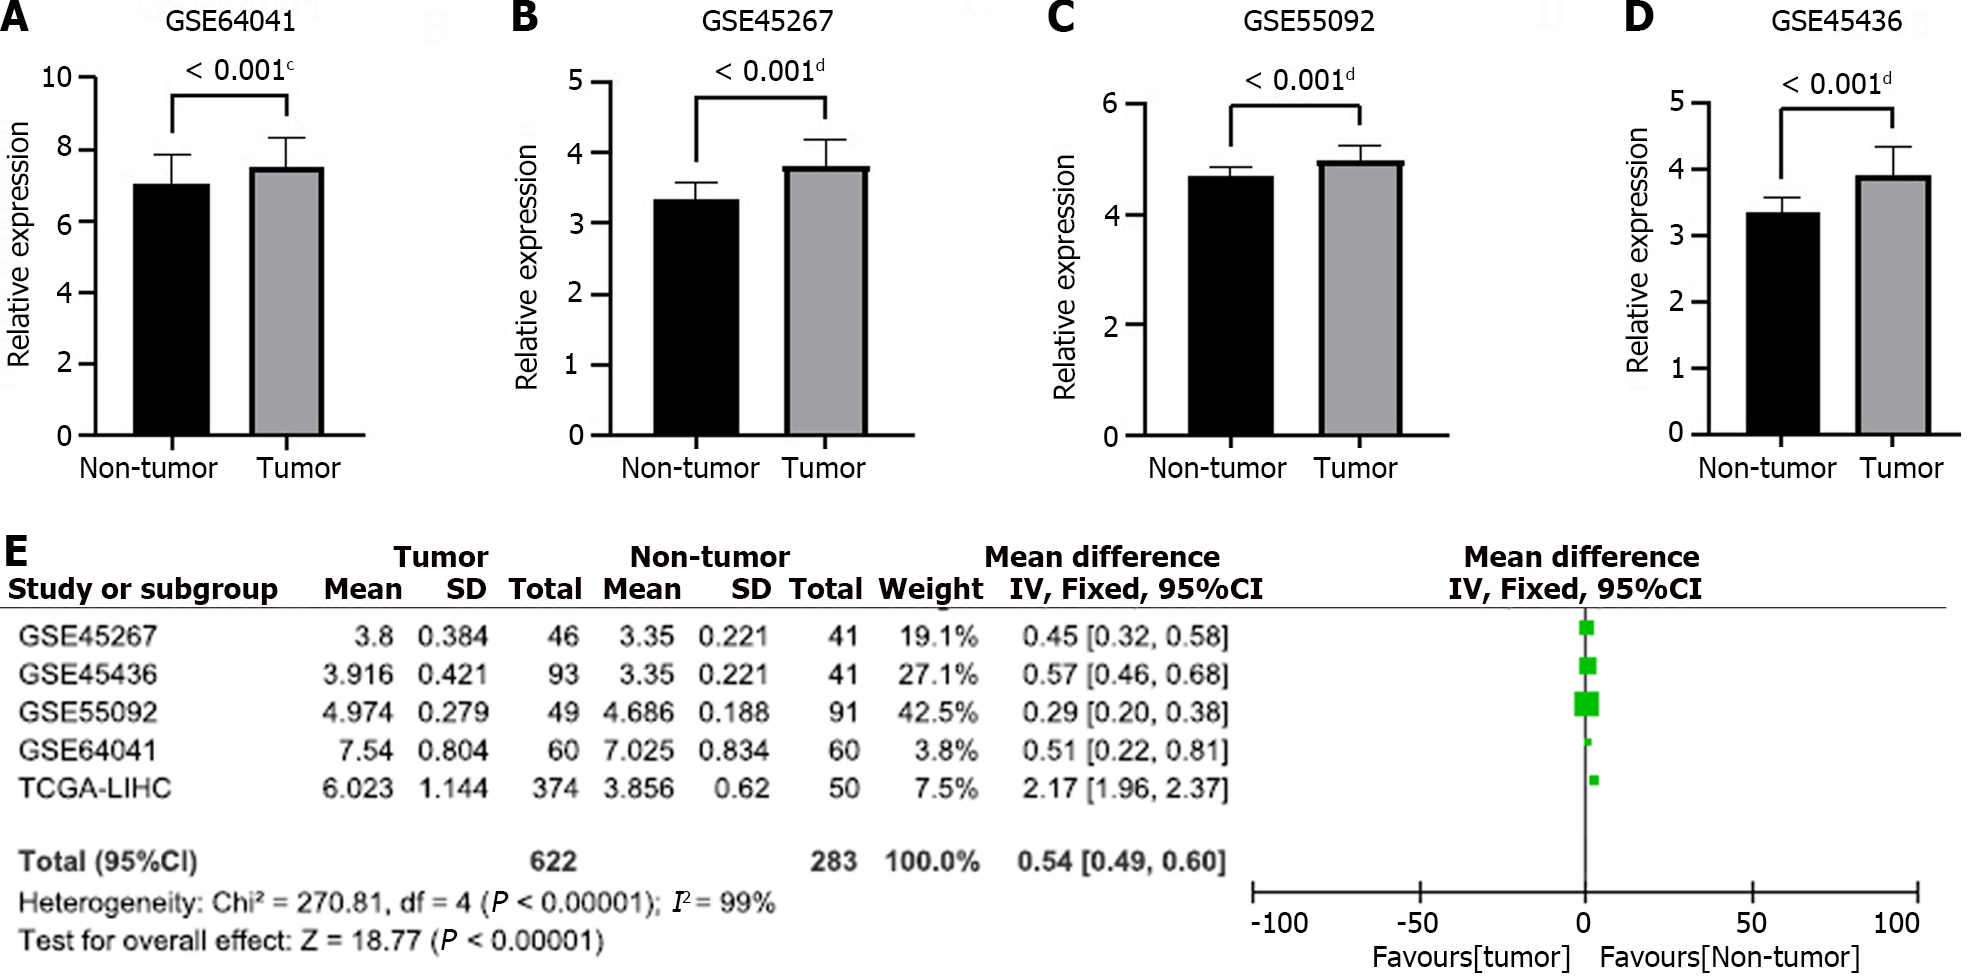
Figure 8 External validation of growth arrest-specific 5 overexpression.
A-E: Differential expression analysis of growth arrest-specific 5 in GSE64041 (A), GSE45267 (B), GSE55092 (C), GSE45436 (D), and meta-analysis outcome (E). aP < 0.05, bP < 0.01, cP < 0.001, dP < 0.0001. 95%CI: 95% confidence interval.
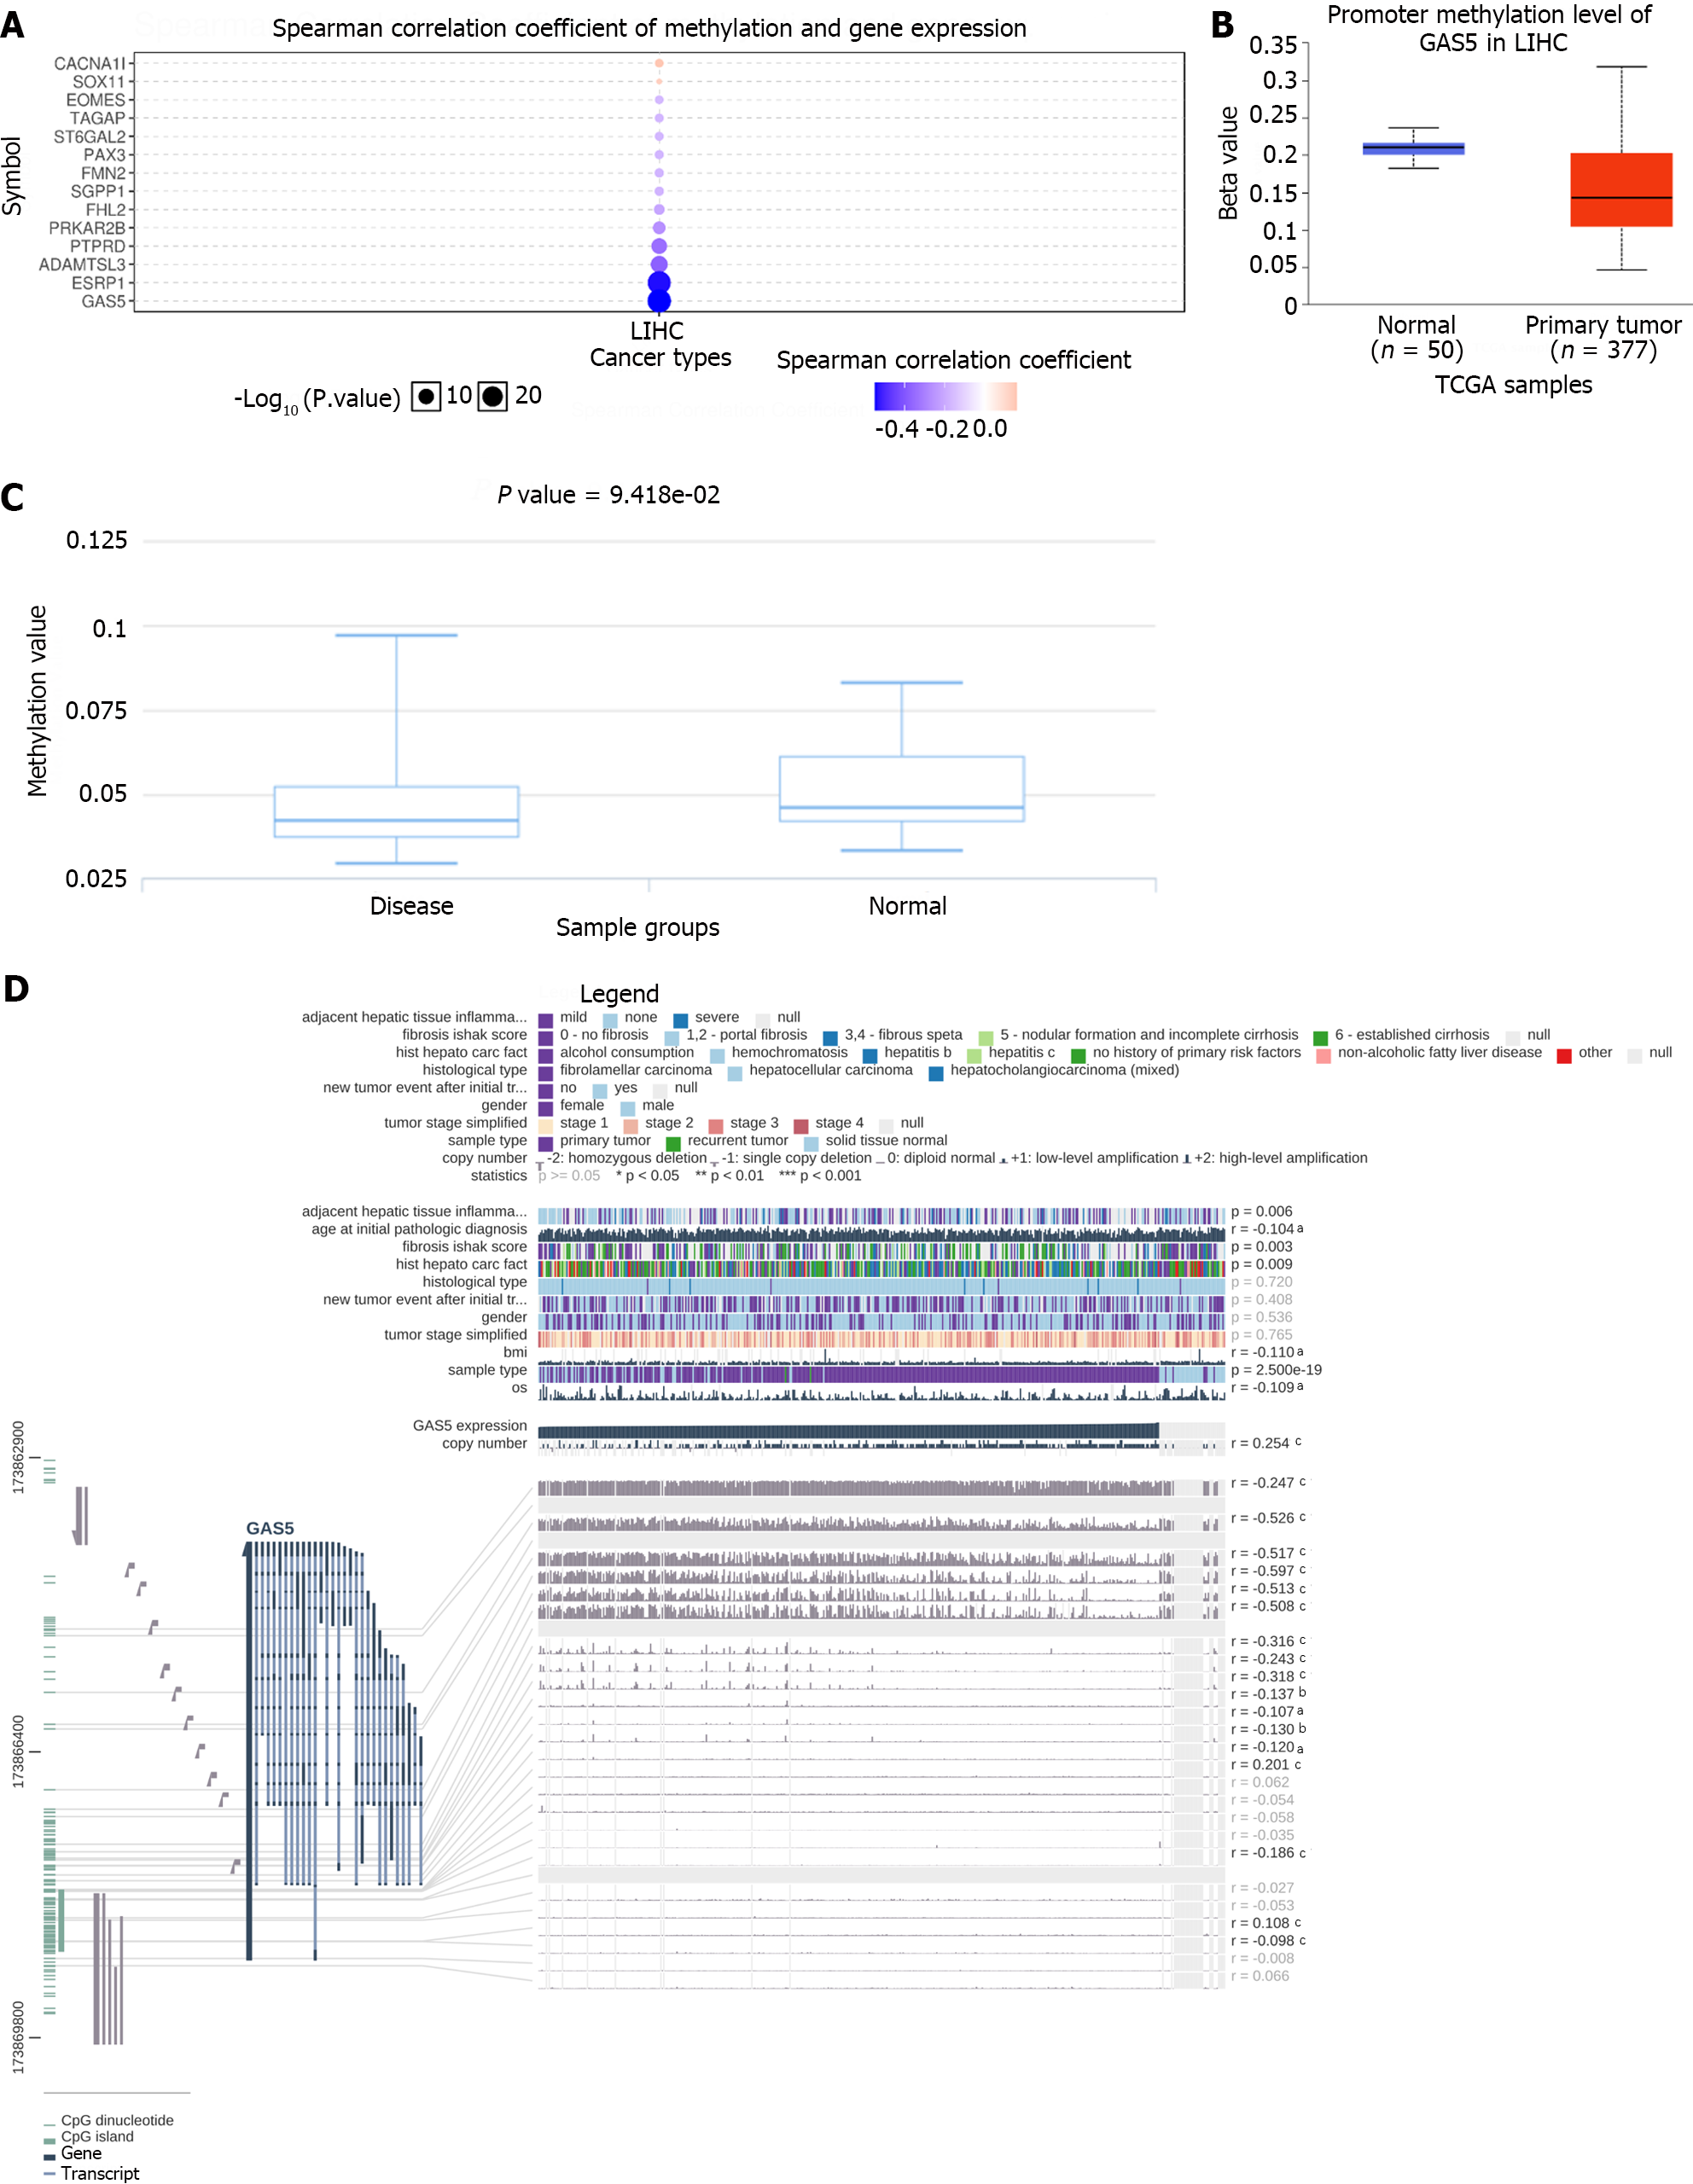
Figure 9 Correlation between methylation and growth arrest-specific 5 expression in hepatocellular carcinoma.
A: Spearman correlation analysis of methylation and expression of growth arrest-specific 5 (GAS5); B: Methylation was evaluated using UALCAN; C: Methylation was assessed using DiseaseMeth version 2.0; D: The methylation site of GAS5 DNA sequence association with gene expression was visualized using MEXPRESS. The expression of GAS5 is illustrated by the blue line in the center of the plot. Pearson’s correlation coefficients and P values for methylation sites and query gene expression are shown on the right side. GAS5: Growth arrest-specific 5.
Figure 10 Correlation analysis of growth arrest-specific 5 expression and immune infiltration in hepatocellular carcinoma.
A: Association between growth arrest-specific 5 (GAS5) gene copy number and immune cell infiltration levels; B: Correlation of GAS5 expression with immune infiltration levels; C-E: Association between GAS5 expression and the expression of PDCD1, CD274, and HAVCR, respectively. aP < 0.05, bP < 0.01, cP < 0.001.
- Citation: Pan Y, Zhang YR, Wang LY, Wu LN, Ma YQ, Fang Z, Li SB. Construction of CDKN2A-related competitive endogenous RNA network and identification of GAS5 as a prognostic indicator for hepatocellular carcinoma. World J Gastrointest Oncol 2024; 16(4): 1514-1531
- URL: https://www.wjgnet.com/1948-5204/full/v16/i4/1514.htm
- DOI: https://dx.doi.org/10.4251/wjgo.v16.i4.1514


