Copyright
©The Author(s) 2024.
World J Gastrointest Oncol. Mar 15, 2024; 16(3): 1029-1045
Published online Mar 15, 2024. doi: 10.4251/wjgo.v16.i3.1029
Published online Mar 15, 2024. doi: 10.4251/wjgo.v16.i3.1029
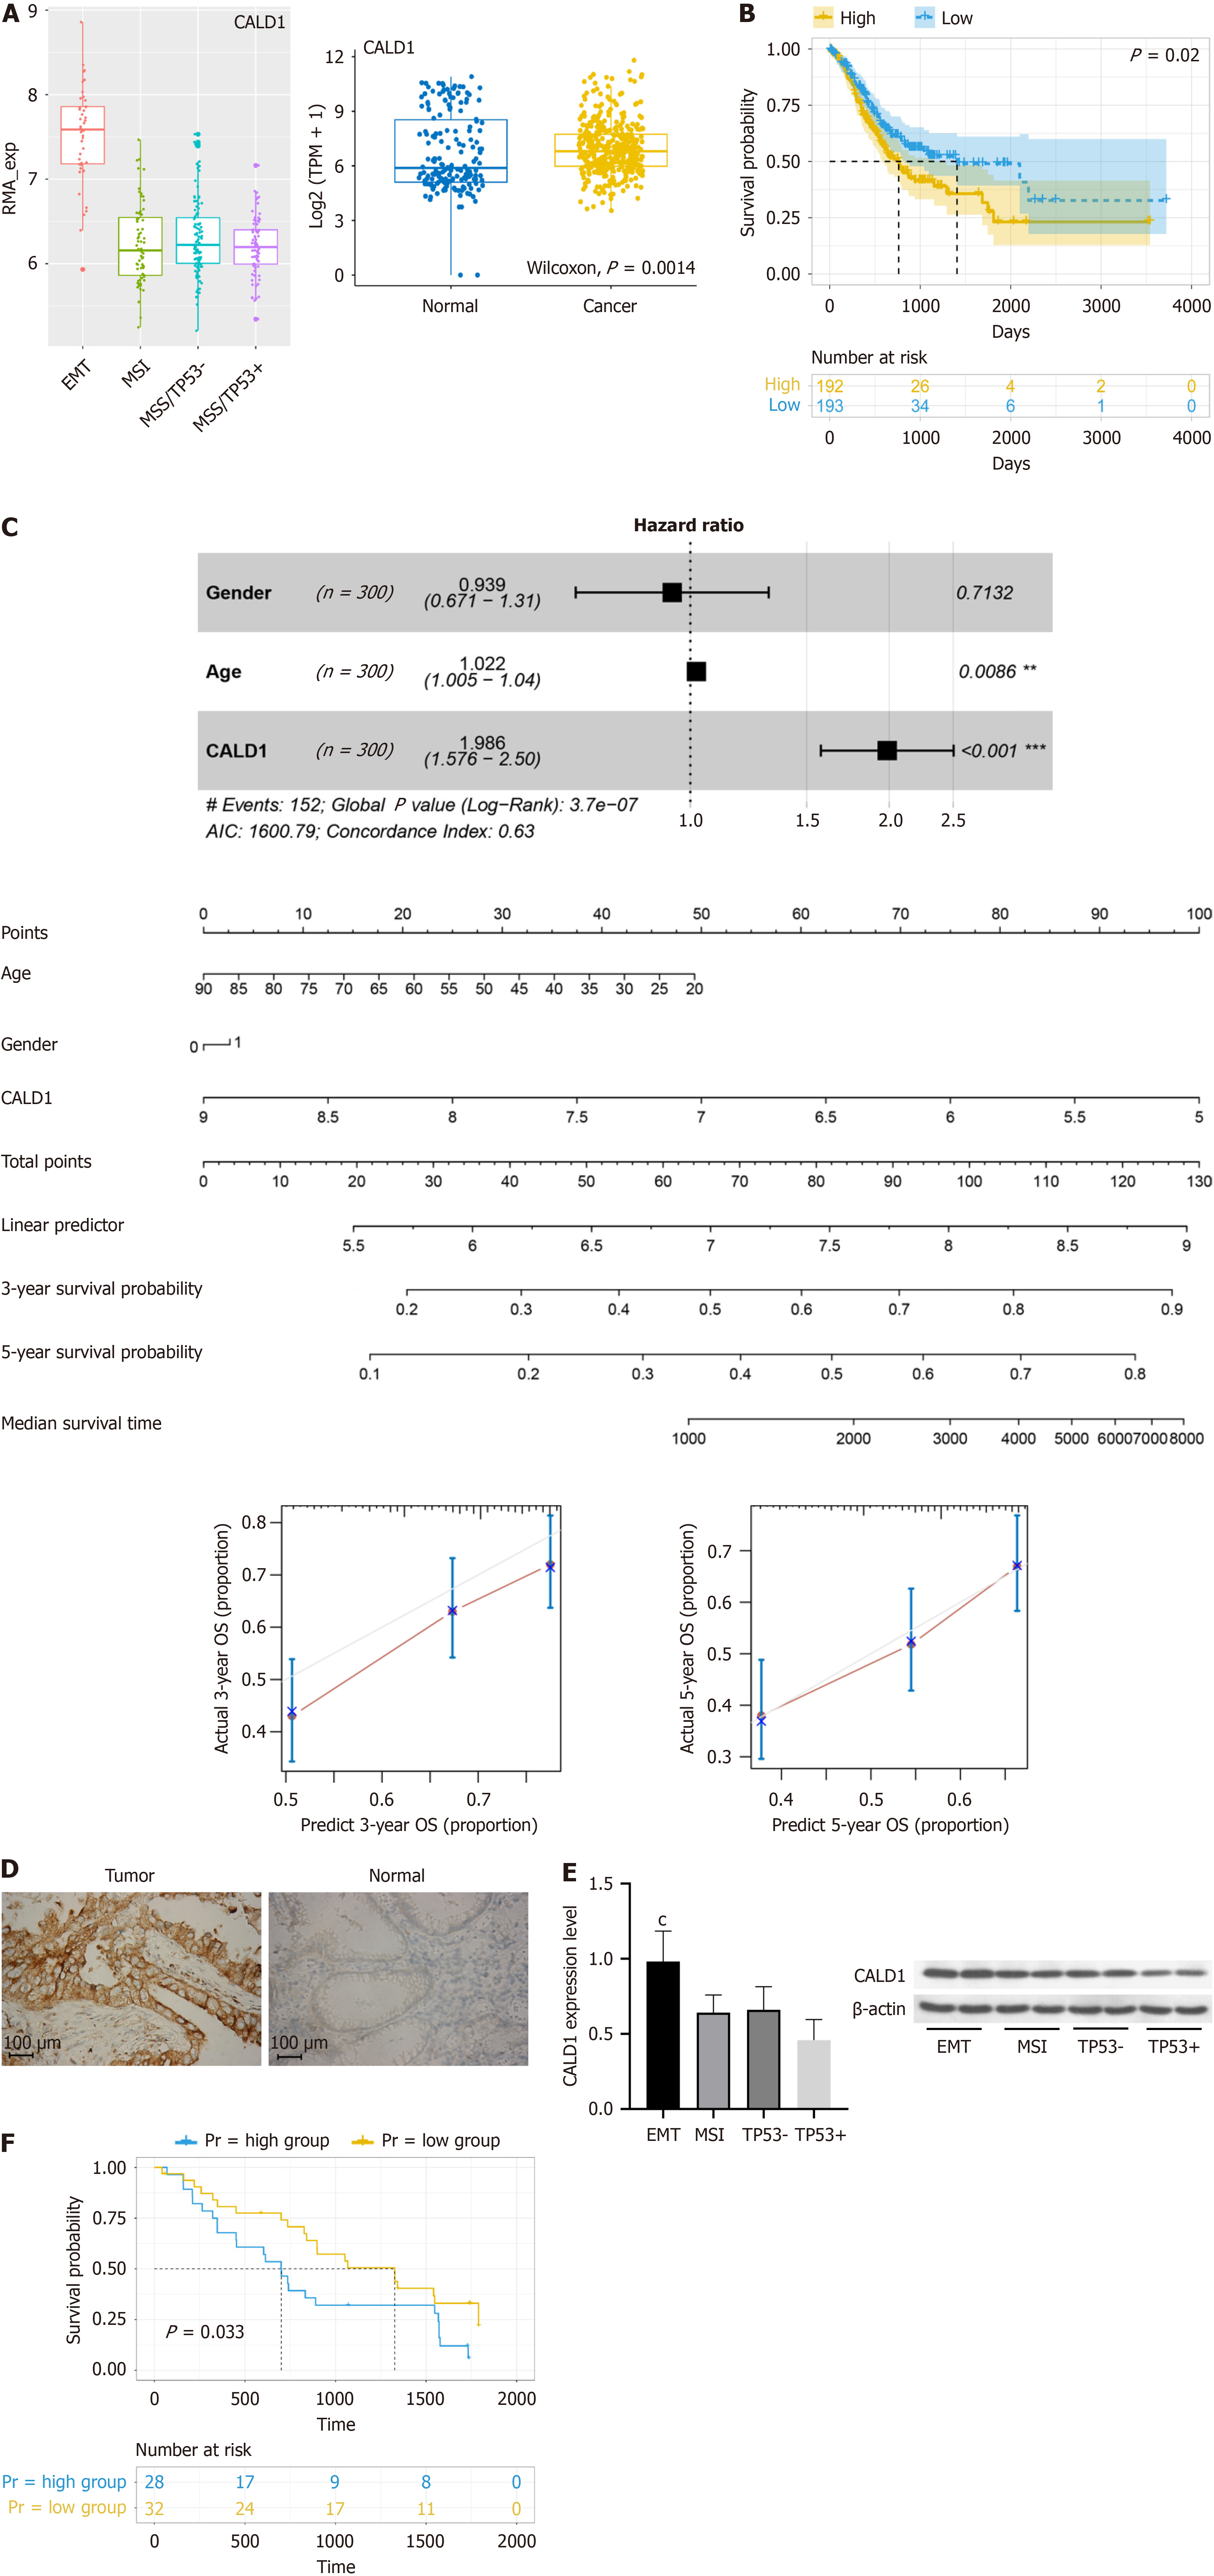
Figure 1 CALD1 overexpression in gastric cancer: Correlation with epithelial-mesenchymal transition type, prognostic implications, and enhanced protein expression in tissues.
A: Bioinformatics results showed that CALD1 was highly expressed in gastric cancer (GC), and CALD1 in GC tissues of epithelial-mesenchymal transition (EMT) type was significantly higher than that in GC tissues of other types; B and C: Patients with high expression of CALD1 had a poorer prognosis than those with low expression, and a prognostic model was constructed and evaluated; D: Validation experiment showed that the protein expression of CALD1 in GC tissues was enhanced compared with that in paracancerous tissues (60 cases); E: CALD1 mRNA (qPCR) and protein (Western blot) in EMT-type GC tissues were significantly higher than those of other types (20 cases); F: Patients with high CALD1 expression had a poorer prognosis than those with low expression (60 cases). cP < 0.001.
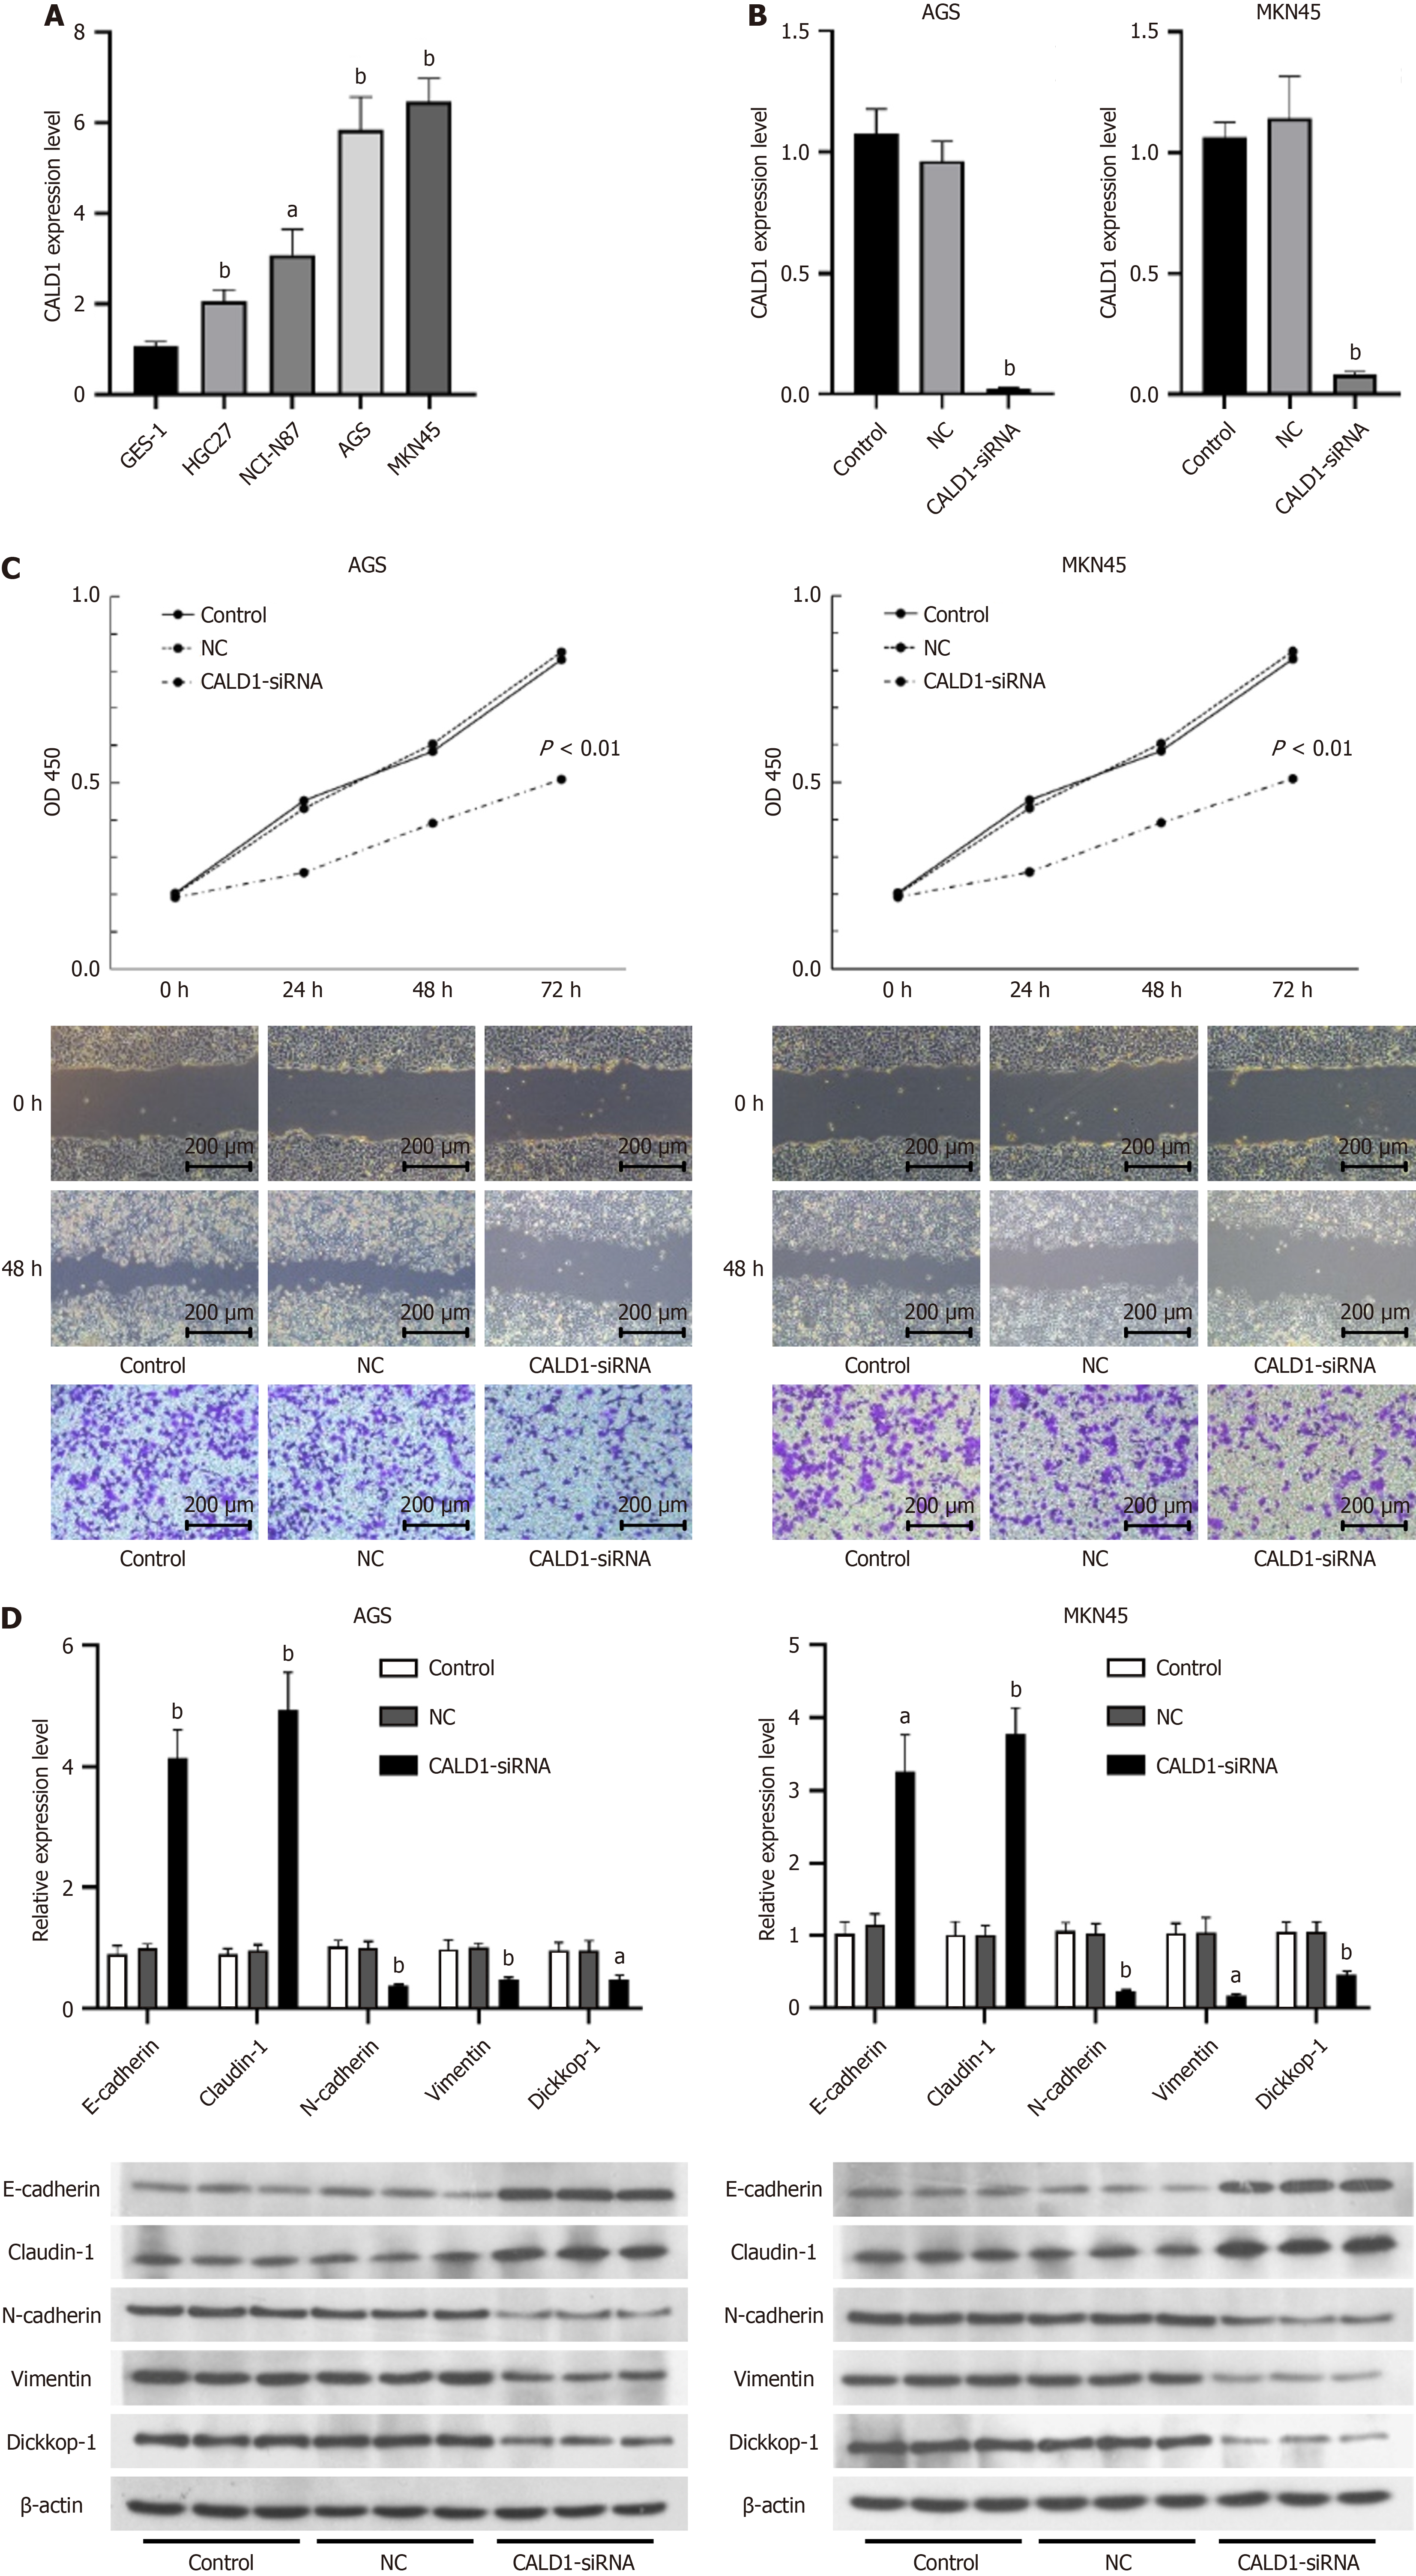
Figure 2 Inhibition of CALD1 in gastric cancer cell lines reduces cell activity, migration, and invasion, and alters epithelial-mesenchymal transition marker expression.
A: CALD1 expression levels were higher in gastric cancer cell lines HGC27, NCI-N87, AGS, and MKN45 than in gastric epithelial cell line GES-1, with the strongest expression found in AGS and MKN45 cells; B: The inhibitory effect of CALD1-siRNA was verified; C: After transfection of AGS and MKN45 cells with CALD1-siRNA, cell activity was significantly reduced, and the migration and invasion ability was decreased; D: The expression of E-cadherin and Claudin-1 was increased in AGS and MKN45 cells after inhibiting the expression of CALD1, while the expression of N-cadherin, Vimentin, and Dickkop-1 mRNA and protein was decreased. aP < 0.05, bP < 0.01.
Figure 3 CALD1 gene is associated with PI3K-Akt-mTOR and epithelial-mesenchymal transition pathways in gastric cancer: Insights from bioinformatics and protein interaction studies.
A: Bioinformatics results showed that the CALD1 gene was significantly associated with the expression of members in the PI3K-Akt-mTOR signaling pathway as well as the epithelial-mesenchymal transition signaling pathway in gastric cancer; B: PPI network analysis of CALD1 showed that it interacts with a variety of proteins; C: GO and KEGG enrichment analyses showed that CALD1 was closely associated with the PI3K-Akt signaling pathway; D: In-depth analysis revealed that CALD1 was highly expressed in fibroblasts and was significantly positively correlated with the expression of fibroblast surface molecules.
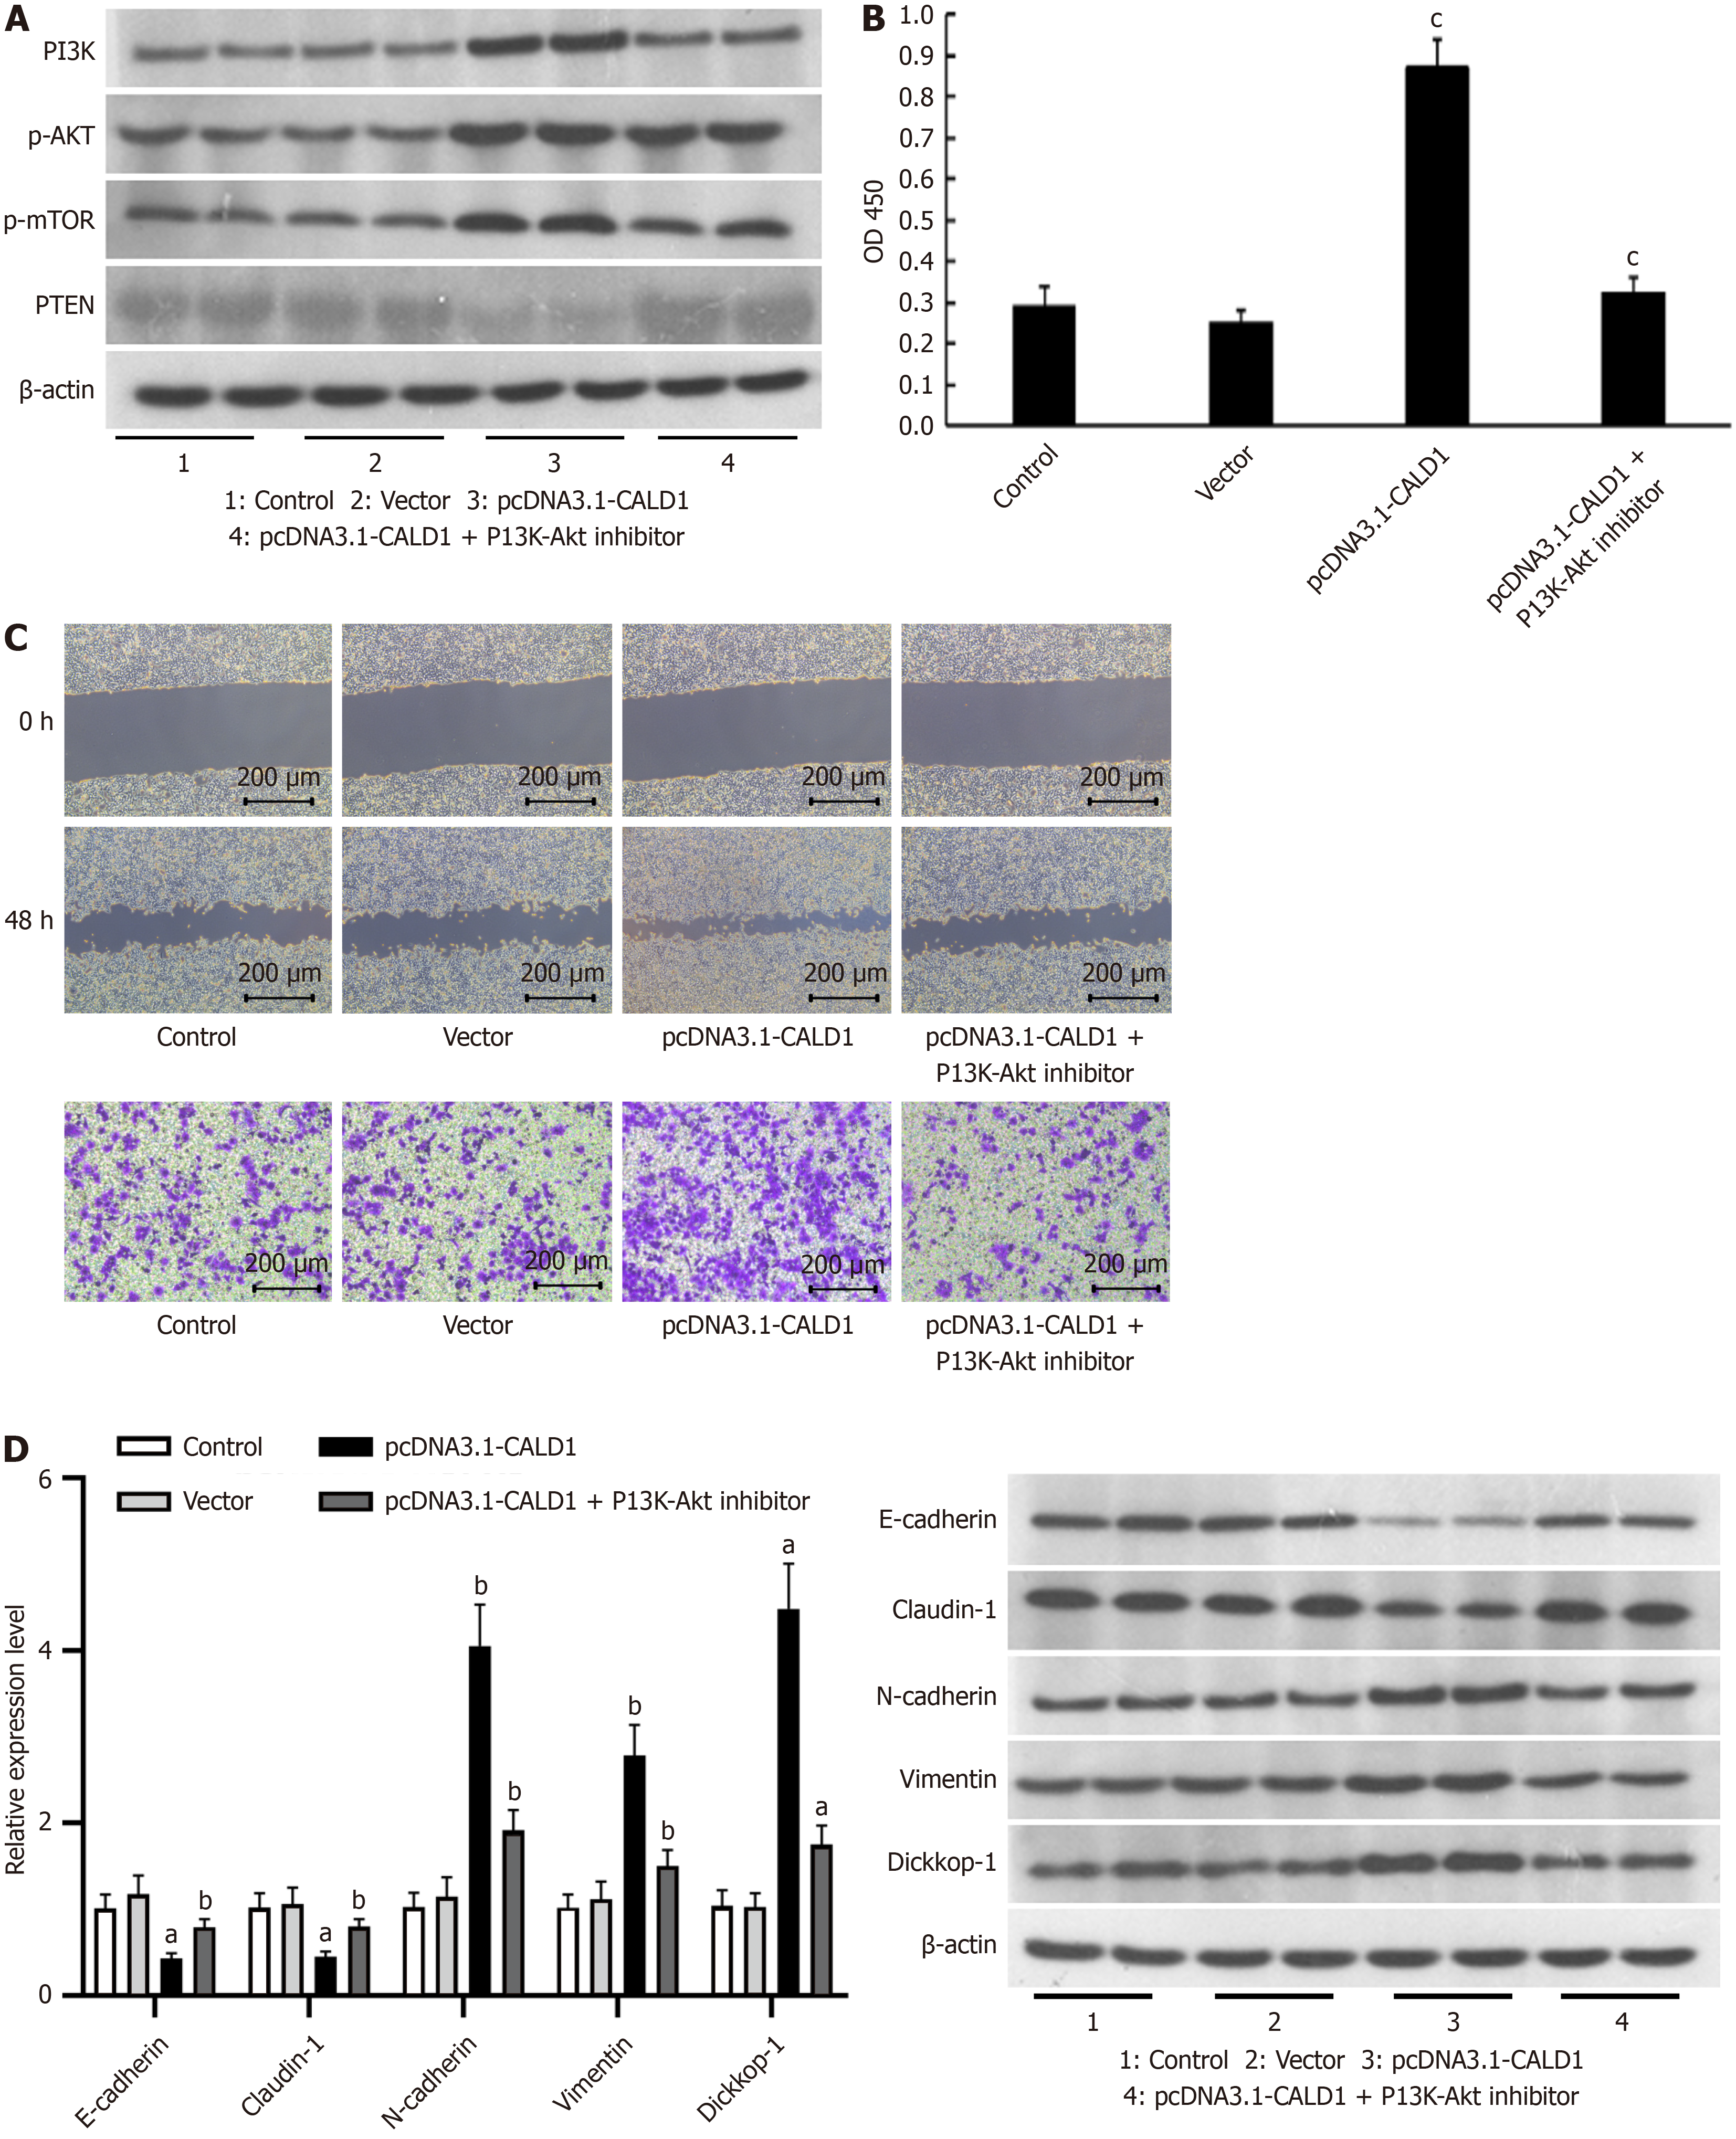
Figure 4 Effects of CALD1 modulation and PI3K-Akt inhibition on tumor cell activity, migration, and EMT-related gene expression.
A: Up-regulation of CALD1 enhanced the expression of PI3K, p-AKT, and p-mTOR, members of the PI3K-Akt pathway, whereas PTEN expression was weakened; the addition of a PI3K-Akt inhibitor attenuated the expression of PI3K, p-AKT, and p-mTOR, while the expression of PTEN was enhanced; B: CCK-8 results showed that showed that the effect of CALD1 on tumour cell activity was weakened after adding a PI3K-Akt inhibitor (blank group-moderate activity, negative group-moderate activity, CALD1 overexpression group-high activity, CALD1 overexpression + inhibitor group-moderate activity or slightly high activity); C: Scratch and Transwell assay results showed that the effect of CALD1 on tumour cell migration and invasion was weakened after adding a PI3K-Akt inhibitor (blank group-moderate, negative group-moderate, CALD1 overexpression group-strong, CALD1 overexpression + inhibitor group-moderate or slightly strong); D: CALD1 overexpression, alone or in combination with PI3K-Akt inhibition, resulted in corresponding changes in EMT-related genes and proteins in AGS and MKN45 cells. aP < 0.05, bP < 0.01, cP < 0.001.
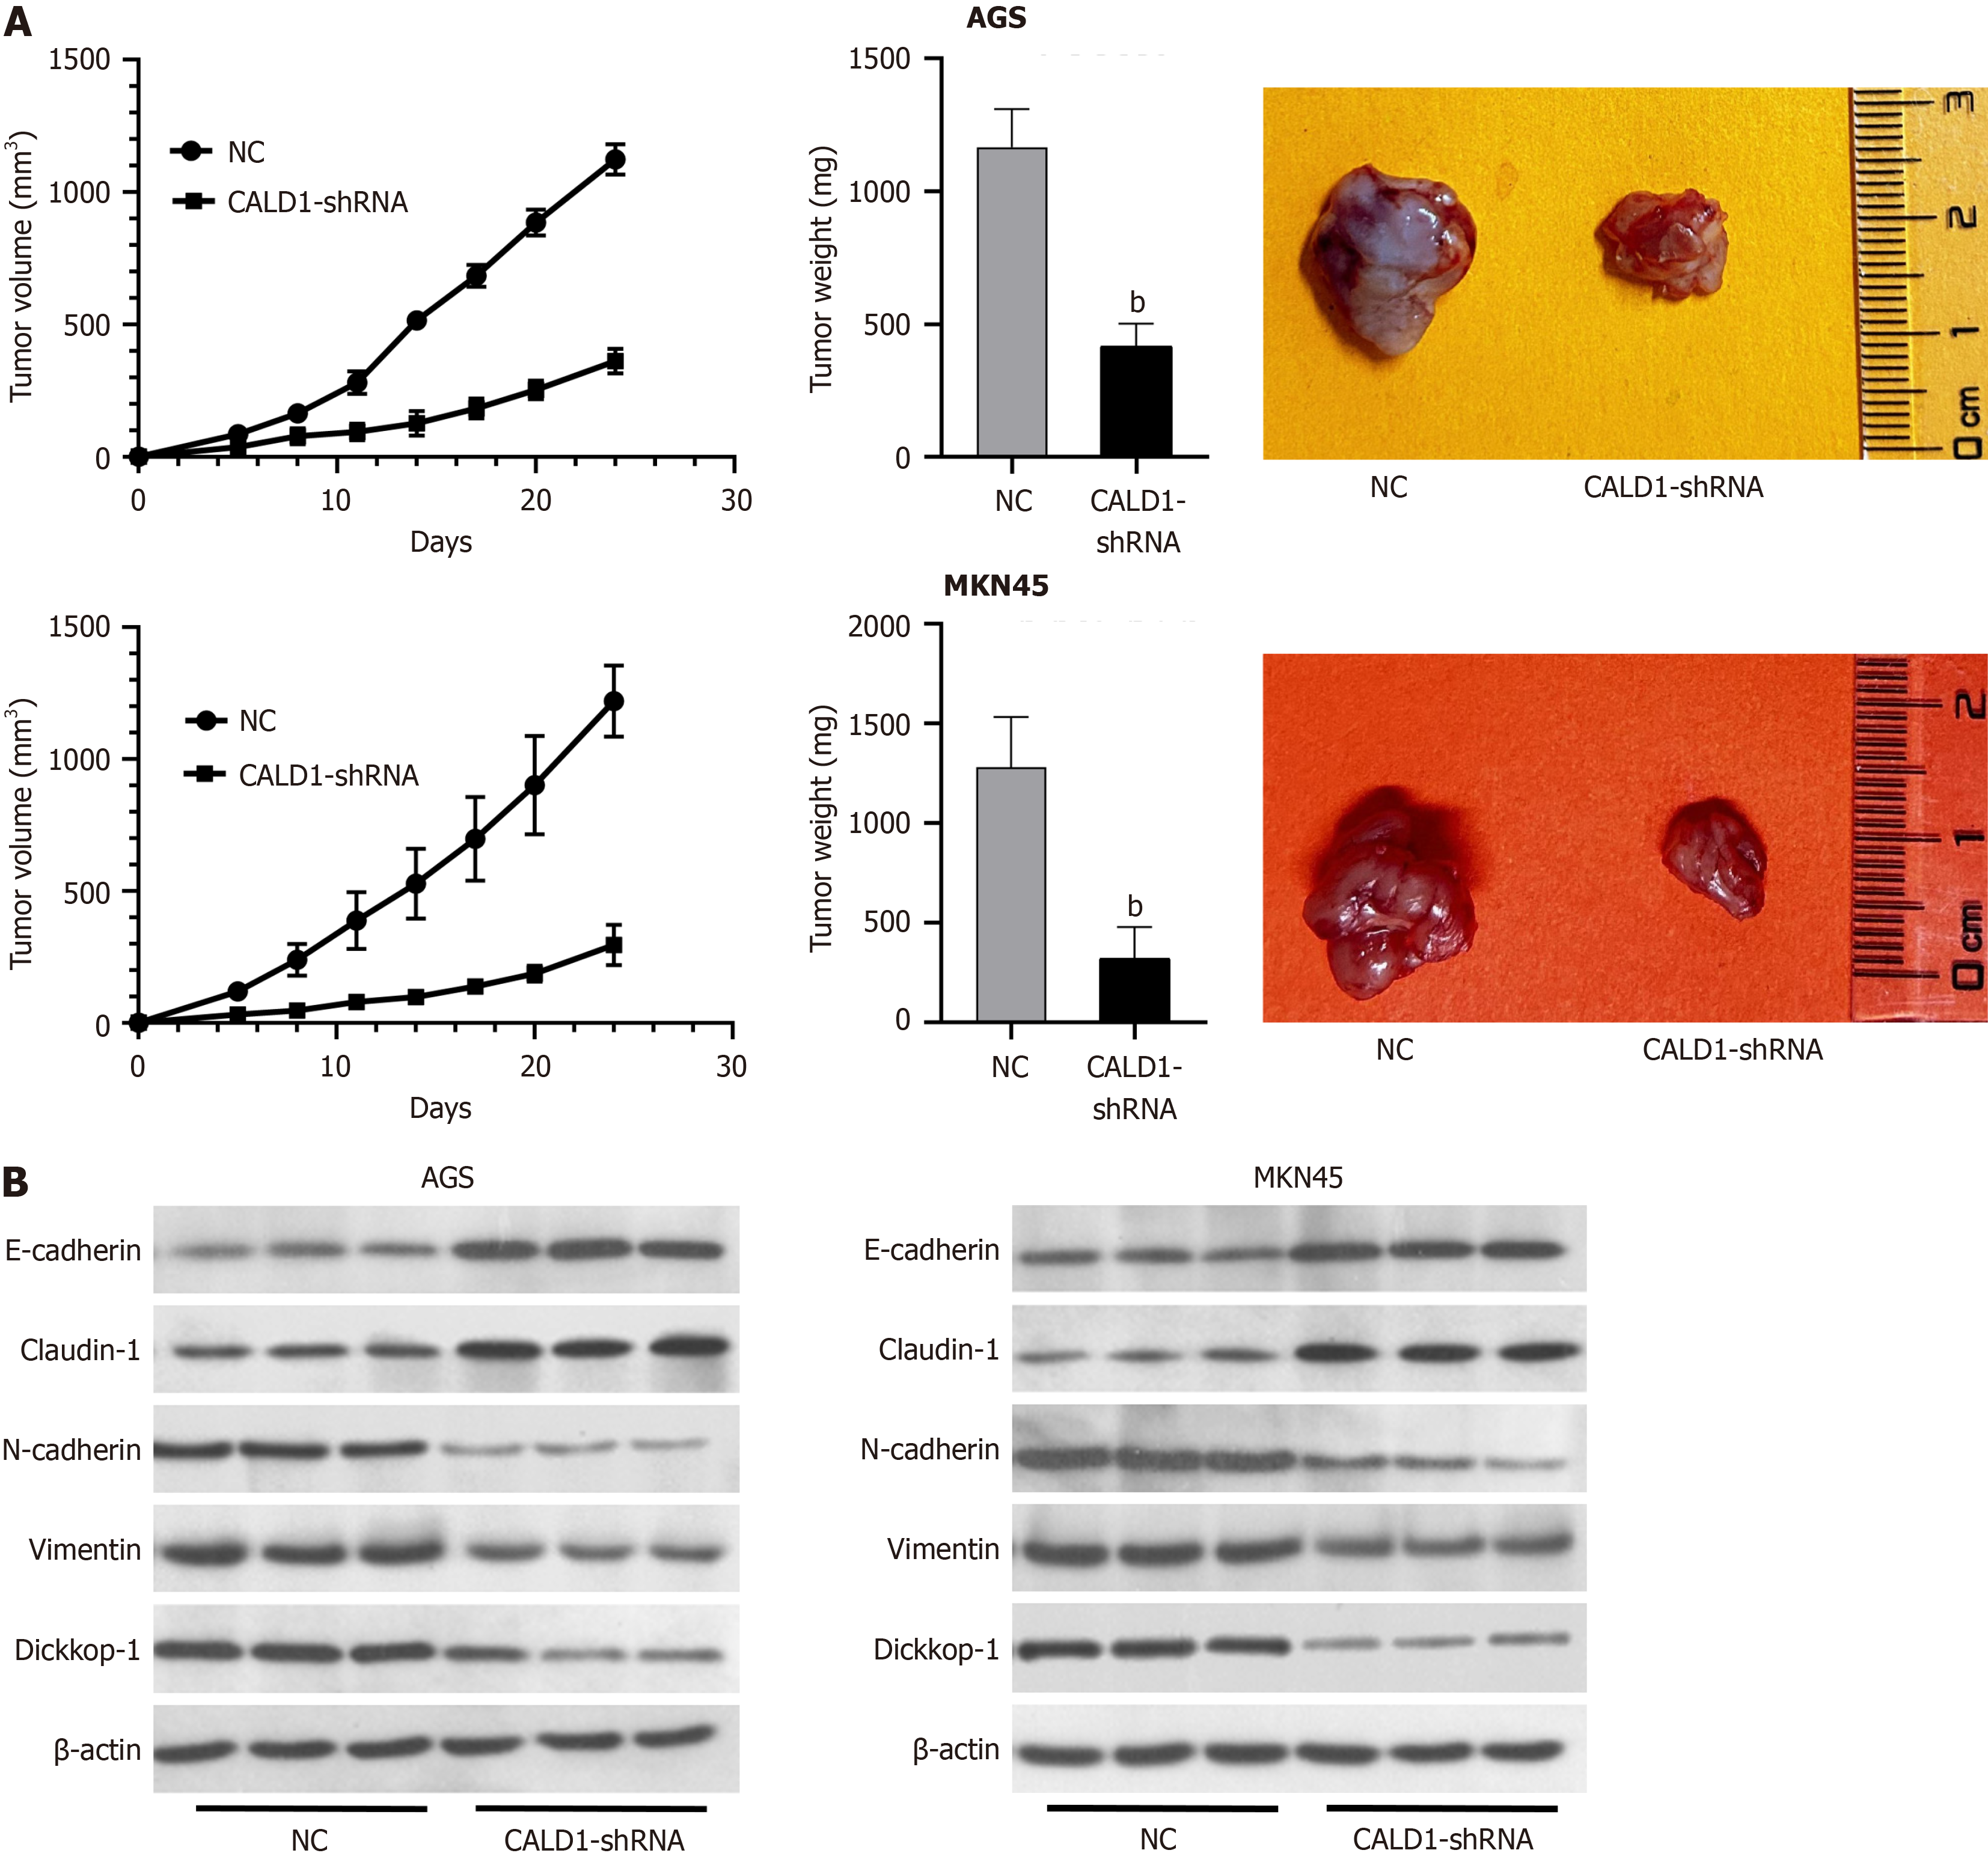
Figure 5 Impact of CALD1-shRNA on tumor growth and metastasis-related protein expression: Results from animal experiments.
A: The mean weight of transplanted tumours in the CALD1-shRNA-transfected group was significantly lower than that in the empty vector-transfected group (P < 0.05), with a delayed growth curve and smaller final subcutaneous tumours; B: Compared with the empty vector-transfected group, the expression of N-cadherin, Dickkop-1, and Vimentin was reduced, whereas that of Claudin-1 and E-cadherin expression increased. bP < 0.01.
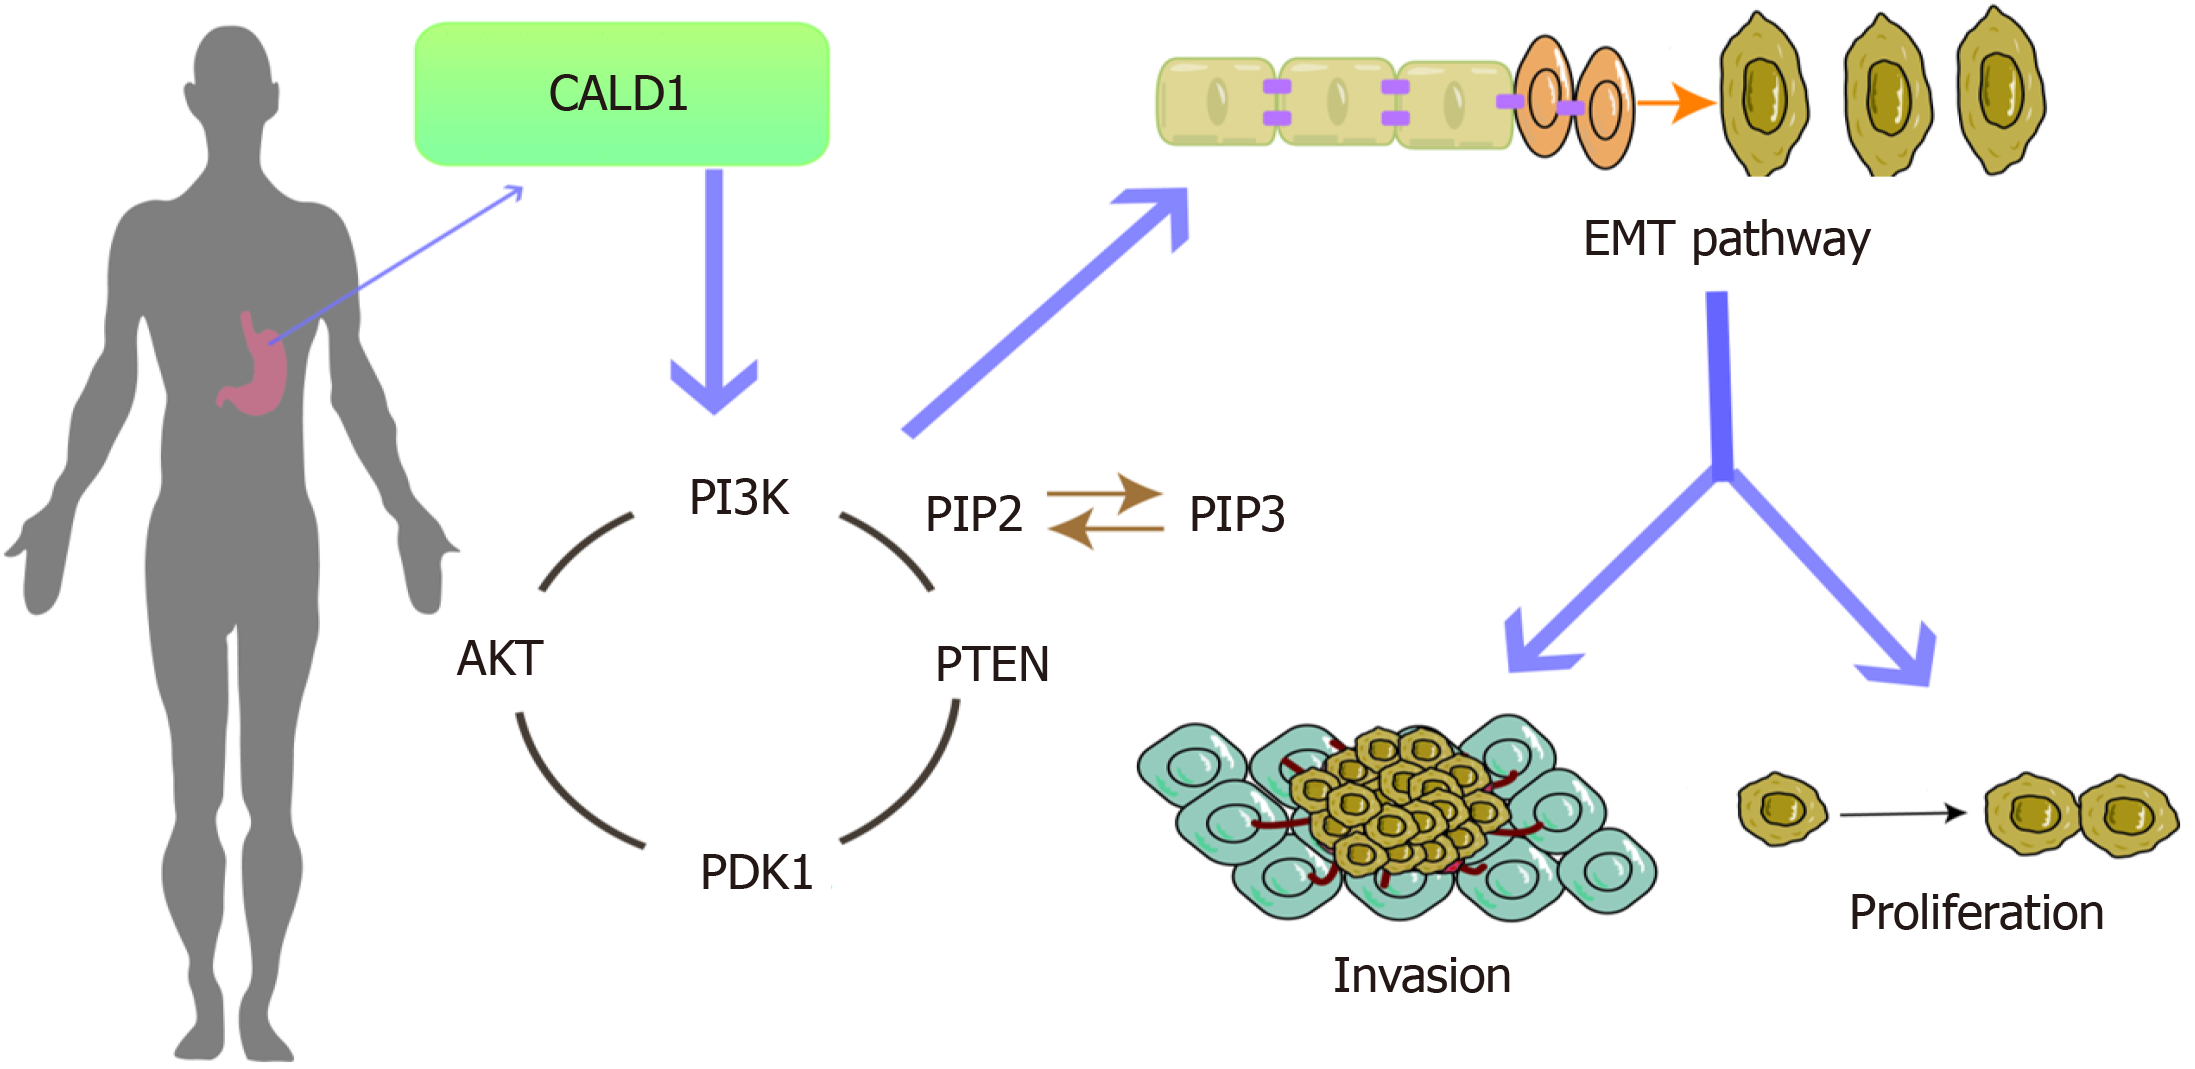
Figure 6 Pathway diagram.
- Citation: Ma WQ, Miao MC, Ding PA, Tan BB, Liu WB, Guo S, Er LM, Zhang ZD, Zhao Q. CALD1 facilitates epithelial-mesenchymal transition progression in gastric cancer cells by modulating the PI3K-Akt pathway. World J Gastrointest Oncol 2024; 16(3): 1029-1045
- URL: https://www.wjgnet.com/1948-5204/full/v16/i3/1029.htm
- DOI: https://dx.doi.org/10.4251/wjgo.v16.i3.1029


