Copyright
©The Author(s) 2024.
World J Gastrointest Oncol. Feb 15, 2024; 16(2): 475-492
Published online Feb 15, 2024. doi: 10.4251/wjgo.v16.i2.475
Published online Feb 15, 2024. doi: 10.4251/wjgo.v16.i2.475
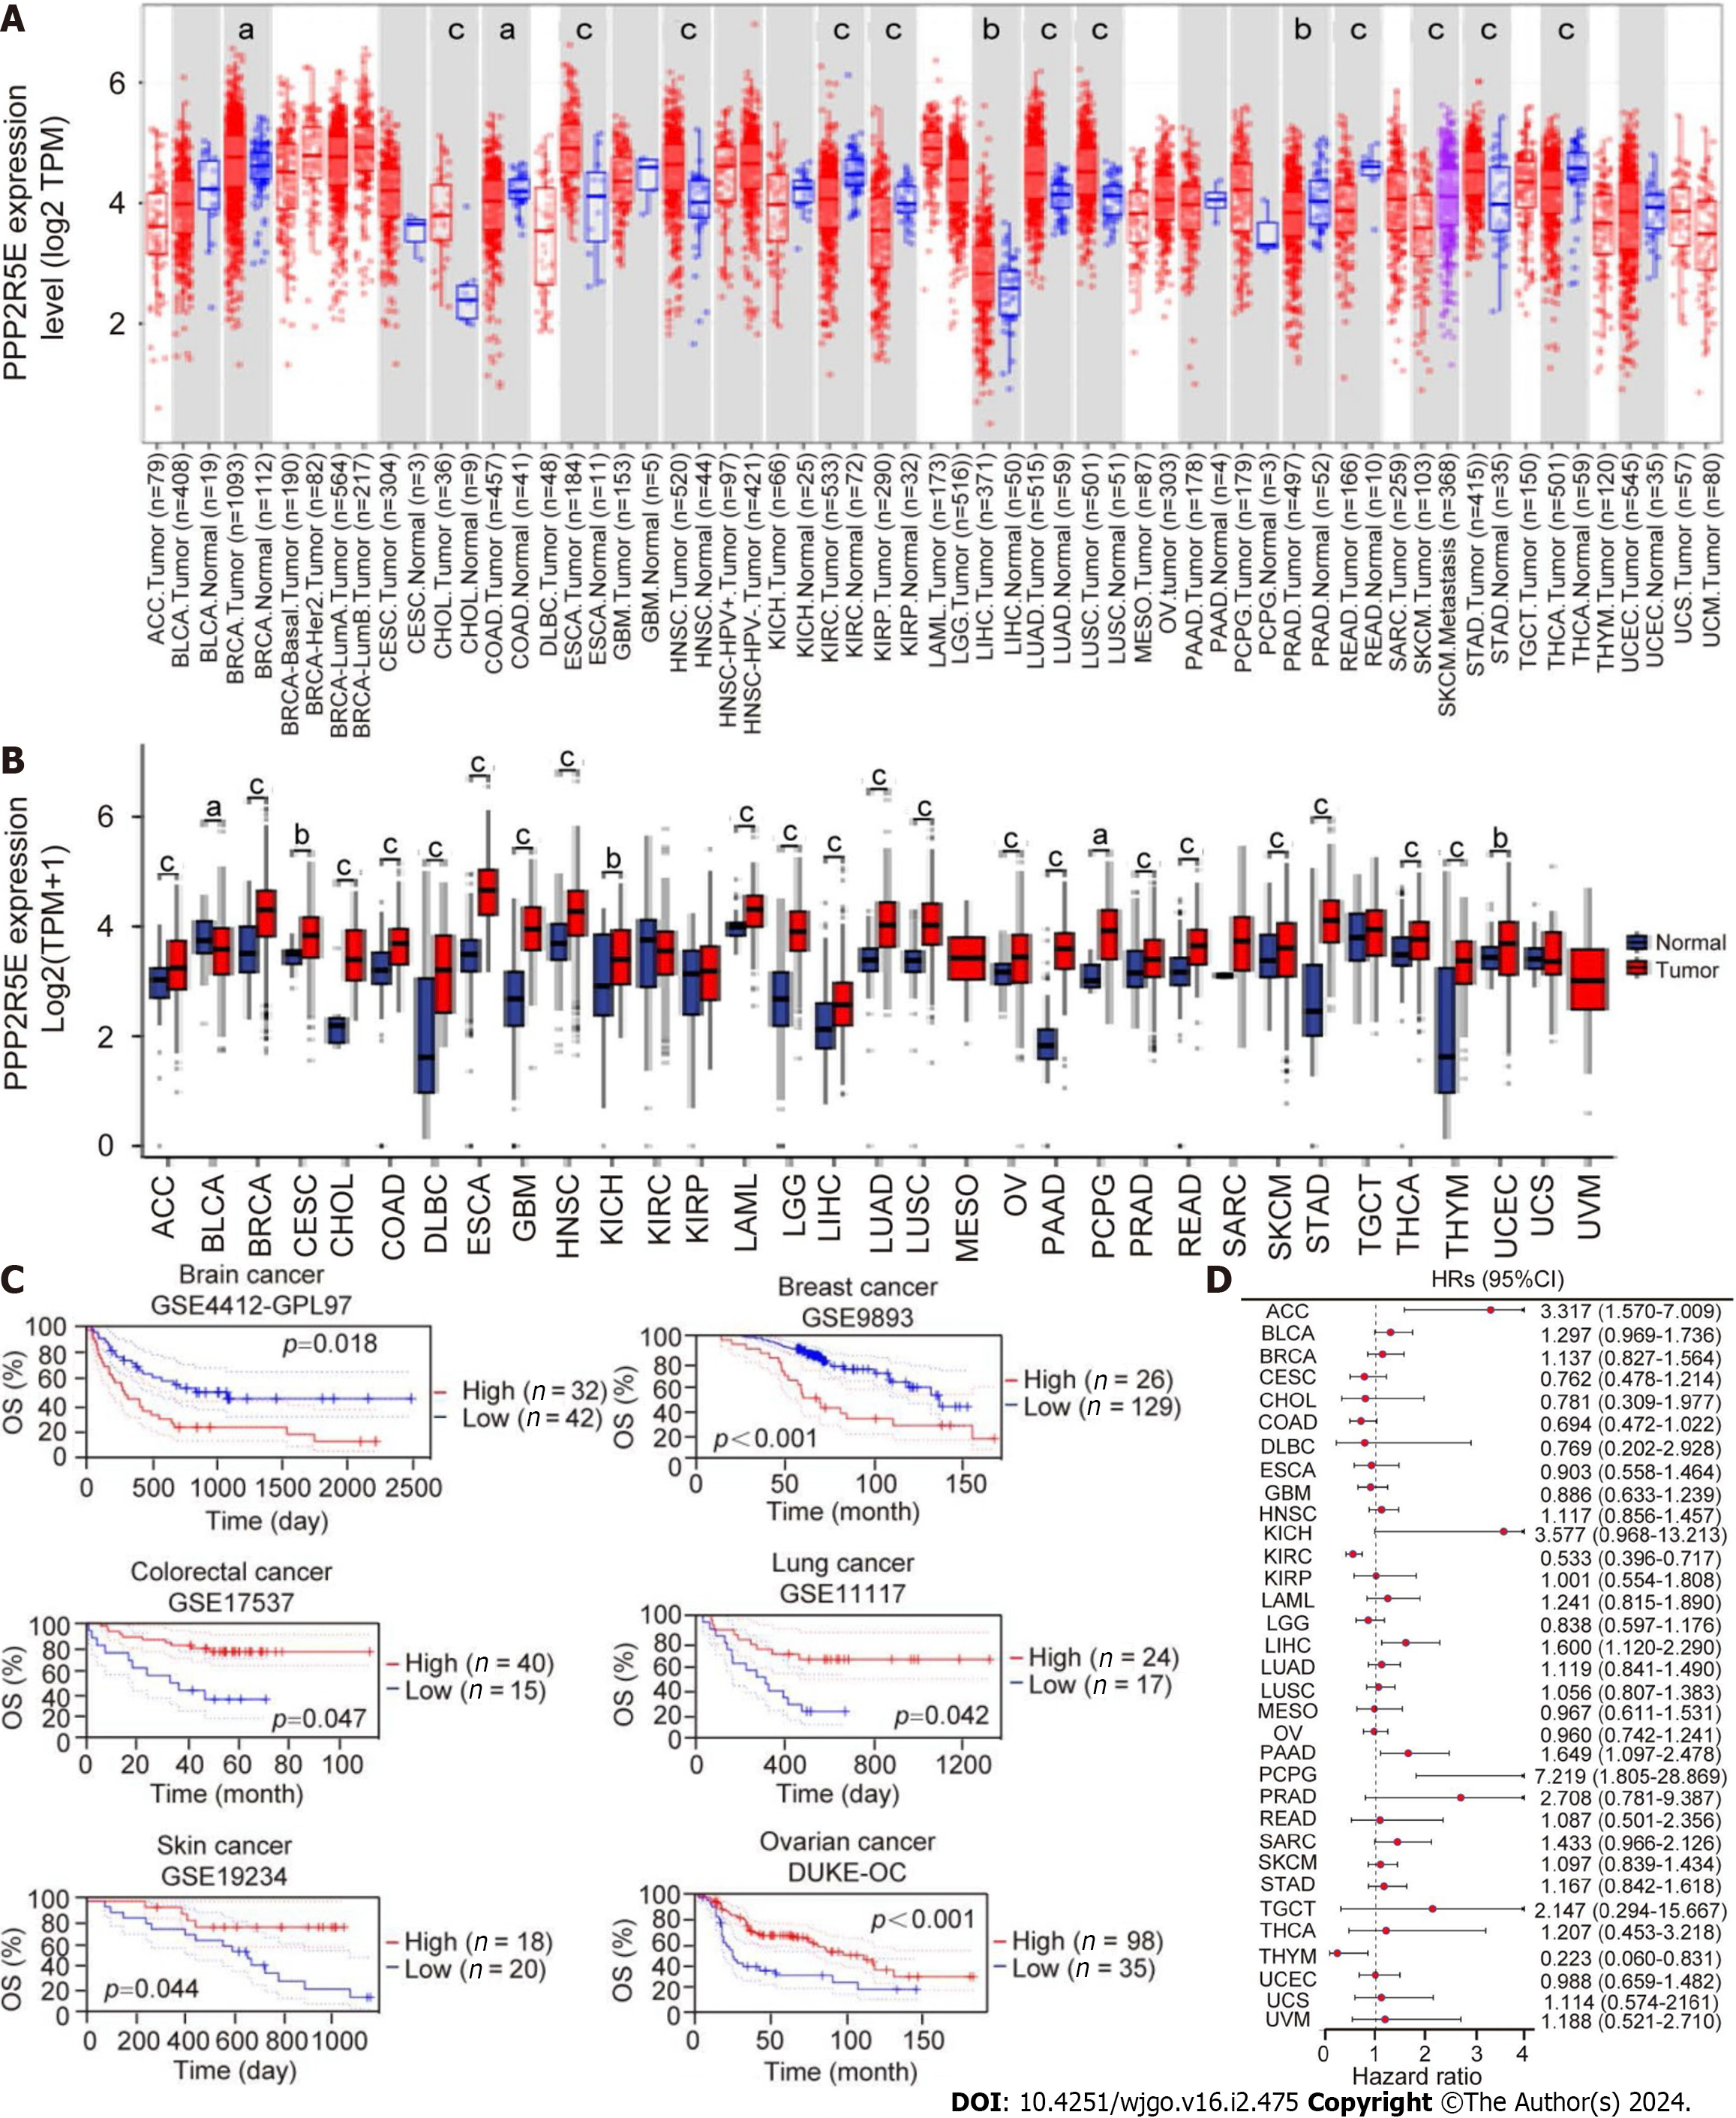
Figure 1 Analysis of B56ε expression levels and prognostic value in 33 types of cancers.
A: B56ε expression profile in pan-cancer by the Tumor Immune Estimation Resource database; B: B56ε expression in pan-carcinoma was analyzed based on The Cancer Genome Atlas (TCGA) and Genotype-Tissue Expression databases; C: Relationship between B56ε expression and tumor survival in the Gene Expression Omnibus dataset; D: Prognostic value of B56ε in pan-cancer based on TCGA database. aP < 0.05; bP < 0.01; cP < 0.001. OS: Overall survival; CI: Confidence interval; HR: Hazard ratio; ACC: Adrenocortical carcinoma; BLCA: Bladder urothelial carcinoma; BRCA: Breast invasive carcinoma; CESC: Cervical squamous cell carcinoma; CHOL: Cholangiocarcinoma; COAD: Colon adenocarcinoma; DLBC: Lymphoid neoplasm diffuse large B cell lymphoma; ESCA: Esophageal carcinoma; GBM: Glioblastoma; HNSC: Head and neck squamous cell carcinoma; KICH: Kidney chromophobe; KIRP: Kidney renal papillary cell carcinoma; KIRC: Kidney clear cell carcinoma; LGG: Low-grade glioma; LIHC: The Cancer Genome Atlas-Liver hepatocellular carcinoma; LUAD: Lung adenocarcinoma; LUSC: Lung squamous cell carcinoma; MESO: Mesothelioma; OV: Ovarian serous cystadenoma; PAAD: Pancreatic adenocarcinoma; PCPG: Pheochromocytoma and paraganglioma; PRAD: Prostate adenocarcinoma; READ: Rectal adenocarcinoma; SARC: Sarcoma; SKCM: Skin cutaneous melanoma; STAD: Stomach adenocarcinoma; TGCT: Testicular germ cell tumor; THCA: Thyroid carcinoma; THYM: Thymic carcinoma; UCEC: Endometrial cancer; UCS: Uterine carcinosarcoma; UVM: Uveal melanoma.
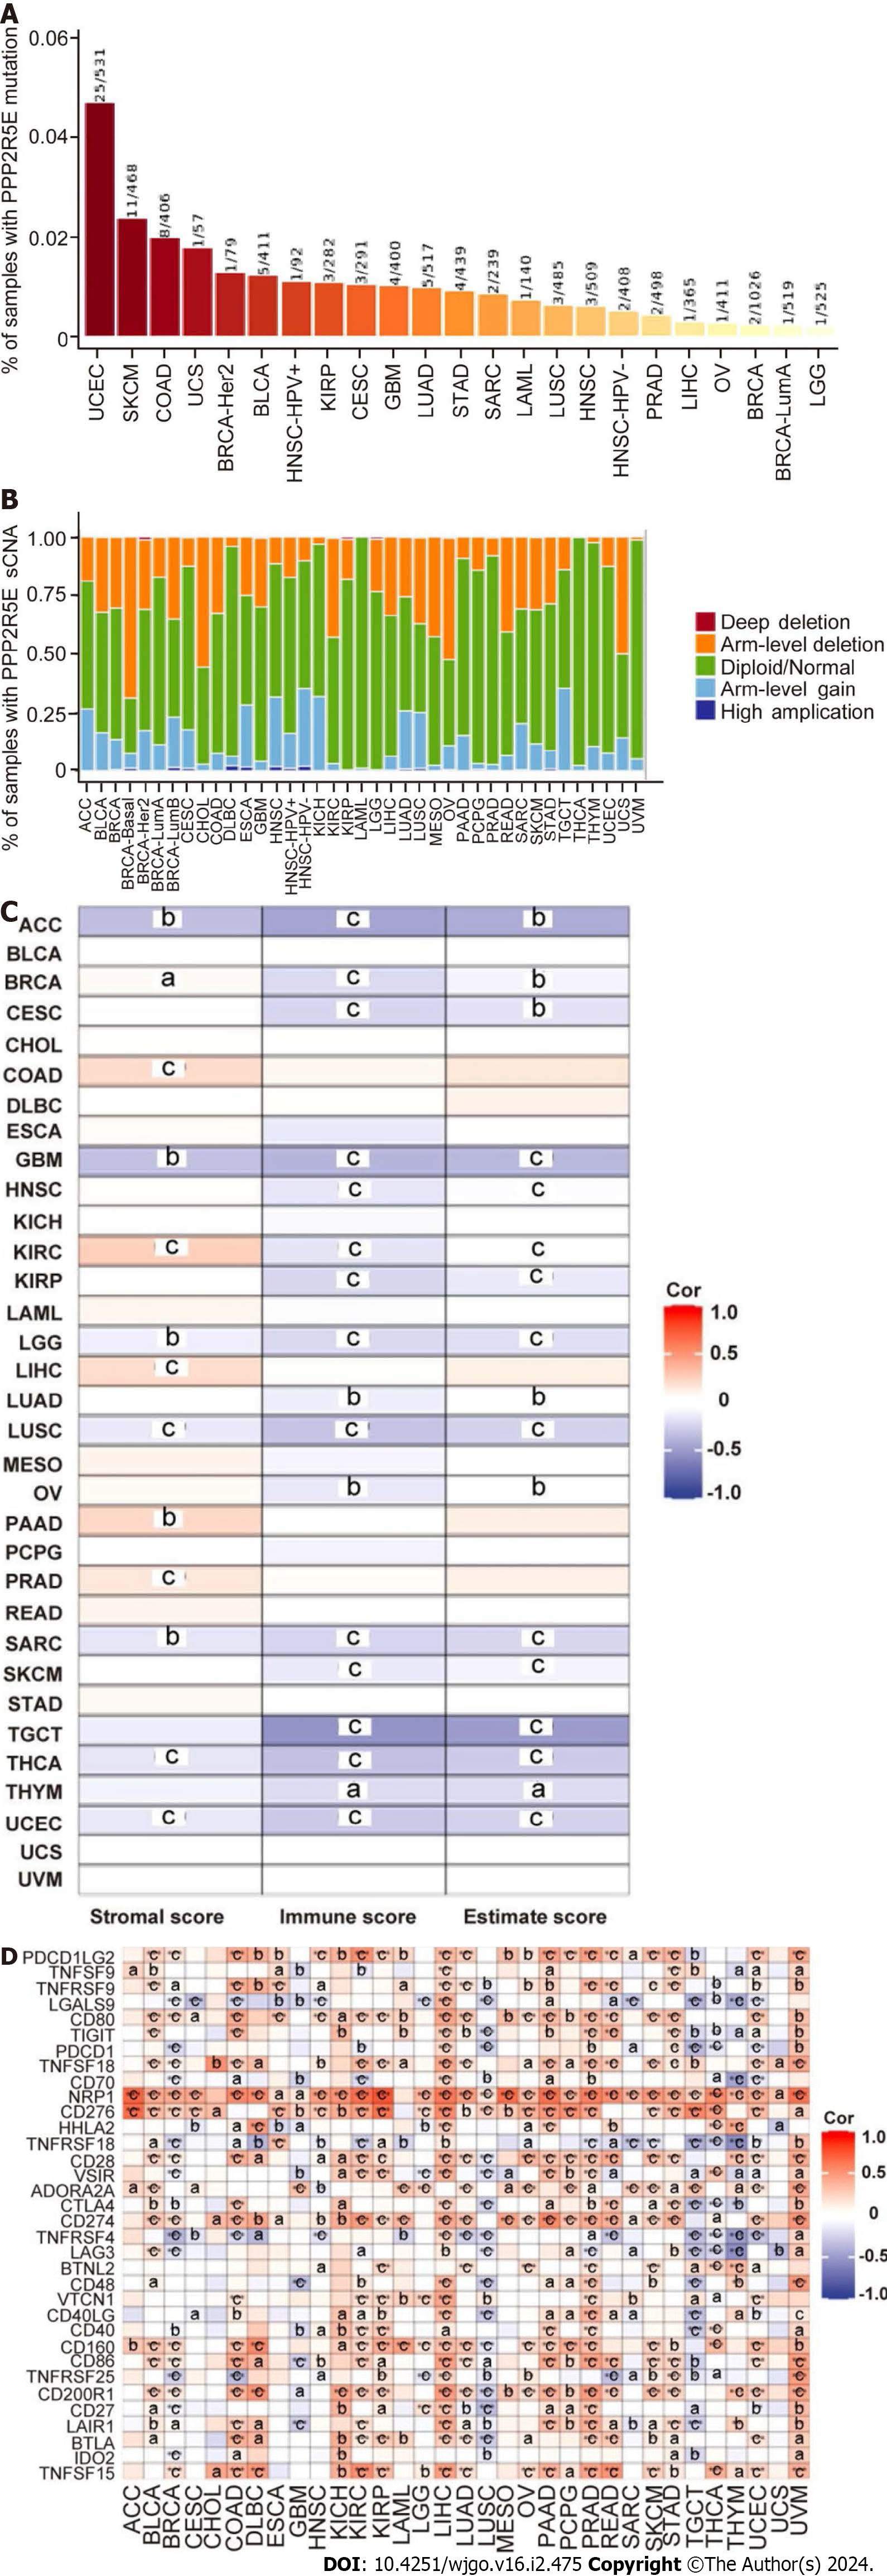
Figure 2 Association analysis of B56ε expression with tumor mutations, somatic copy number alterations, and immunity in pan-cancer.
A: Percentage of samples with B56ε mutation; B: Somatic copy number alterations by the Tumor Immune Estimation Resource database; C: Associations between B56ε expression and estimate score, immune score, and stromal score in different cancers; D: Correlation analysis between immune checkpoint genes and the expression of B56ε. aP < 0.05; bP < 0.01; cP < 0.001. sCNA: Somatic copy number alteration; ACC: Adrenocortical carcinoma; BLCA: Bladder urothelial carcinoma; BRCA: Breast invasive carcinoma; CESC: Cervical squamous cell carcinoma; CHOL: Cholangiocarcinoma; COAD: Colon adenocarcinoma; DLBC: Lymphoid neoplasm diffuse large B cell lymphoma; ESCA: Esophageal carcinoma; GBM: Glioblastoma; HNSC: Head and neck squamous cell carcinoma; KICH: Kidney chromophobe; KIRP: Kidney renal papillary cell carcinoma; KIRC: Kidney clear cell carcinoma; LGG: Low-grade glioma; LIHC: The Cancer Genome Atlas-Liver hepatocellular carcinoma; LUAD: Lung adenocarcinoma; LUSC: Lung squamous cell carcinoma; MESO: Mesothelioma; OV: Ovarian serous cystadenoma; PAAD: Pancreatic adenocarcinoma; PCPG: Pheochromocytoma and paraganglioma; PRAD: Prostate adenocarcinoma; READ: Rectal adenocarcinoma; SARC: Sarcoma; SKCM: Skin cutaneous melanoma; STAD: Stomach adenocarcinoma; TGCT: Testicular germ cell tumor; THCA: Thyroid carcinoma; THYM: Thymic carcinoma; UCEC: Endometrial cancer; UCS: Uterine carcinosarcoma; UVM: Uveal melanoma.
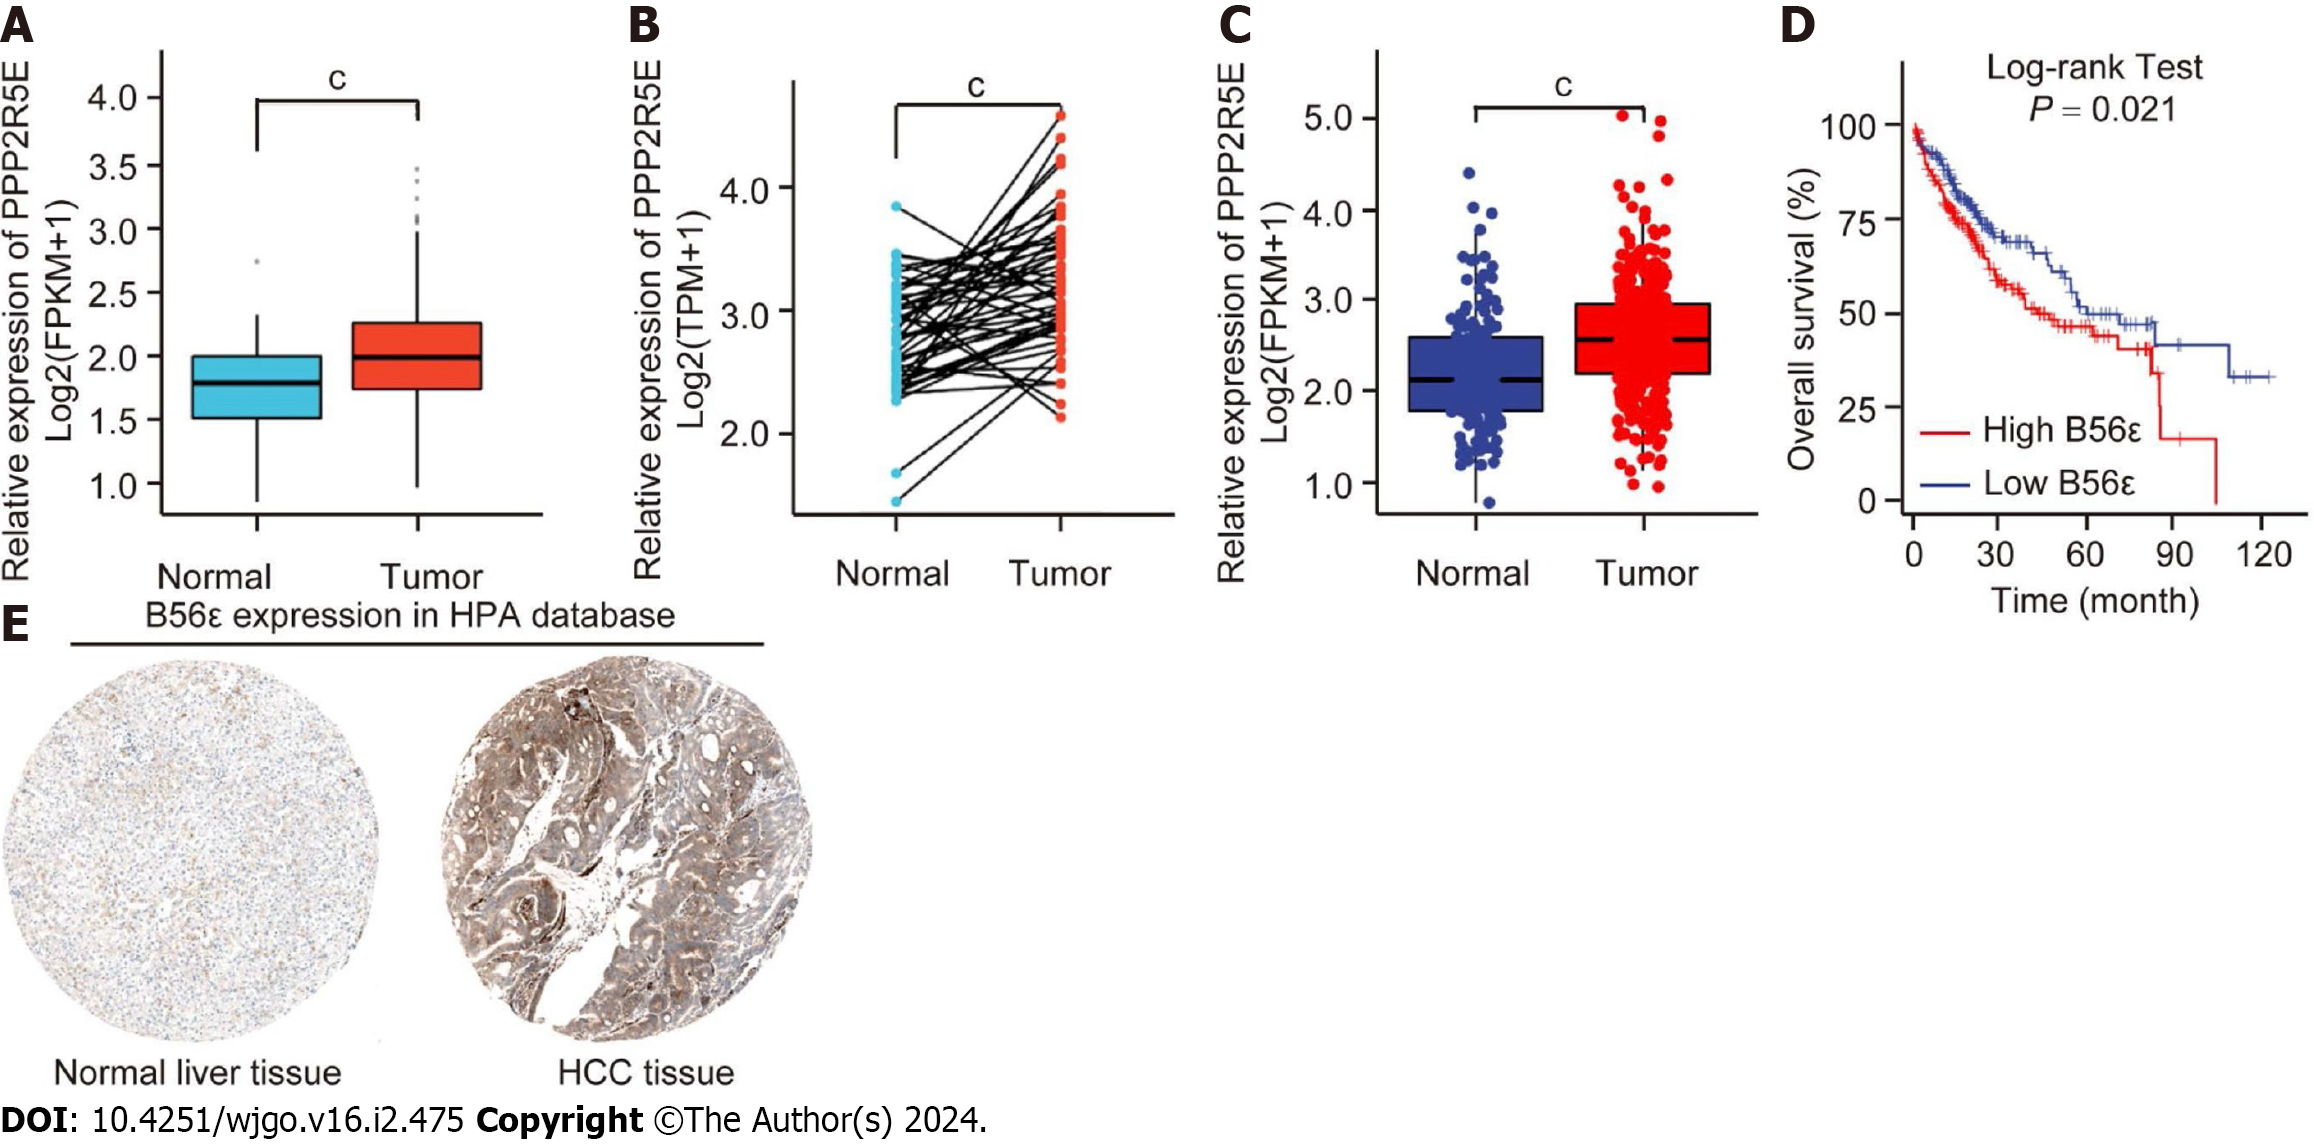
Figure 3 Expression and prognosis value of B56ε in hepatocellular carcinoma.
A: Analysis of the B56ε expression difference between hepatocellular carcinoma (HCC) tissues and normal liver tissues in The Cancer Genome Atlas (TCGA); B: Pairwise difference comparison of B56ε expression level between HCC tissues and normal liver tissues in the TCGA database; C: TCGA combined with Genotype-Tissue Expression databases to analyze the expression of B56ε in HCC tissues and normal liver tissues; D: Gene Expression Profiling Interactive Analysis was utilized for analyzing the relationship between B56ε expression and HCC overall survival time; E: Expression of B56ε protein in normal liver tissue and HCC tissue by the Human Protein Atlas database. cP < 0.001. HCC: Hepatocellular carcinoma.
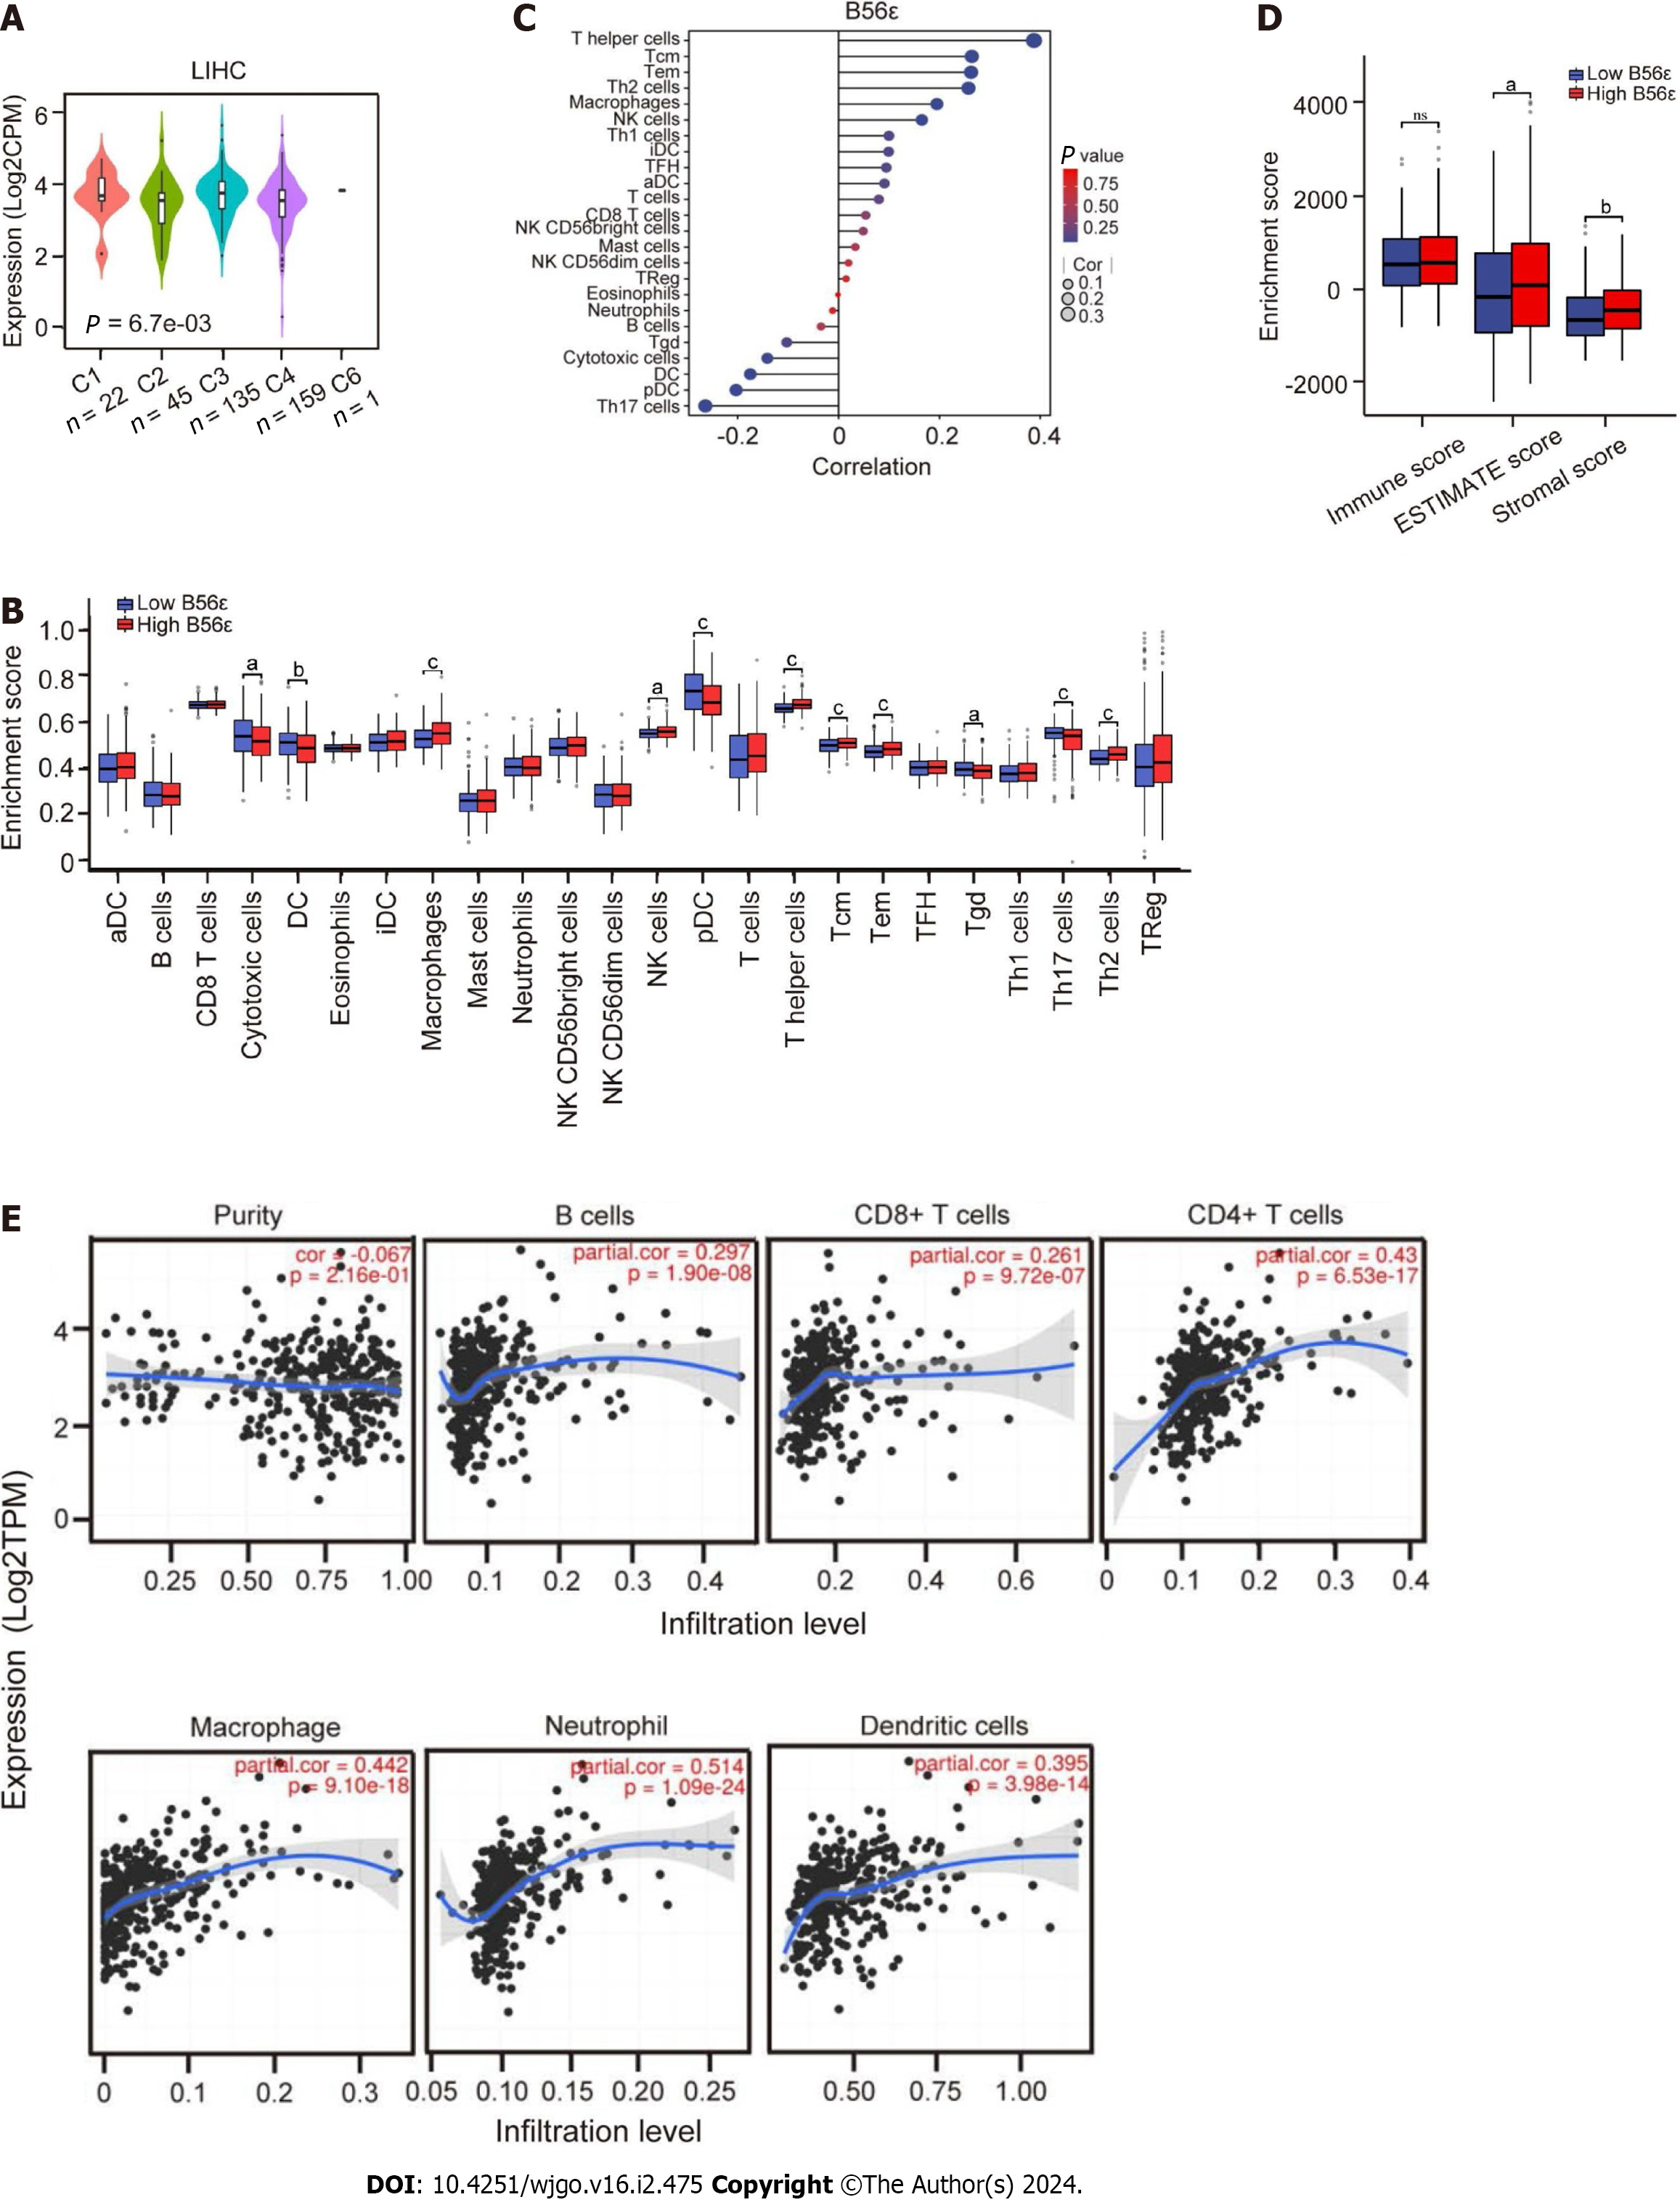
Figure 4 Correlation analysis of B56ε expression with immune subtype and immune cells.
A: Analysis of B56ε expression in different immune subtypes of hepatocellular carcinoma (HCC); B: Differential expression of immune cells in the B56ε high and low expression groups; C: Correlation analysis between immune cells and the expression of B56ε; D: Analysis of differences in tumor microenvironment scores between groups with a high and low B56ε expression; E: Association of six common types of immune cells and B56ε expression in HCC by Tumor Immune Estimation Resource. aP < 0.05; bP < 0.01; cP < 0.001. aDC: Activate dendritic cell; iDC: Immature dendritic cell; NK: Natural killer; pDC: Plasmacytoid dendritic cell; TFH: Follicular helper T cell; Th: T helper; Treg: Regulatory T cell.
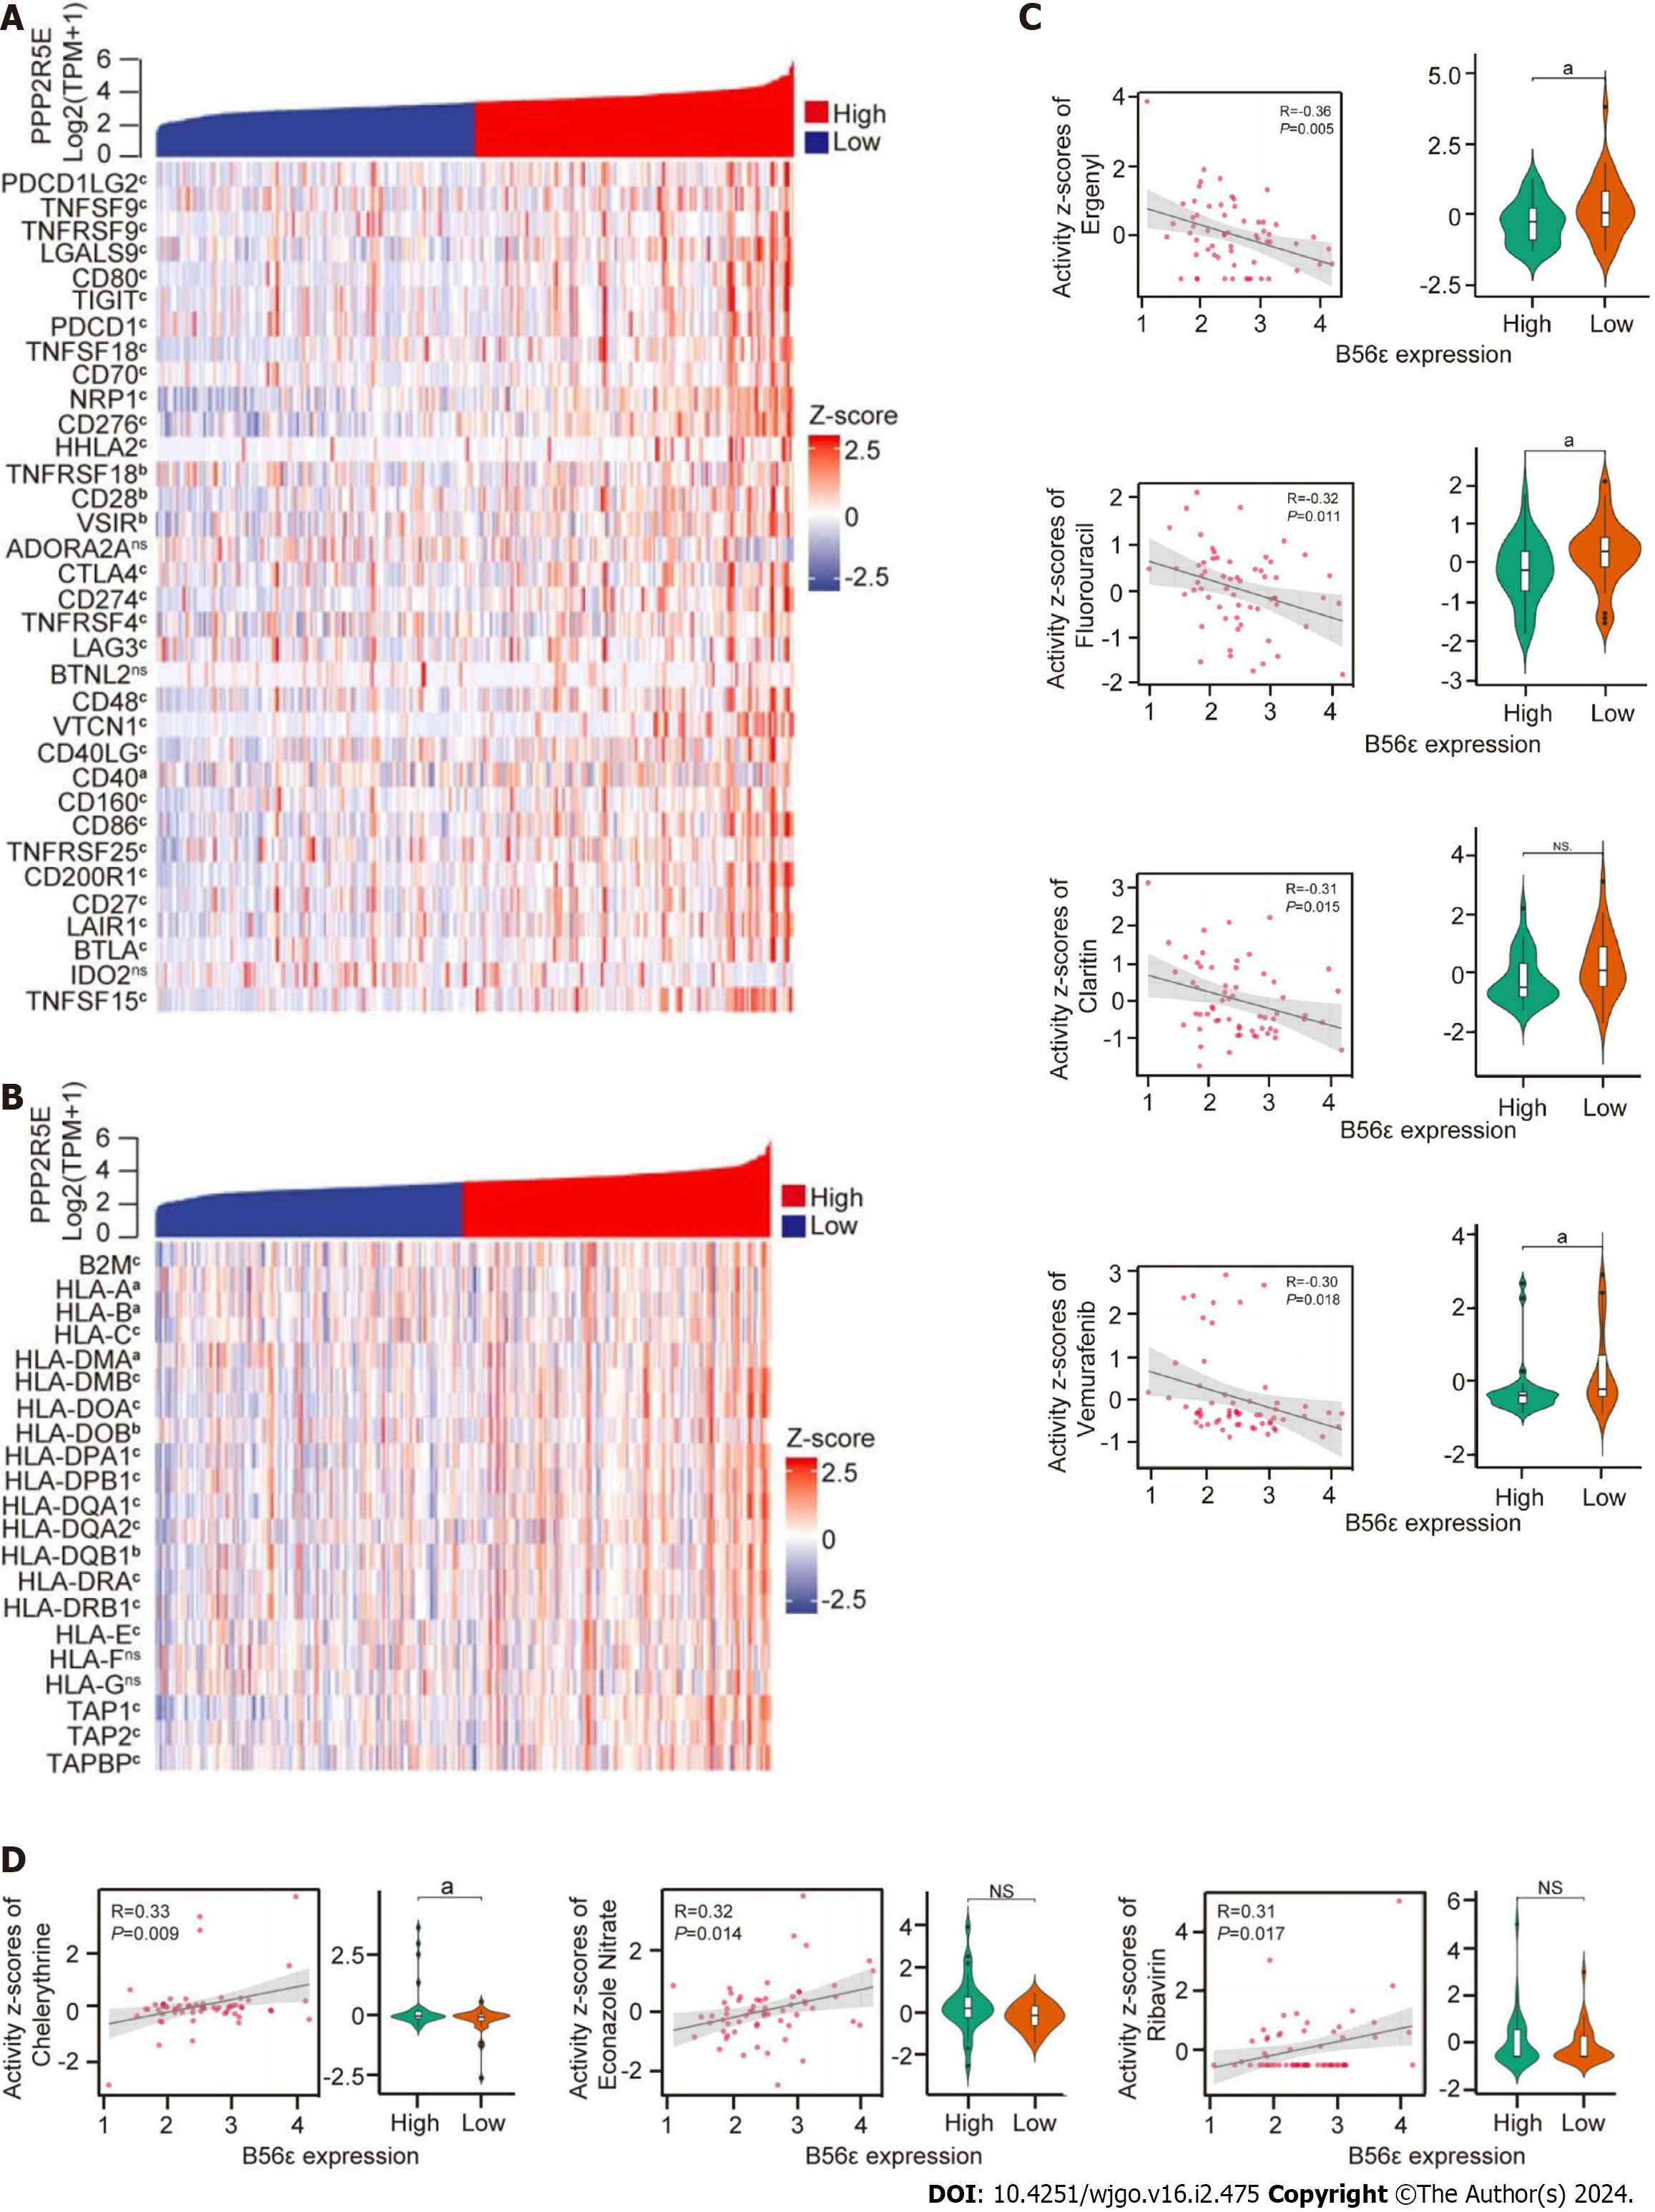
Figure 5 Correlation analysis of B56ε expression with immune checkpoint genes, human leukocyte antigen-associated genes and drug sensitivity.
A: Correlation analysis between immune checkpoint genes and the expression of B56ε; B: Correlation analysis between human leukocyte antigen-associated genes and the expression of B56ε; C and D: Association between anticancer drug response and B56ε expression in the CellMiner database. aP < 0.05; bP < 0.01; cP < 0.001. HLA: Human leukocyte antigen; NS: Not significant.
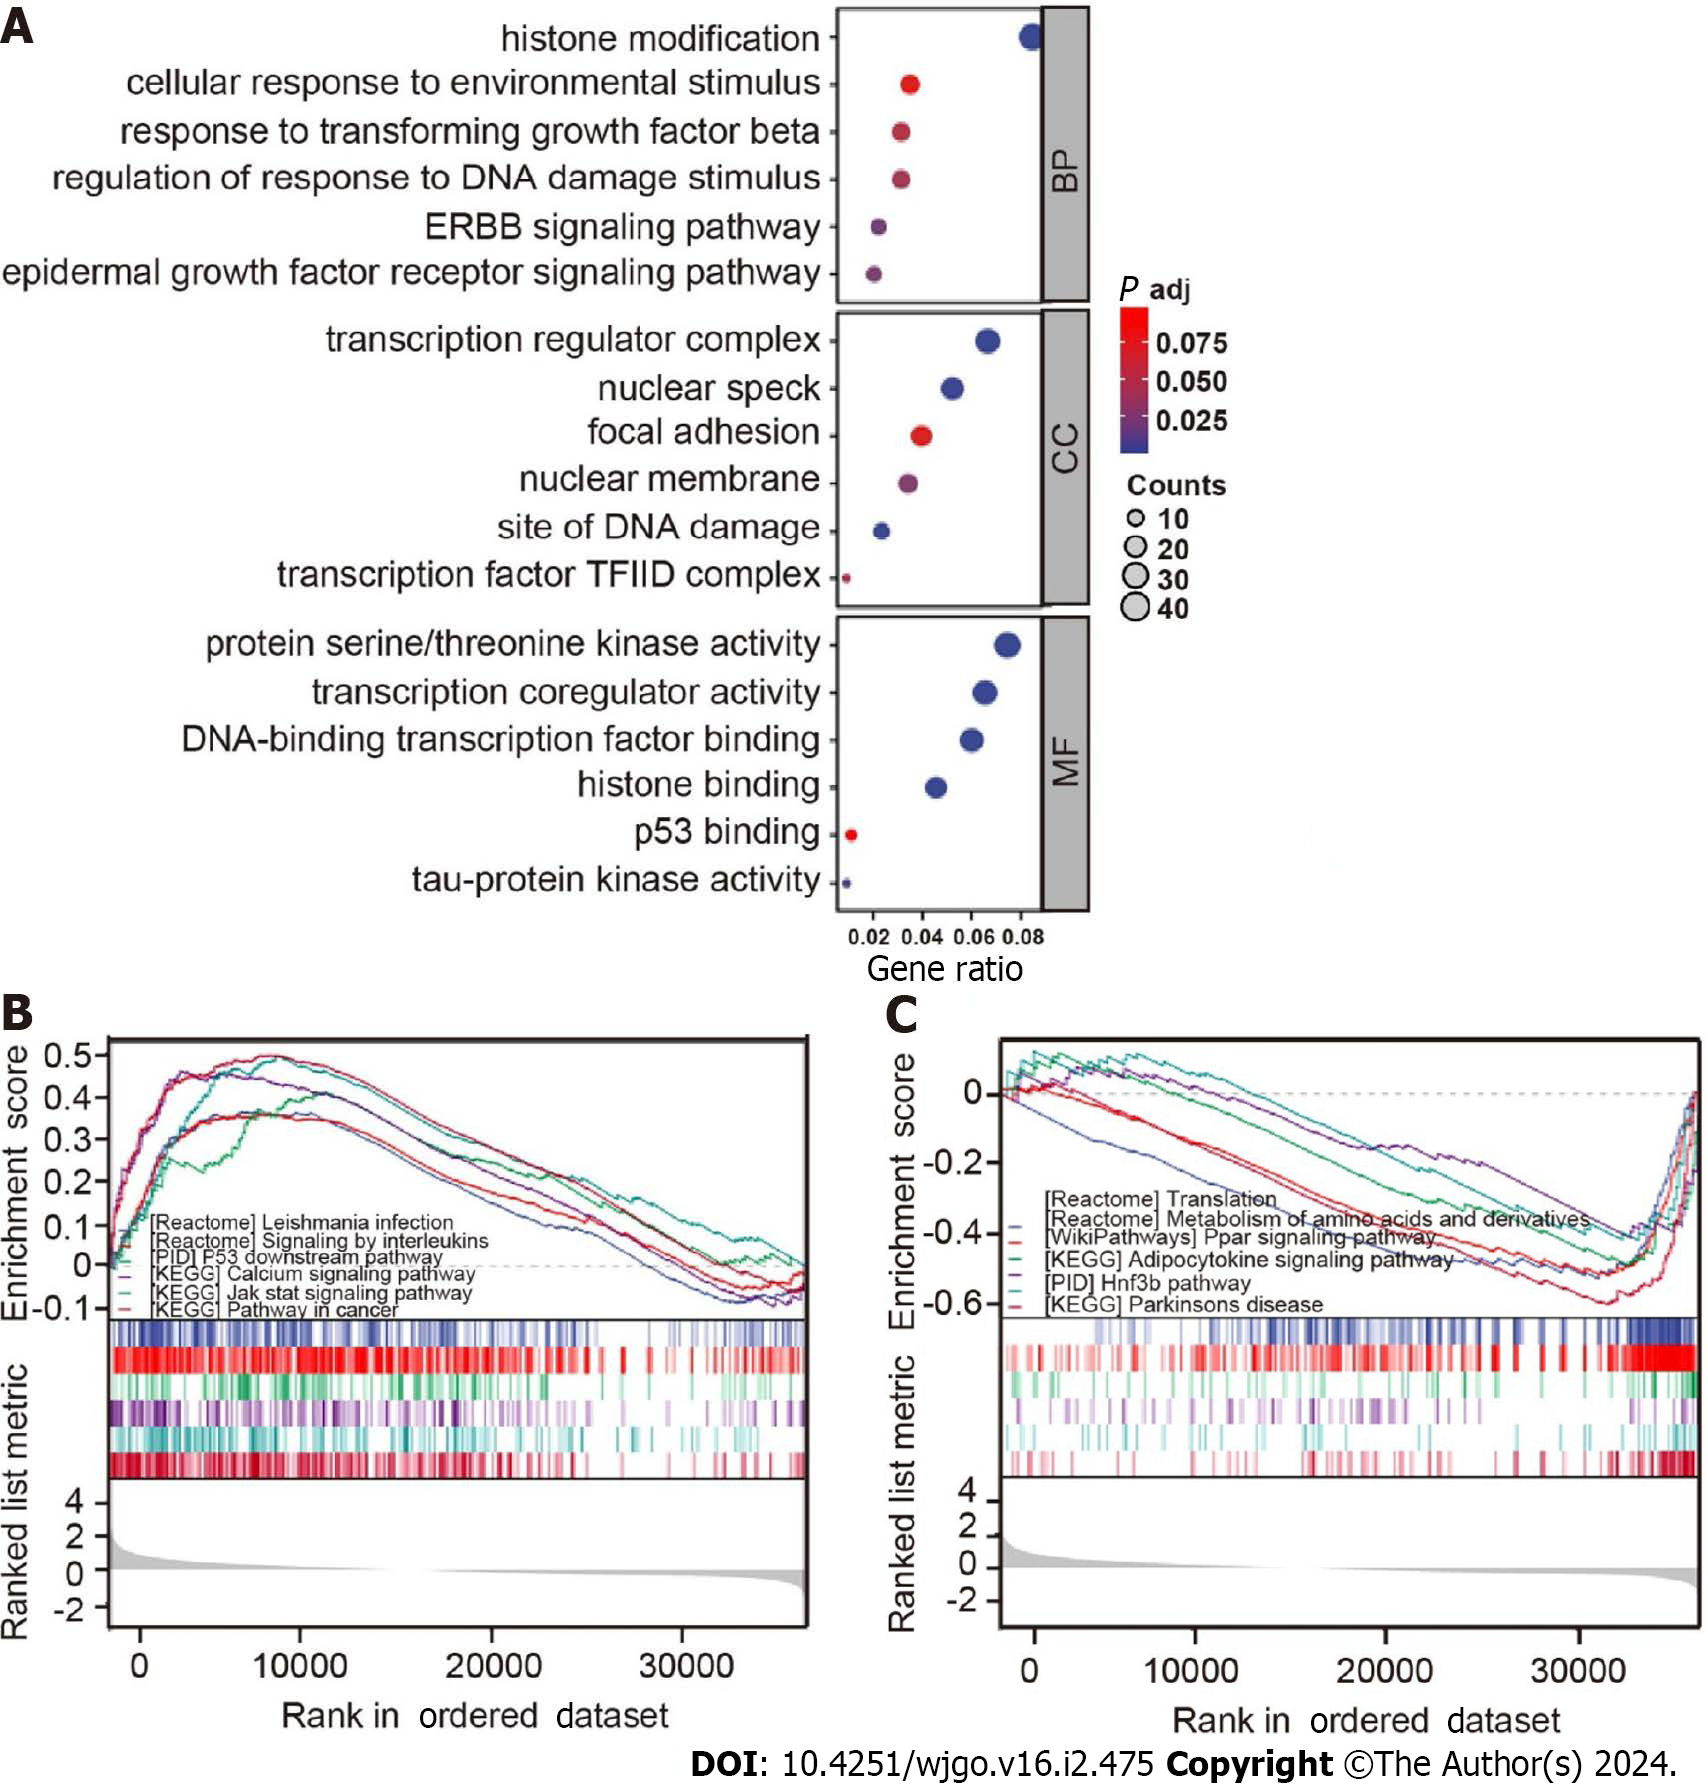
Figure 6 Gene Ontology and Kyoto Encyclopedia of Genes and Genomes analyses for samples with high and low B56ε expression.
A: Gene Ontology enrichment analysis was performed on B56ε differential expression samples; B: Kyoto Encyclopedia of Genes and Genomes (KEGG) signaling pathway in the high B56ε expression group; C: KEGG signaling pathway in the low B56ε expression group. BP: Biological process; CC: Cellular component; MF: Molecular function.
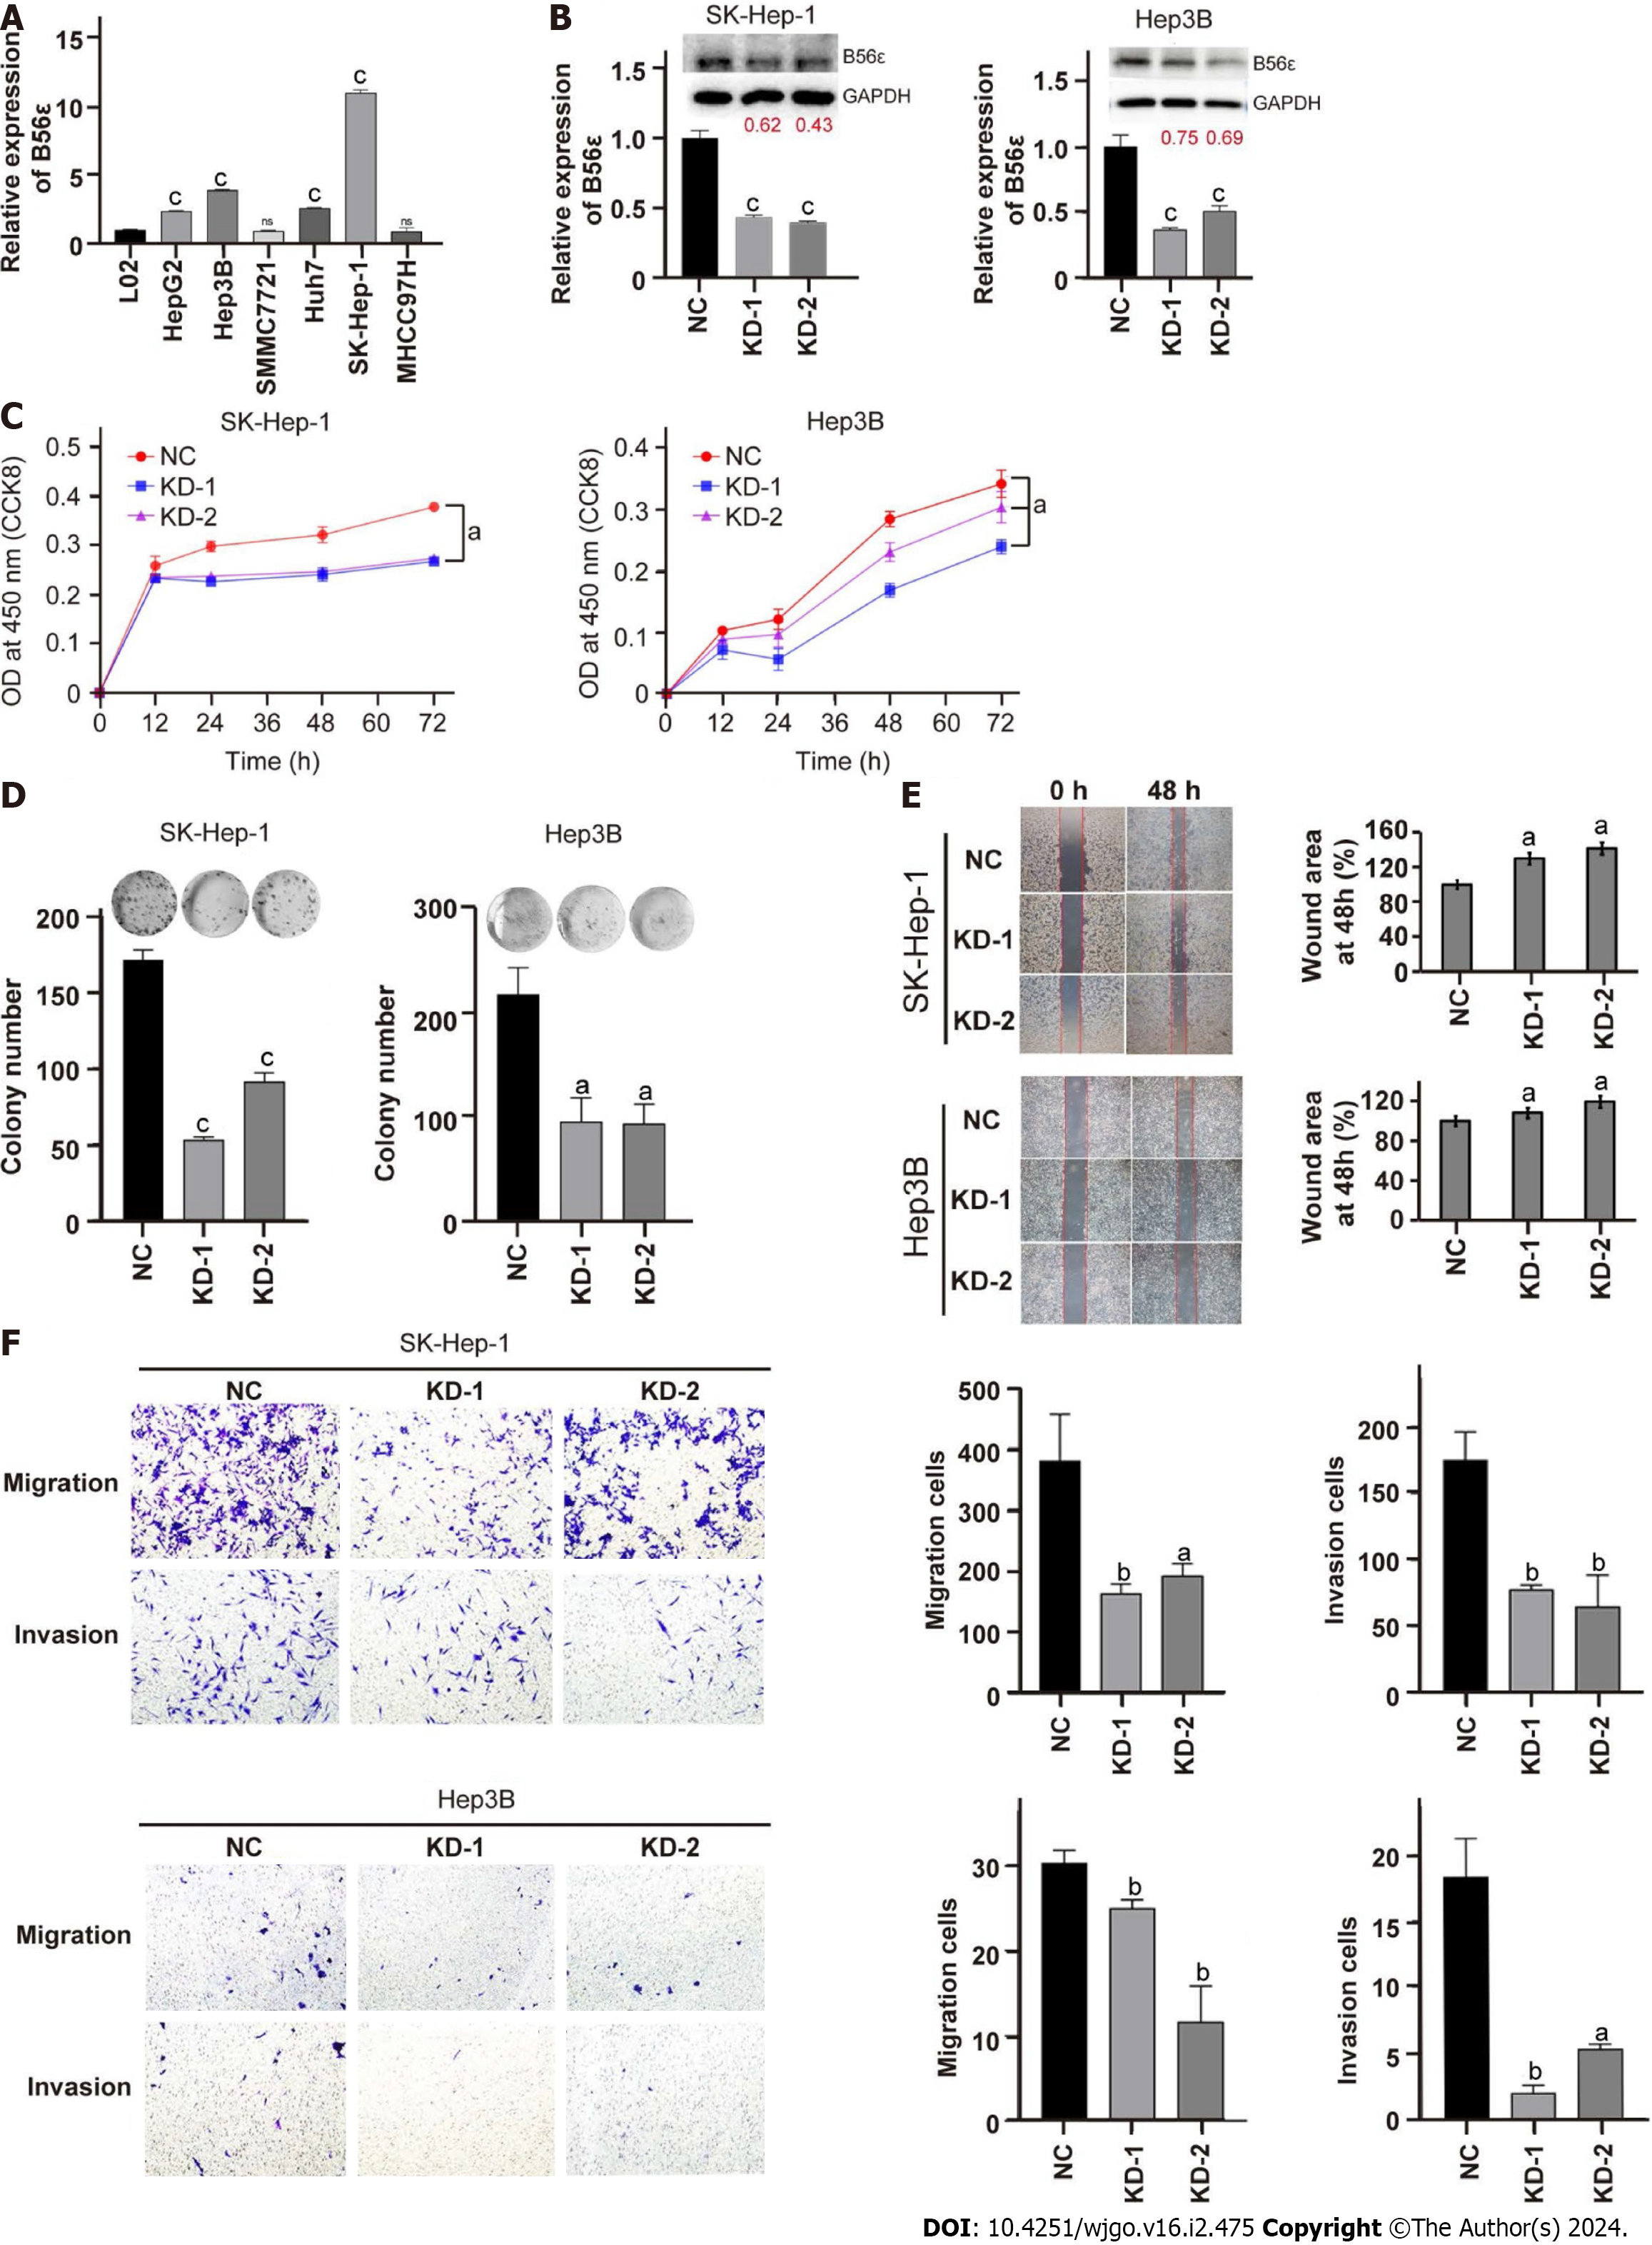
Figure 7 Effects of B56ε downregulation on the proliferation, invasion, and migration of hepatocellular carcinoma cells.
A: Quantitative polymerase chain reaction (qPCR) detected the expression of B56ε in human hepatocellular carcinoma (HCC) cell lines; B: qPCR and western blotting verified B56ε knockdown efficiency; C: Downregulation of B56ε expression on the proliferation of HCC cells was determined by the Cell Counting Kit-8 assay; D: Downregulation of B56ε expression on the proliferation of HCC cells was determined by the colony formation assay; E and F: Wound healing assay (E) and transwell assay (F) showed the ability of cells to invade and migrate after downregulation of B56ε. aP < 0.05; bP < 0.01; cP < 0.001. NC: Negative vector control; KD-1: B56ε knockdown vector 1; KD-2: B56ε knockdown vector 2; CCK-8: Cell Counting Kit-8.
- Citation: Wu HM, Huang YY, Xu YQ, Xiang WL, Yang C, Liu RY, Li D, Guo XF, Zhang ZB, Bei CH, Tan SK, Zhu XN. Comprehensive analysis of the protein phosphatase 2A regulatory subunit B56ε in pan-cancer and its role and mechanism in hepatocellular carcinoma. World J Gastrointest Oncol 2024; 16(2): 475-492
- URL: https://www.wjgnet.com/1948-5204/full/v16/i2/475.htm
- DOI: https://dx.doi.org/10.4251/wjgo.v16.i2.475


