Copyright
©The Author(s) 2024.
World J Gastrointest Oncol. Feb 15, 2024; 16(2): 314-330
Published online Feb 15, 2024. doi: 10.4251/wjgo.v16.i2.314
Published online Feb 15, 2024. doi: 10.4251/wjgo.v16.i2.314
Figure 1 Expression of cyclin-dependent kinase 9 in colorectal cancer tissues.
Expression of cyclin-dependent kinase 9 (CDK9) was extracted from The Cancer Genome Atlas. CDK9 was significantly increased in colorectal cancer tissues compared to paired paracarcinoma tissues. CDK9: Cyclin-dependent kinase 9.
Figure 2 Transmission electron microscopy.
Tissues with a high level of cyclin-dependent kinase 9 (CDK9) had significantly more autophagy than tissues with a low level of CDK9. Red arrows indicate the autophagosomes. CDK9-H: High level of cyclin-dependent kinase 9 expression; CDK9-L: Low level of cyclin-dependent kinase 9 expression; N: Paracarcinoma tissue; T: Tumor tissue.
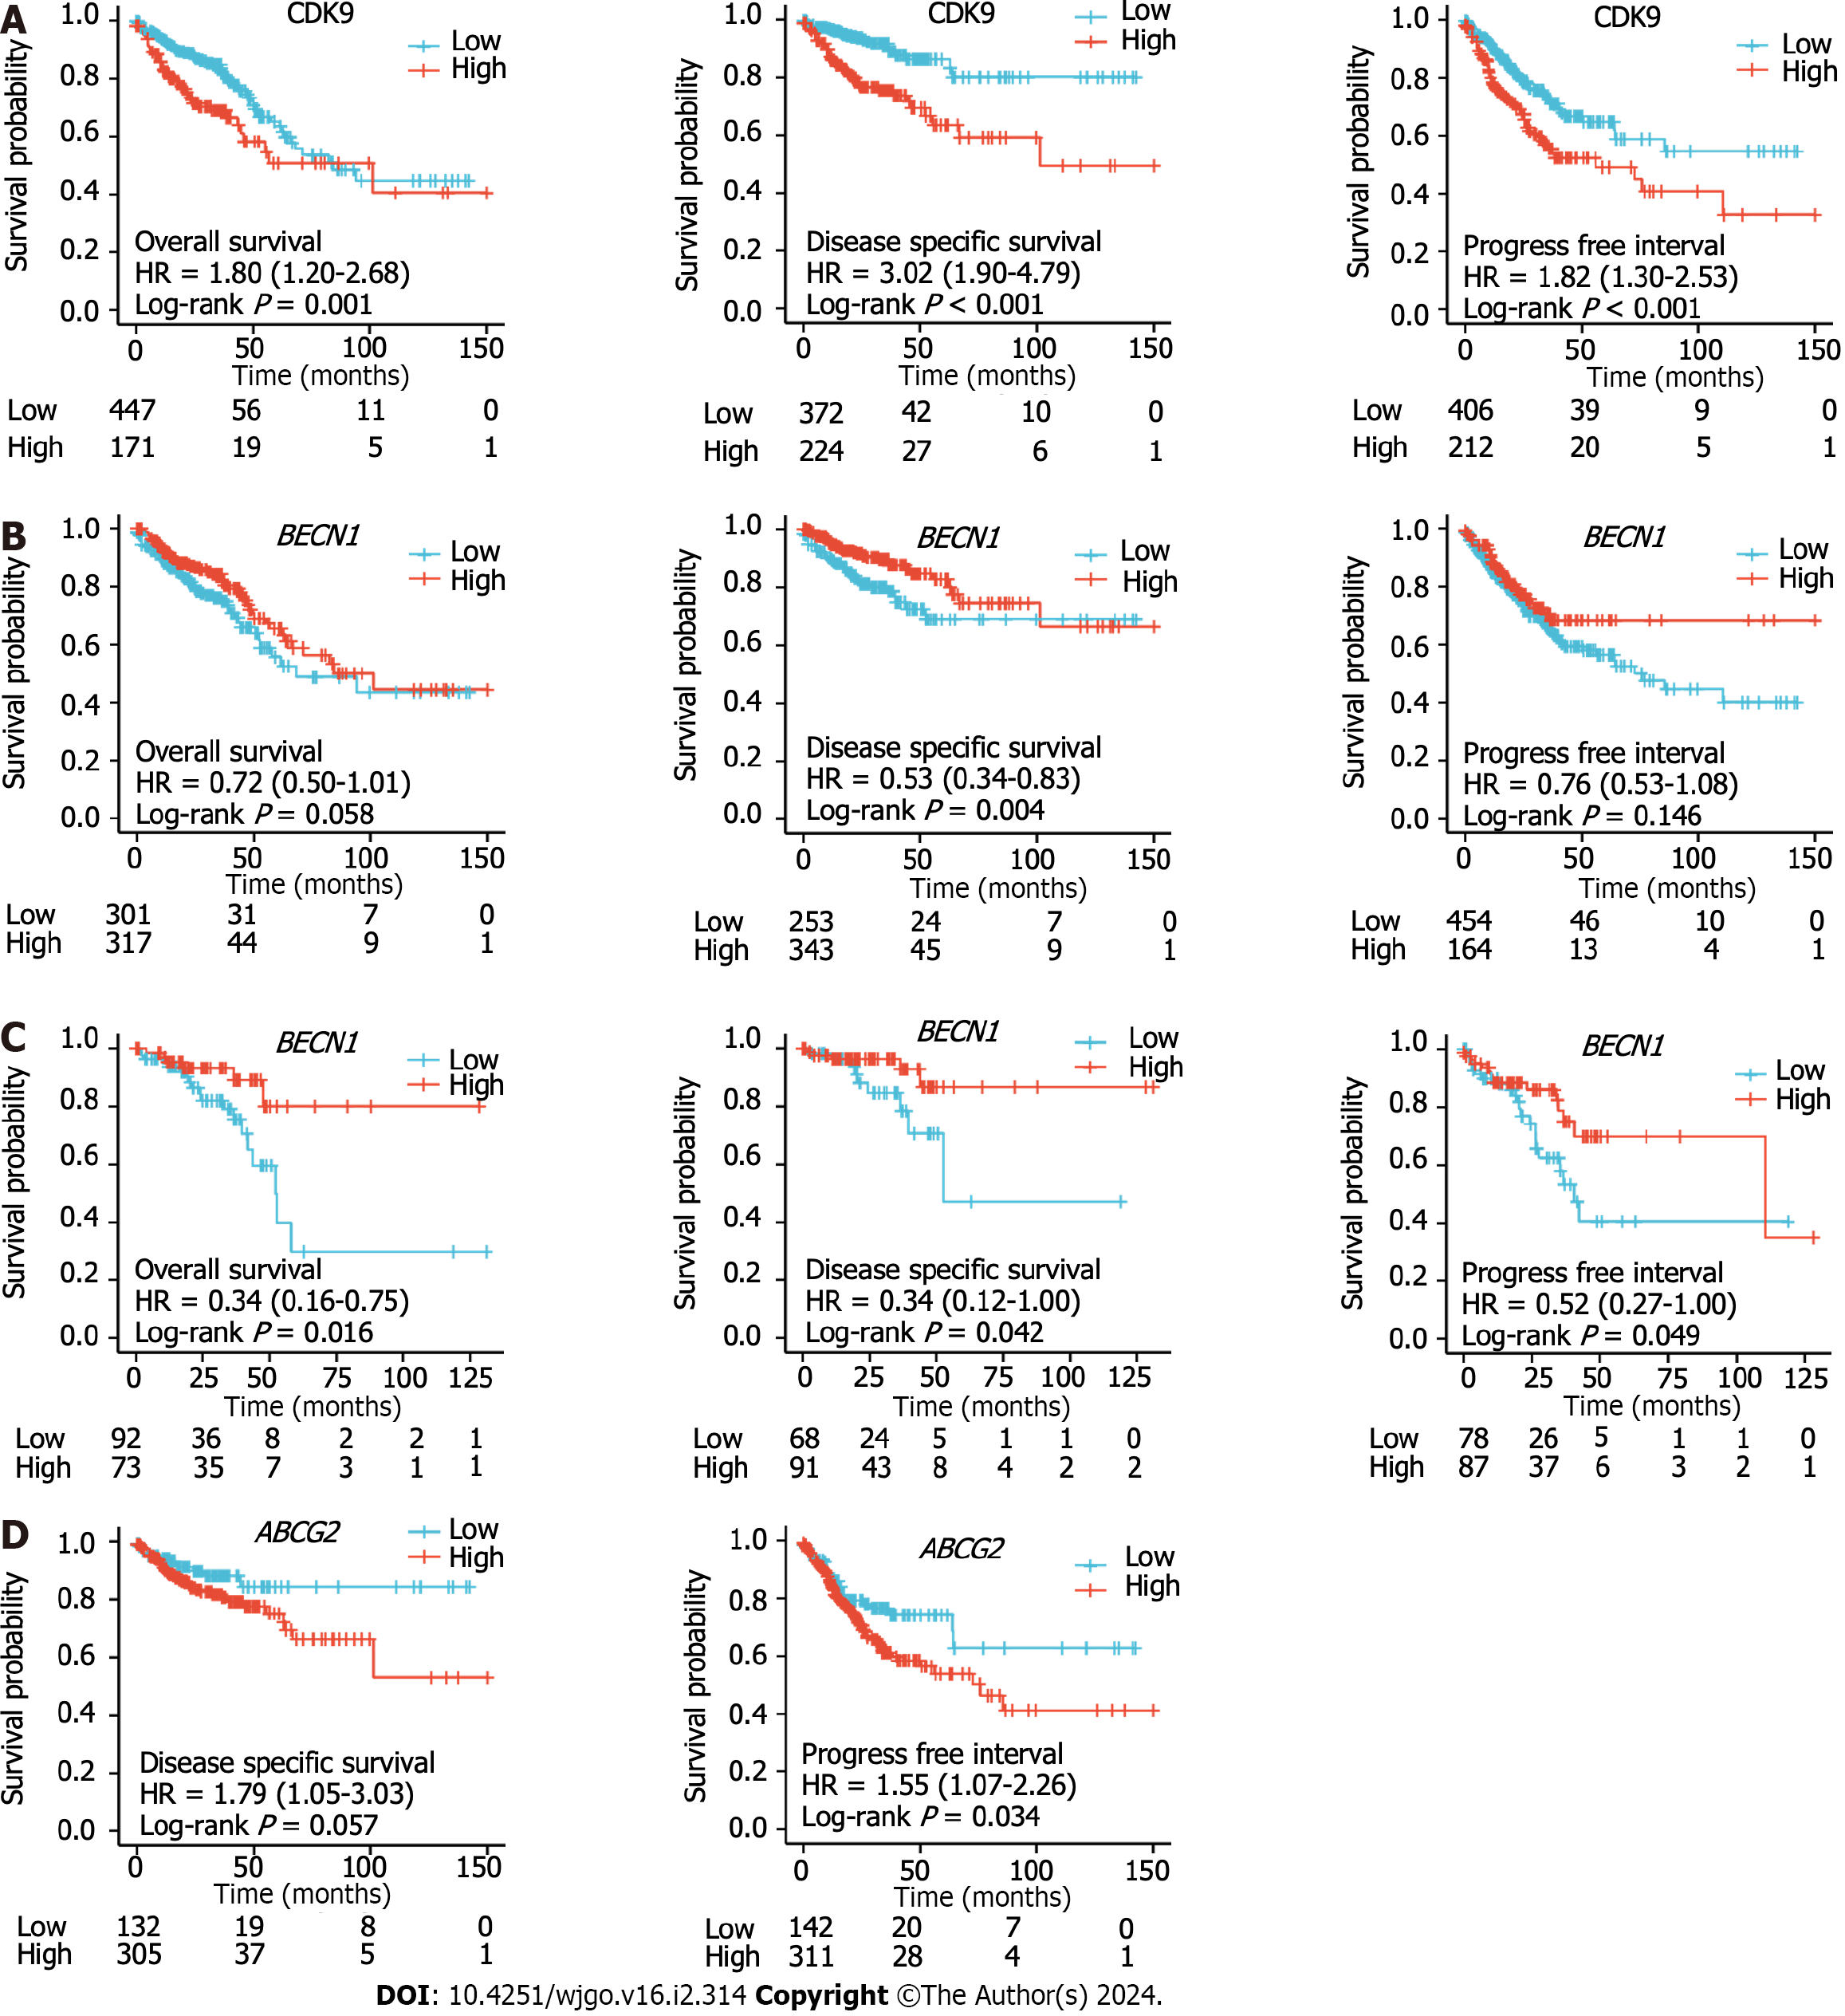
Figure 3 Kaplan–Meier curves of colorectal cancer patients.
A: Kaplan-Meier curves of overall survival (OS), disease-specific survival (DSS), and progression-free interval (PFI) in colorectal cancer patients with high and low expression levels of cyclin-dependent kinase 9 (CDK9); B: Kaplan-Meier curves of OS, DSS, and PFI of colon cancer patients with high and low expression levels of BECN1; C: Kaplan-Meier curves of OS, DSS, and PFI of rectum cancer patients with high and low expression levels of BECN1; D: Kaplan-Meier curves of DSS and PFI of colon cancer patients with high and low expression levels of ABCG2. HR: Hazard ratio.
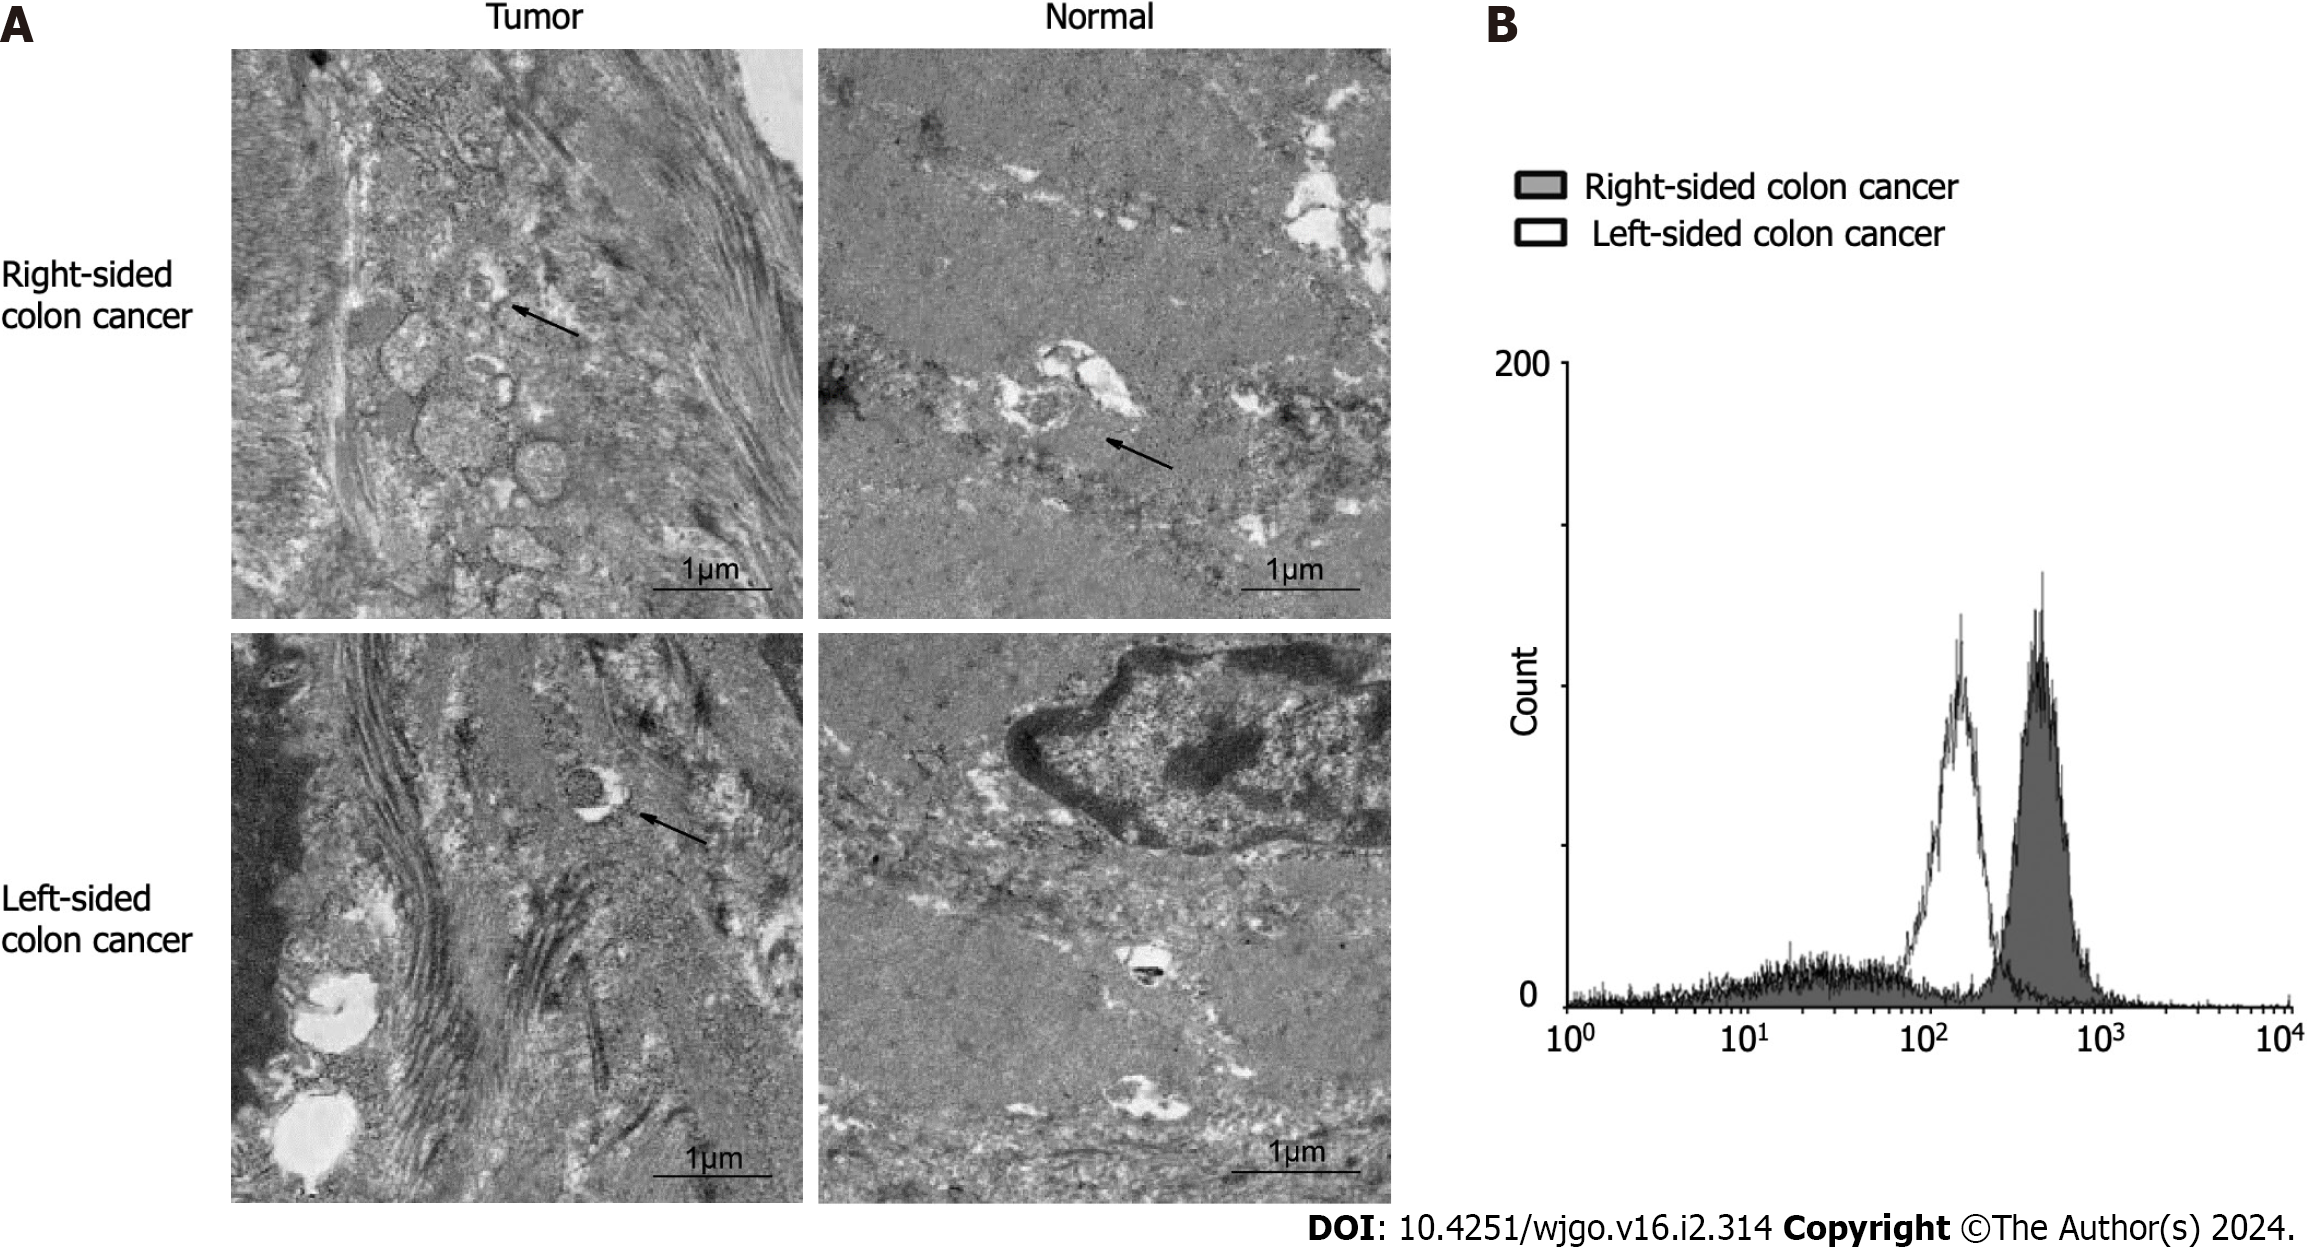
Figure 4 Level of autophagy in left and right colon cancer tissues.
A: Autophagosomes (black arrows) in left and right colon cancer and adjacent tissues observed under electron microscopy; B: Expression levels of autophagic vesicles in left and right colon cancer primary cells.
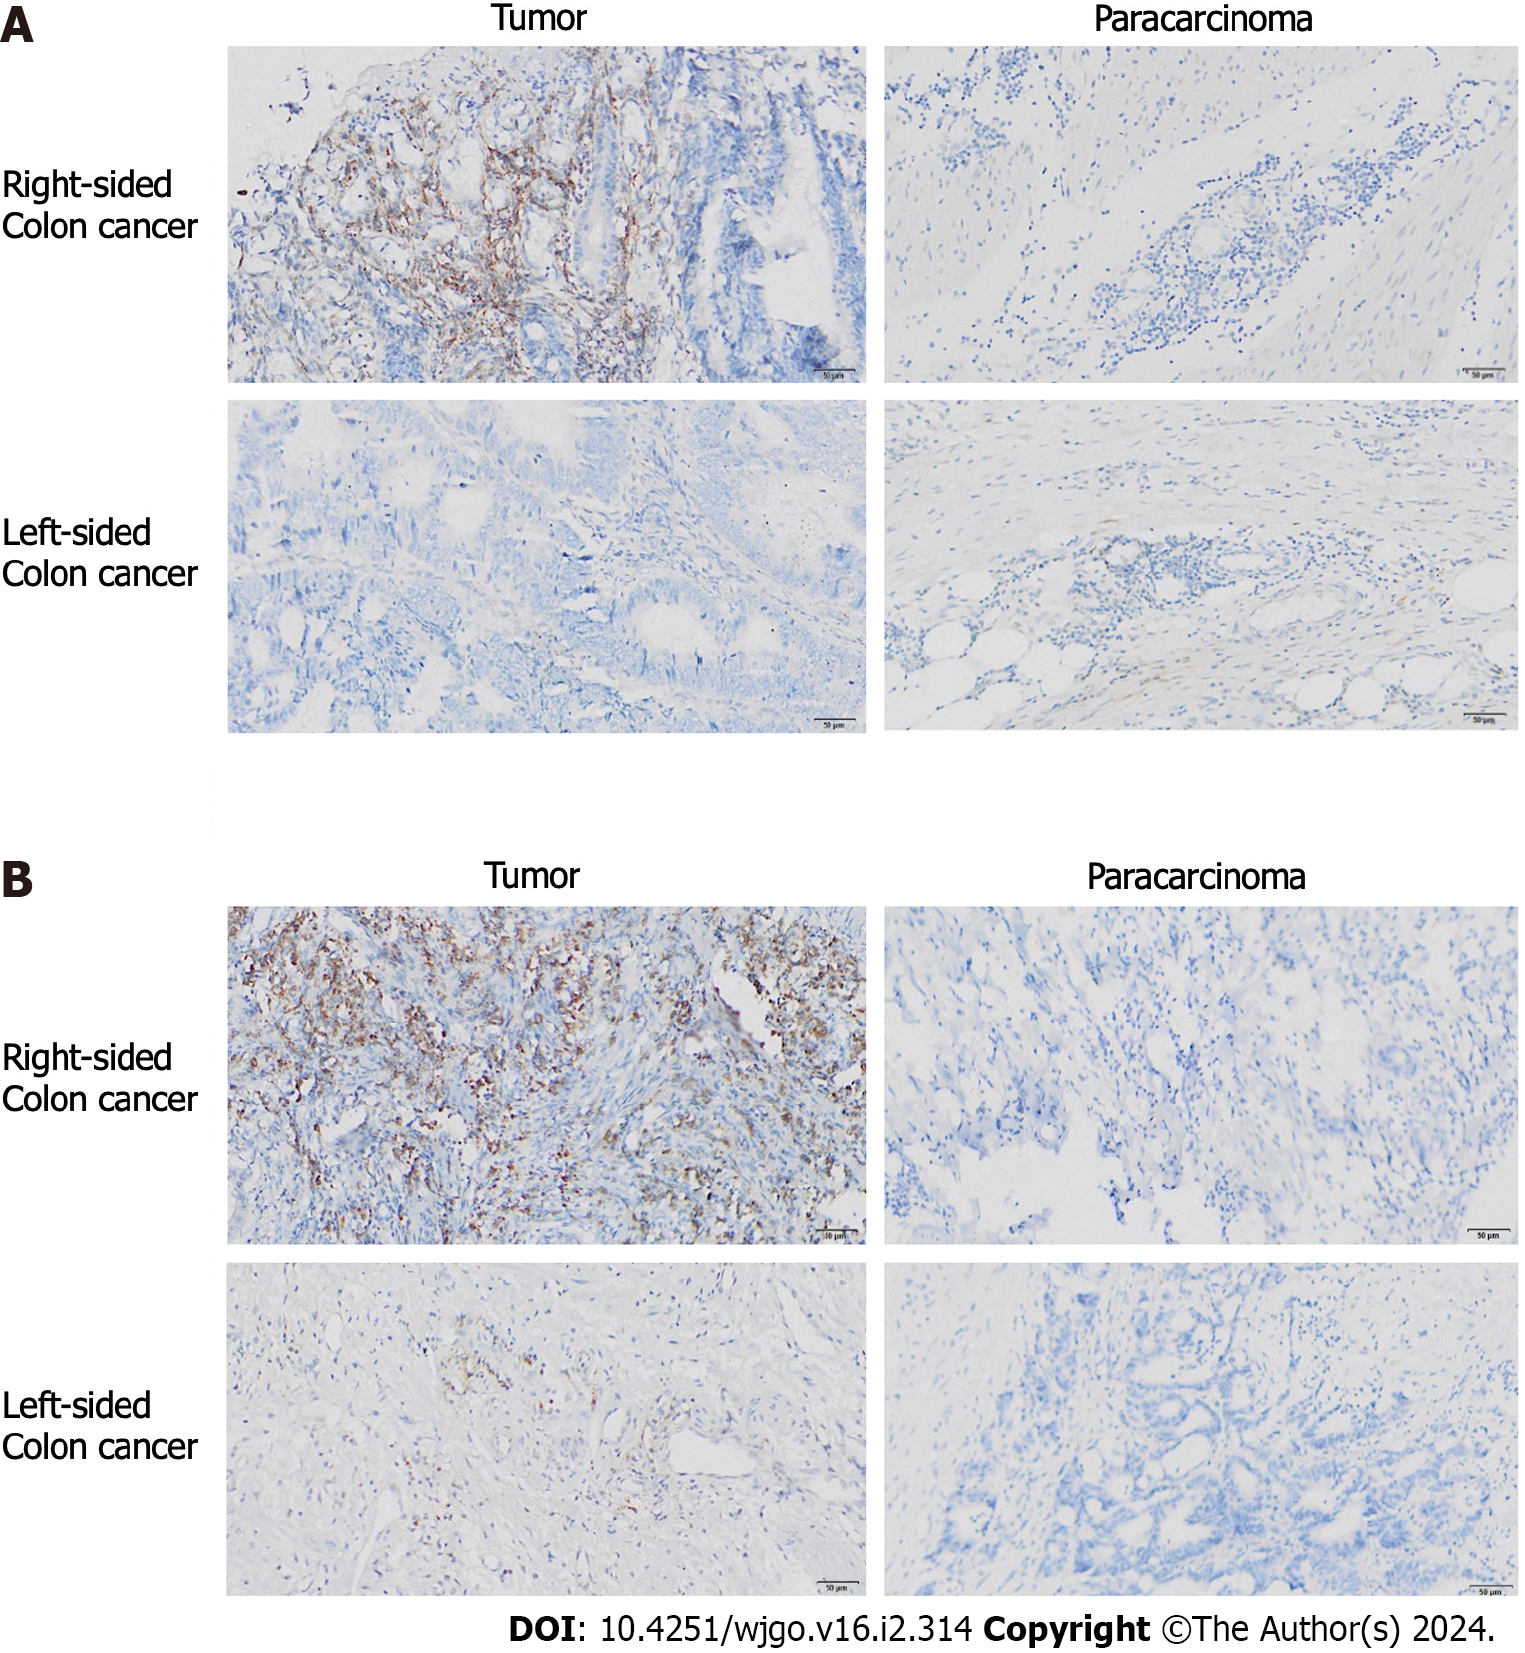
Figure 5 Expression of BECN1 (a key autophagy molecule) and ABCG2 (a drug resistance factor) in left and right colon cancer tissue.
A: Expression of BECN1 in left and right colon cancer tissues and paracarcinoma tissue; B: Expression of ABCG2 in left and right colon cancer tissues and paracarcinoma tissue.
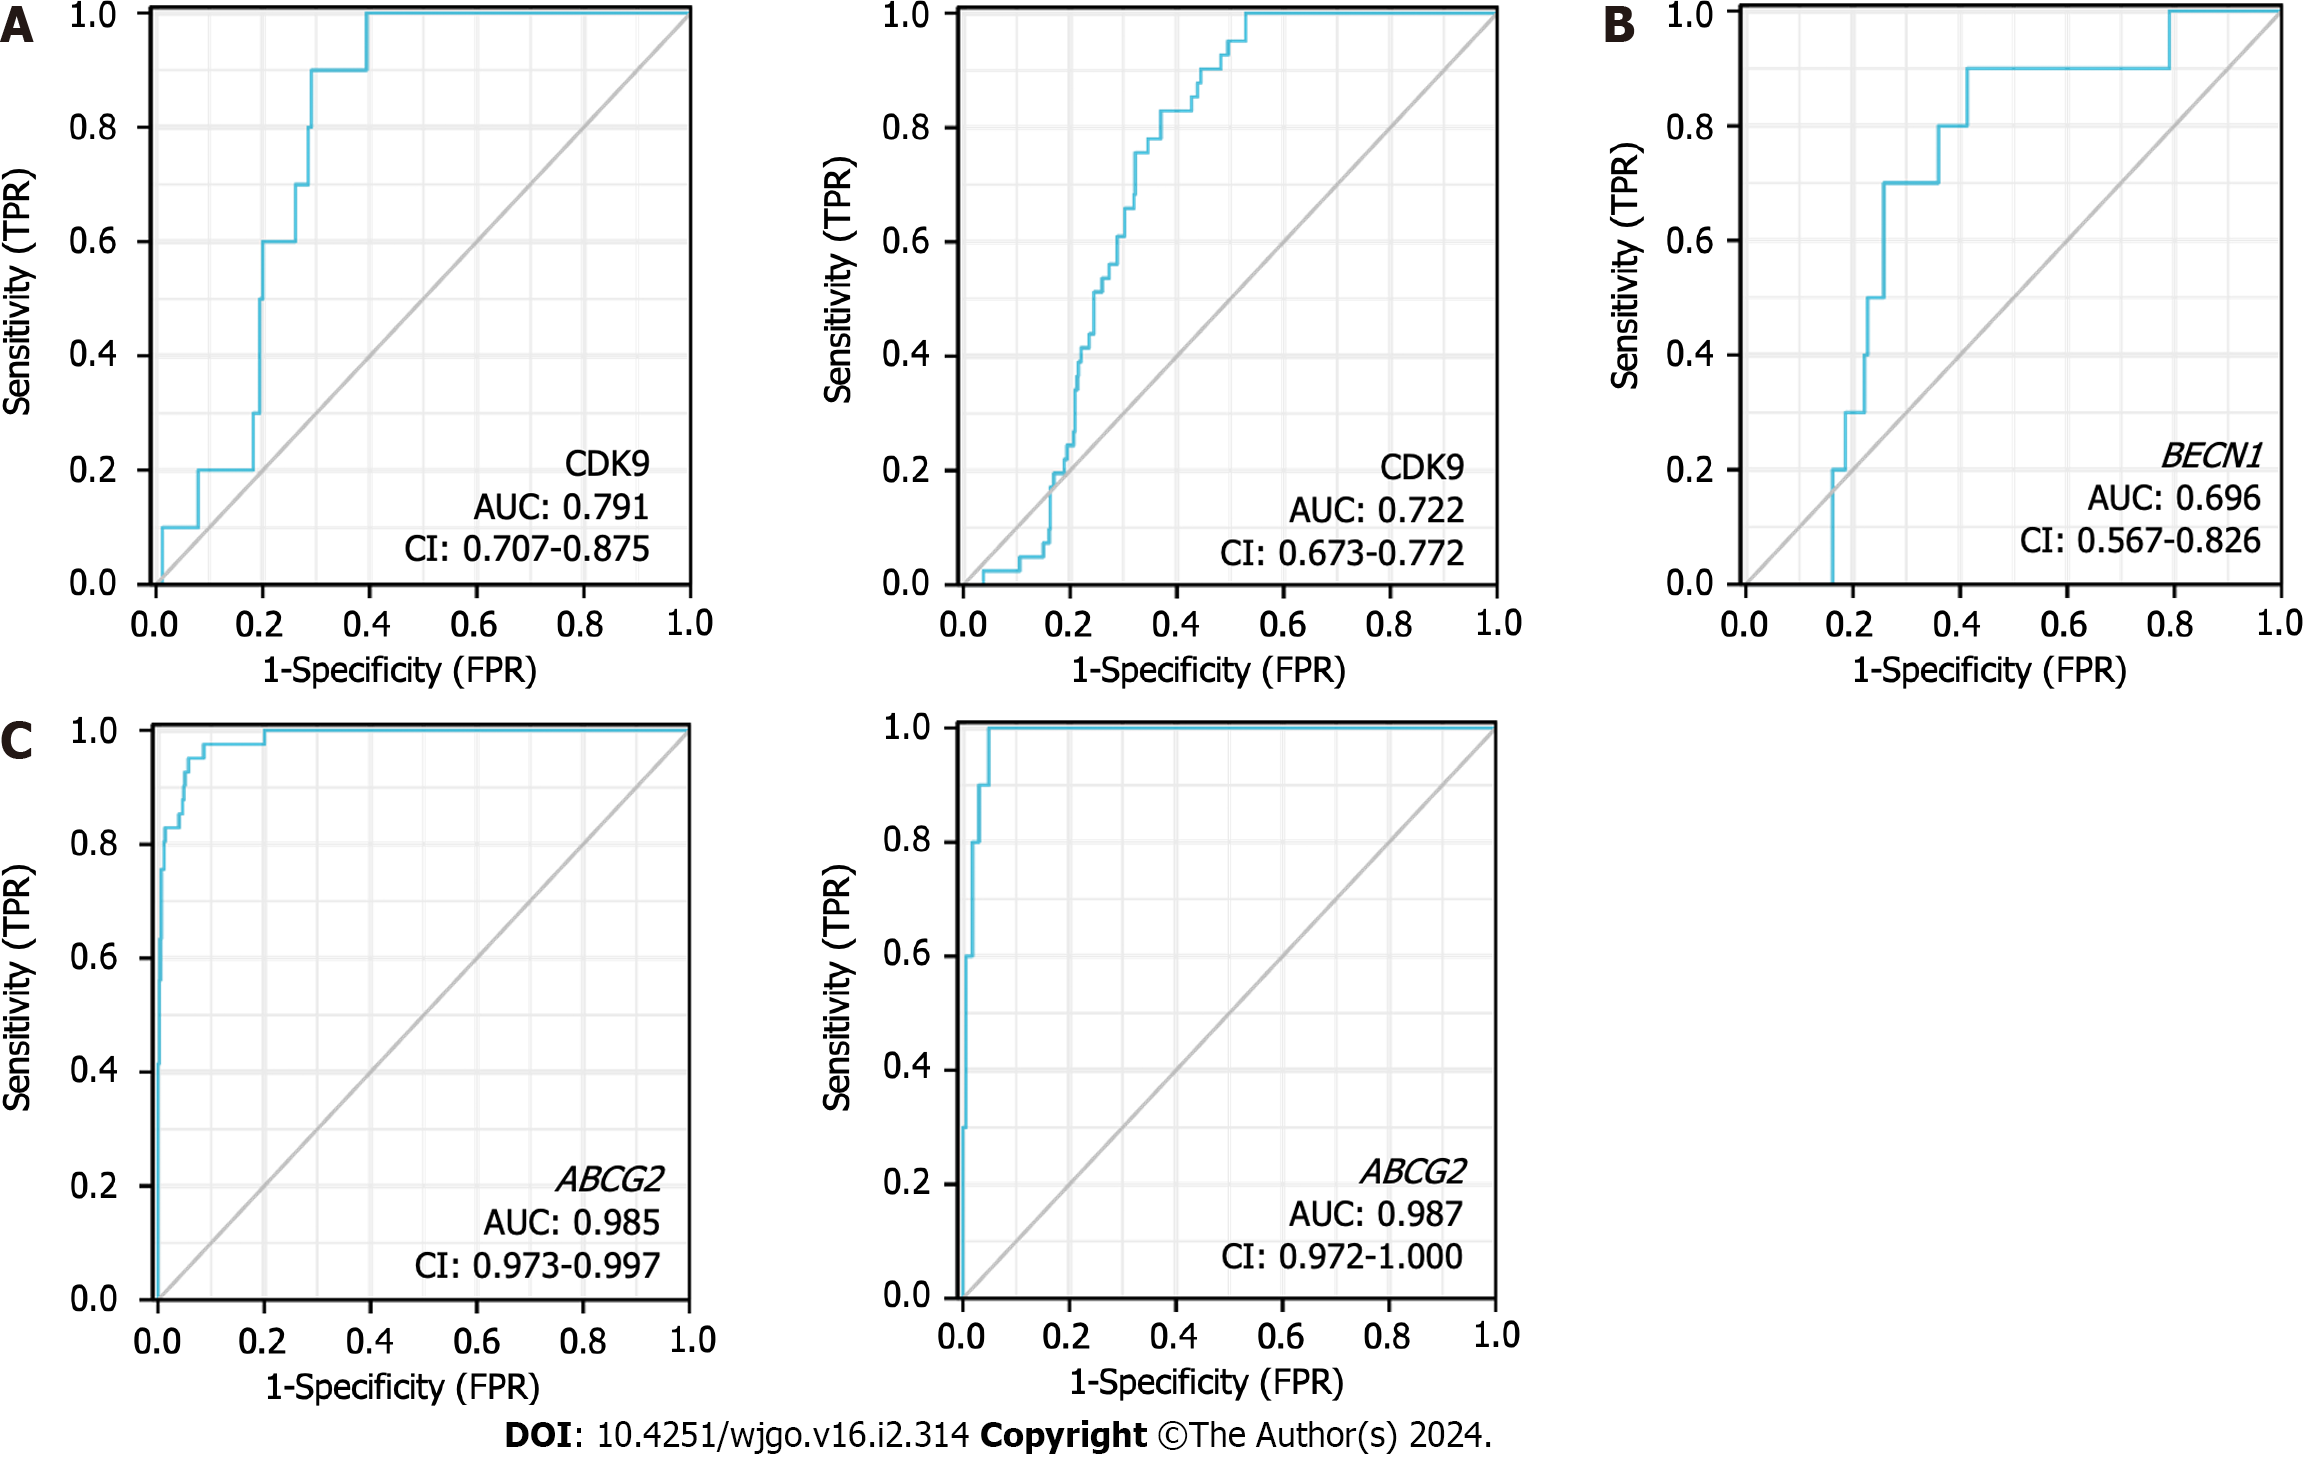
Figure 6 Receiver operating characteristic curves of colorectal cancer patients.
A: Receiver operating characteristic (ROC) curves showed the accuracy of predicting the prognosis of rectal cancer (left figure) and colon cancer (right figure) by cyclin-dependent kinase 9 (CDK9) expression level; B: ROC curves showed the accuracy of the expression levels of BECN1 in predicting the prognosis of rectal cancer; C: ROC curves showed the accuracy of predicting the prognosis in colon cancer (left figure) and rectal cancer (right figure) by the expression levels of ABCG2. CDK9: Cyclin-dependent kinase 9; AUC: Area under the curve; FPR: False positive rate; TPR: True positive rate.
- Citation: Zheng L, Lu J, Kong DL. Expression of cyclin-dependent kinase 9 is positively correlated with the autophagy level in colon cancer. World J Gastrointest Oncol 2024; 16(2): 314-330
- URL: https://www.wjgnet.com/1948-5204/full/v16/i2/314.htm
- DOI: https://dx.doi.org/10.4251/wjgo.v16.i2.314


