Copyright
©The Author(s) 2024.
World J Gastrointest Oncol. Dec 15, 2024; 16(12): 4728-4737
Published online Dec 15, 2024. doi: 10.4251/wjgo.v16.i12.4728
Published online Dec 15, 2024. doi: 10.4251/wjgo.v16.i12.4728
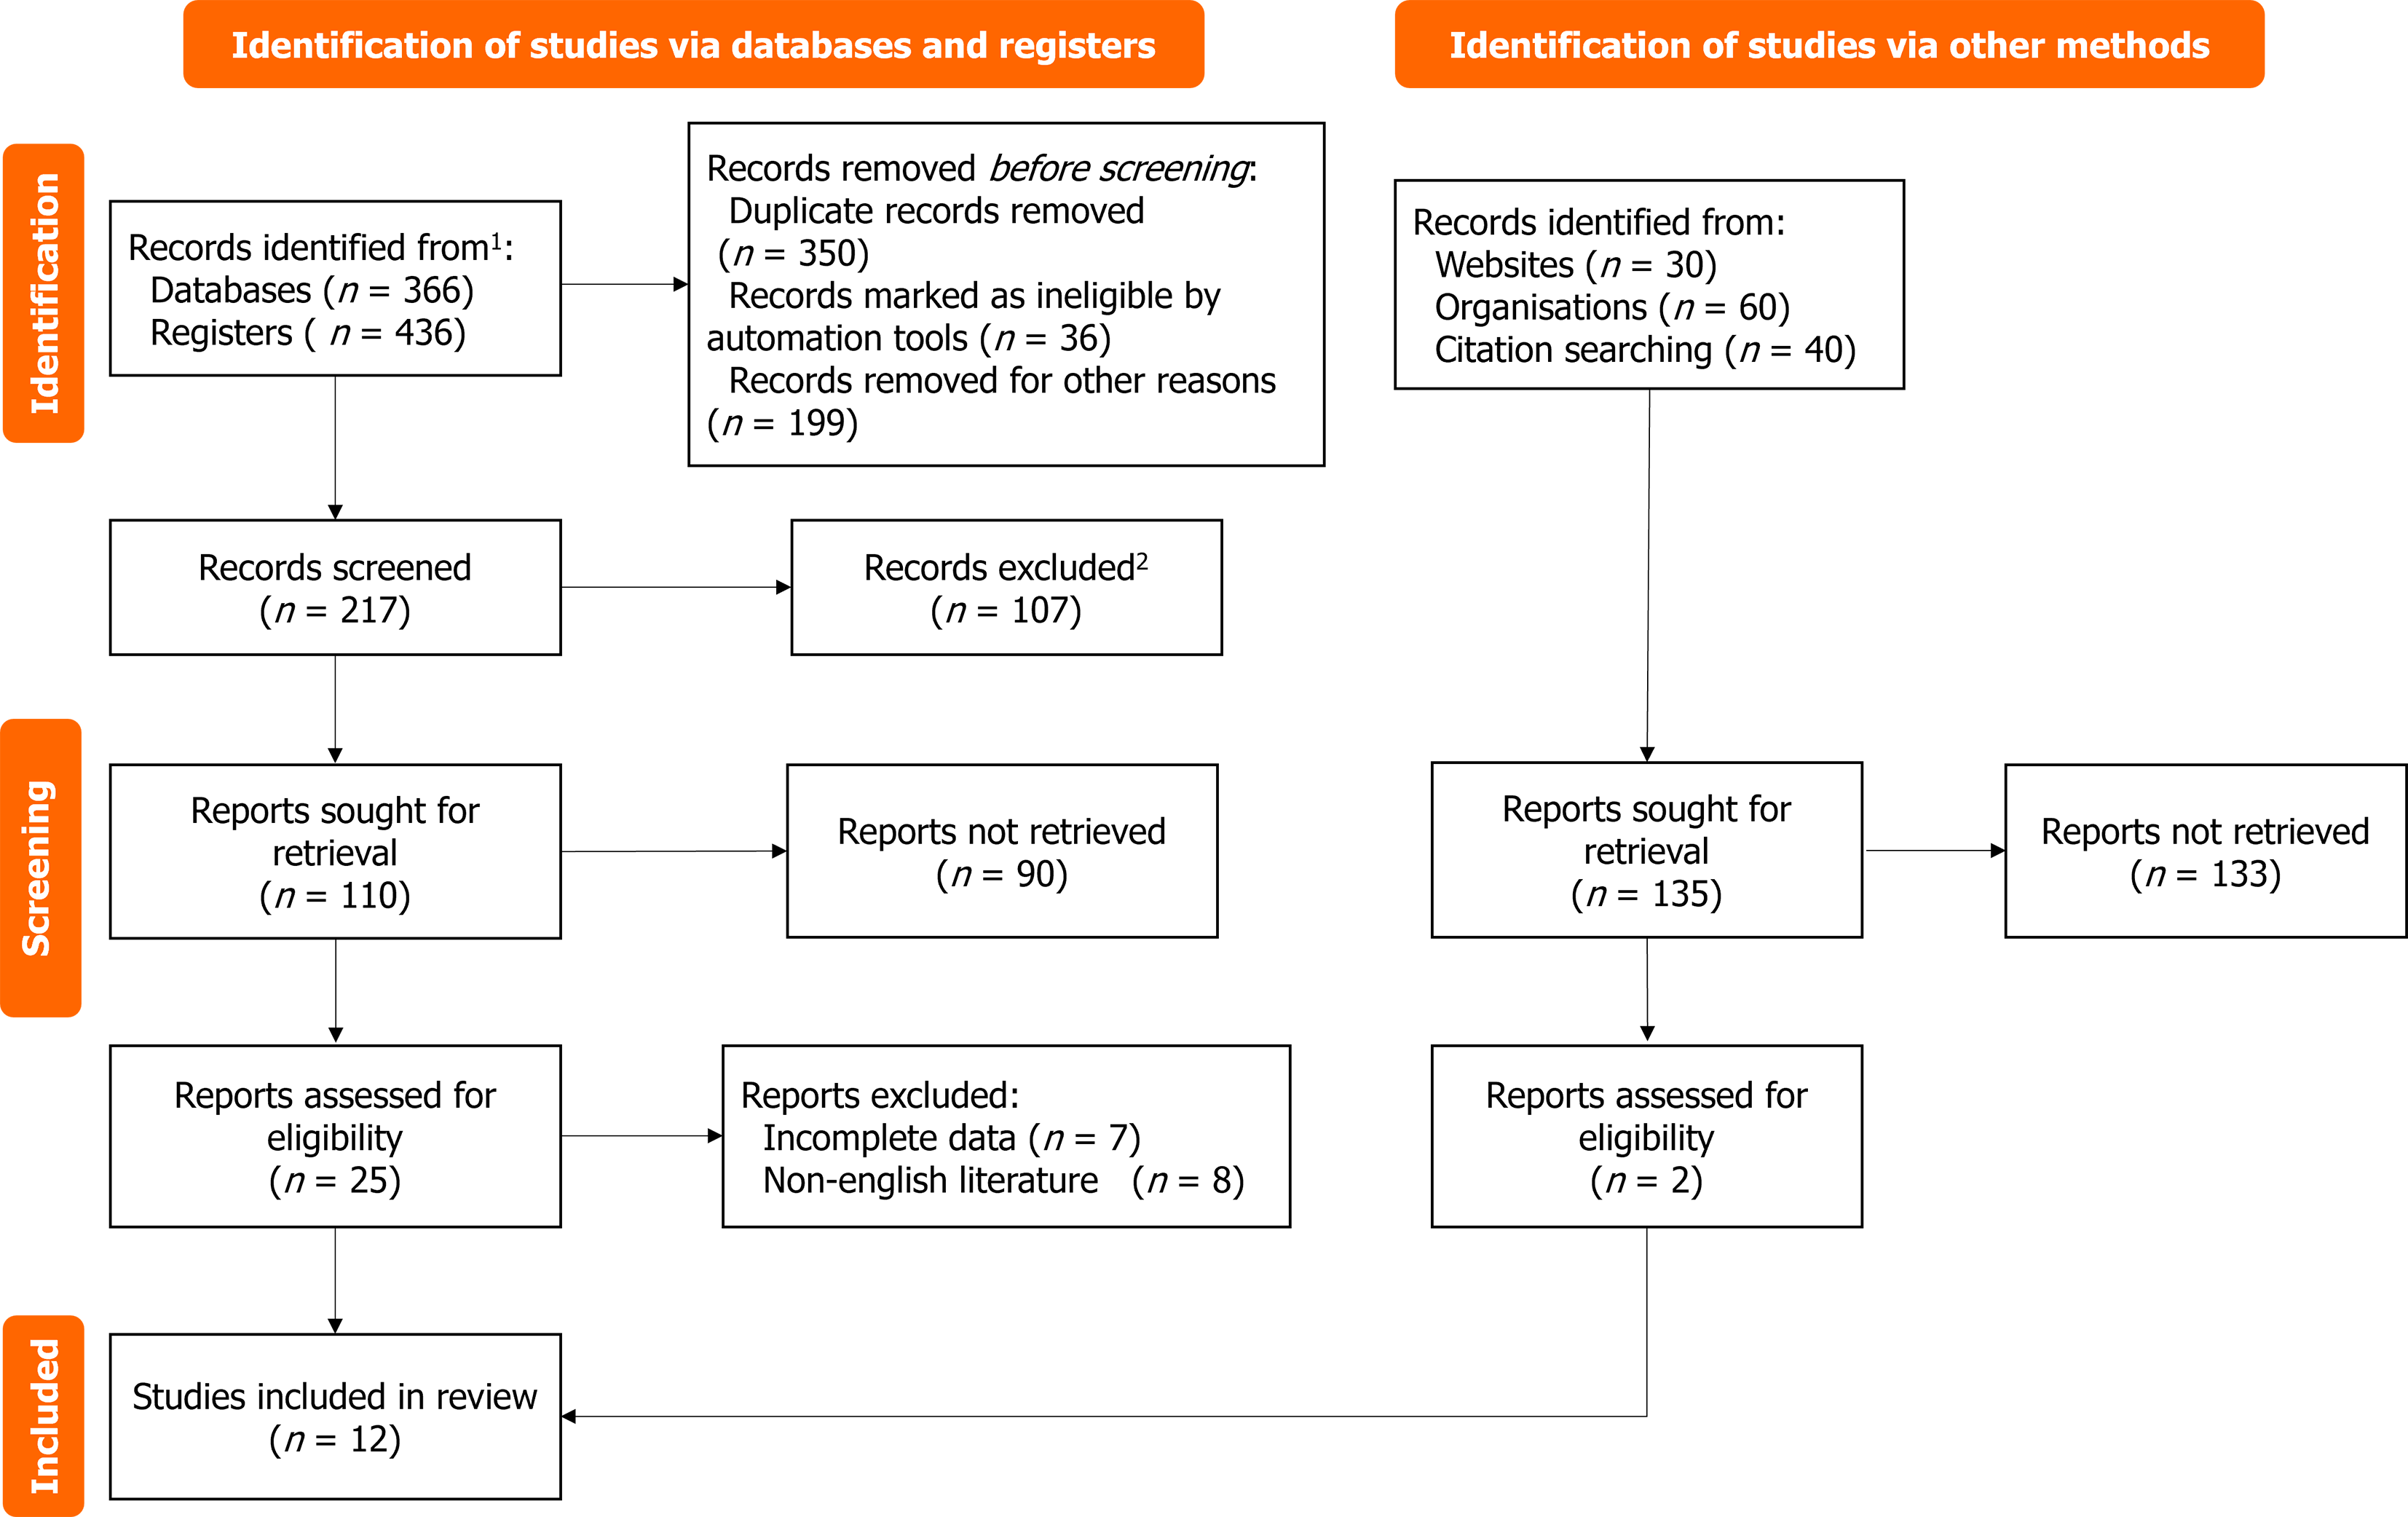
Figure 1 Document screening flow chart.
1Consider, if feasible to do so, reporting the number of records identified from each database or register searched (rather than the total number across all databases/registers). 2If automation tools were used, indicate how many records were excluded by a human and how many were excluded by automation tools.
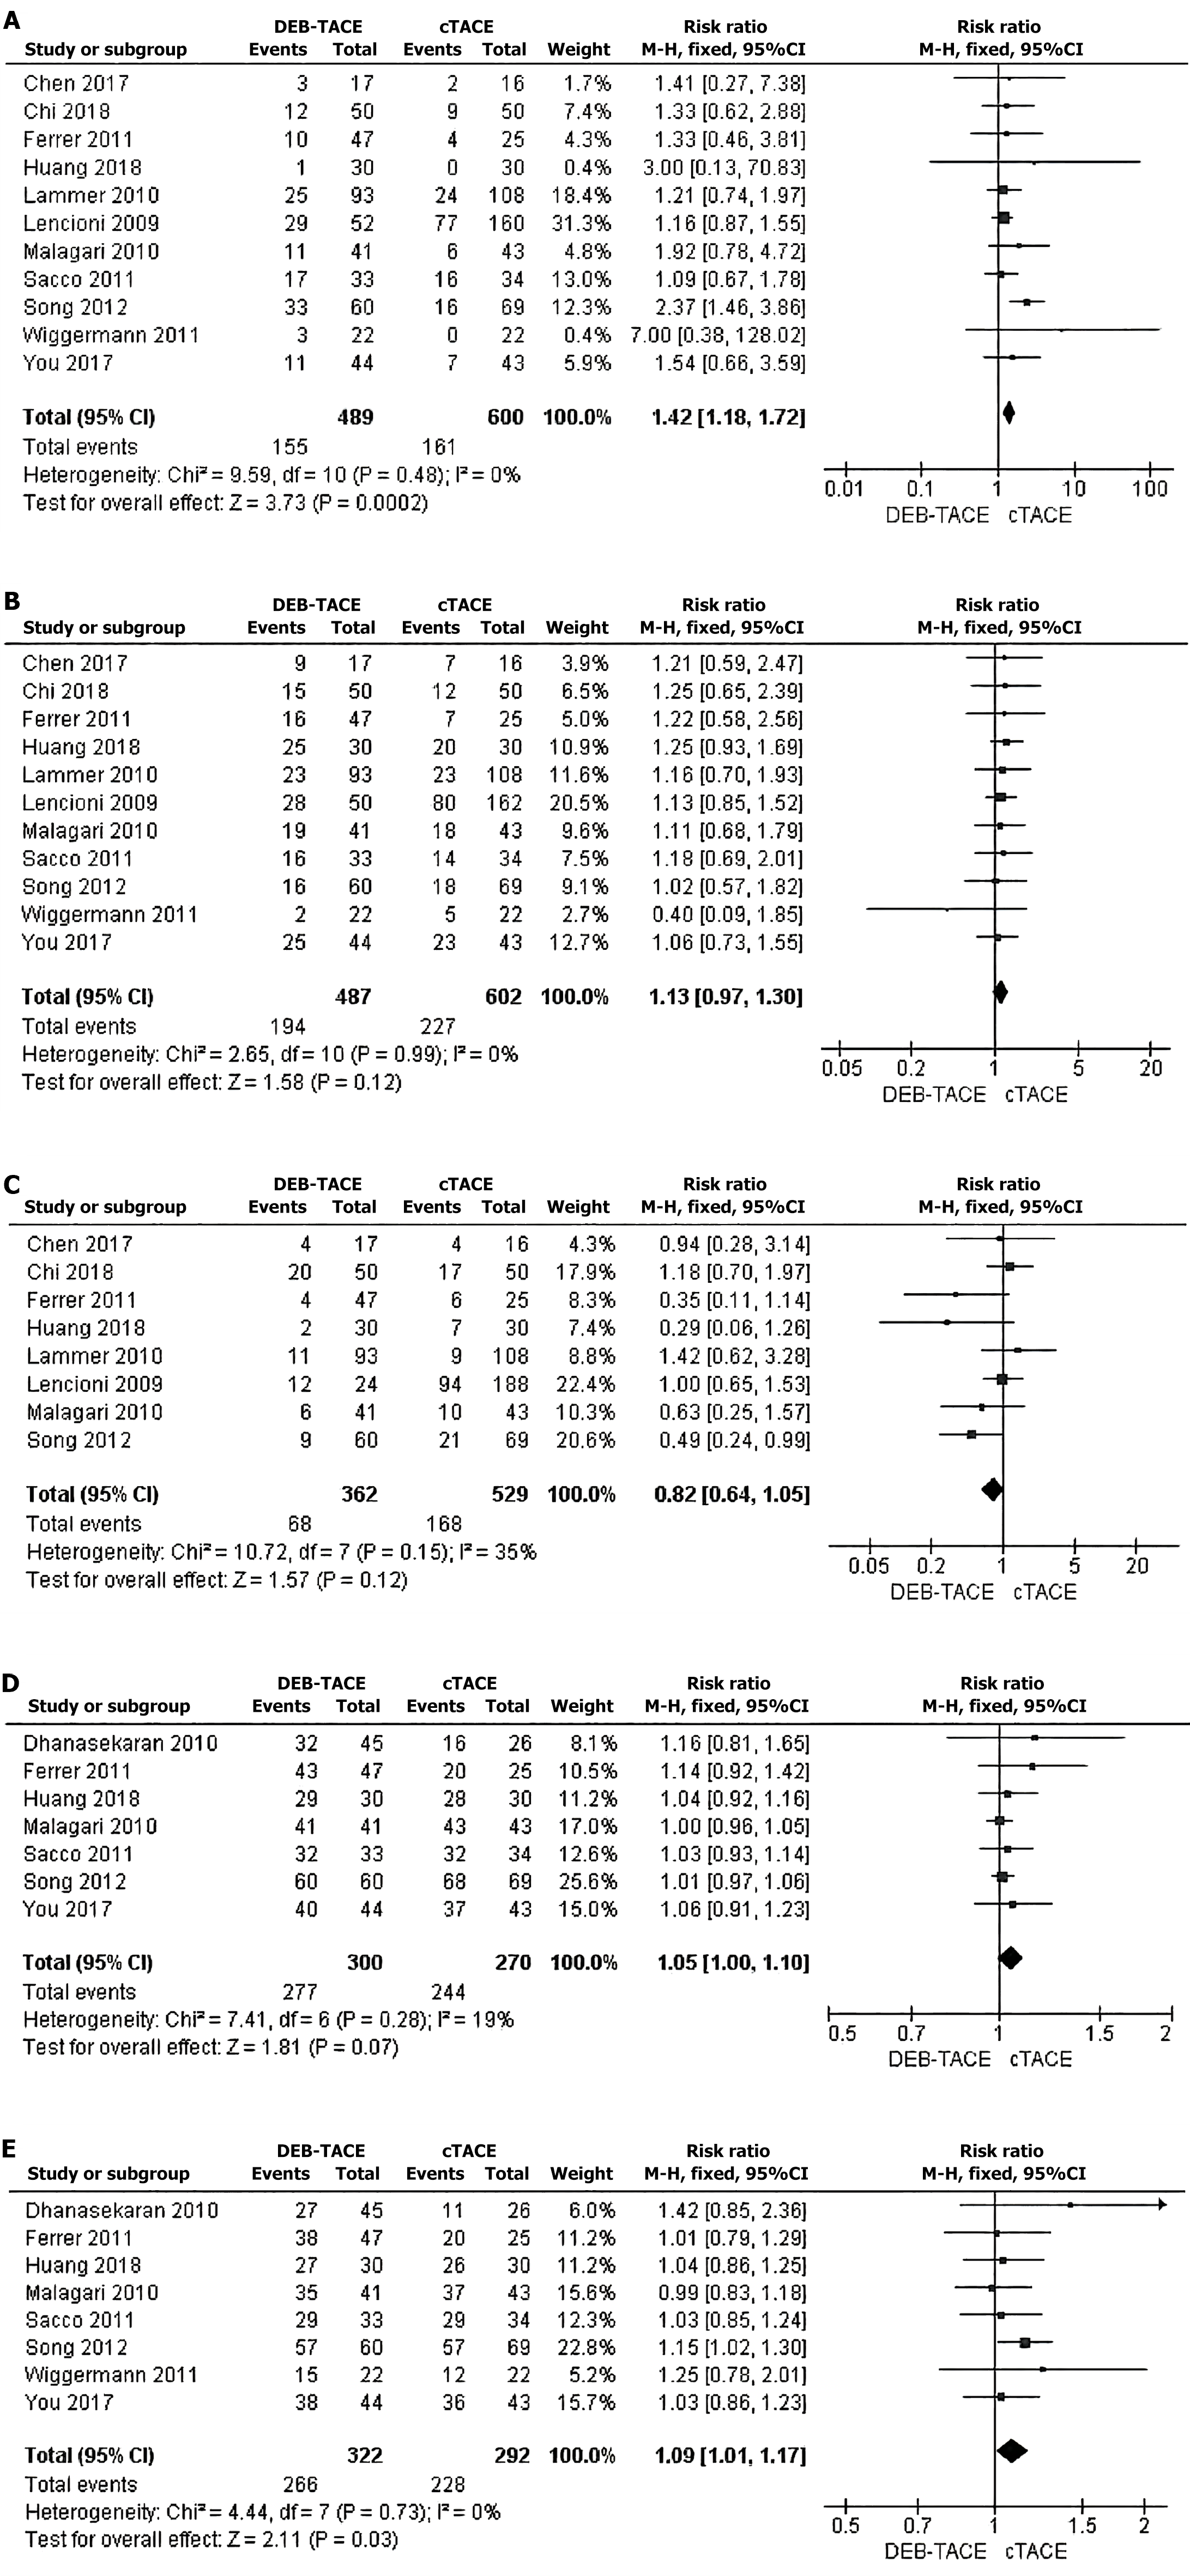
Figure 2 Meta-analysis.
A-C: Meta-analysis of postoperative complete response between drug-luting beads-transhepatic arterial chemoembolization (DEB-TACE) and conventional transhepatic arterial chemoembolization (cTACE); D: A meta-analysis of 6-month survival rates between DEB-TACE and cTACE; E: A meta-analysis of 12-month survival after DEB-TACE and cTACE. DEB-TACE: Drug-luting beads-transhepatic arterial chemoembolization; cTACE: Conventional transhepatic arterial chemoembolization.
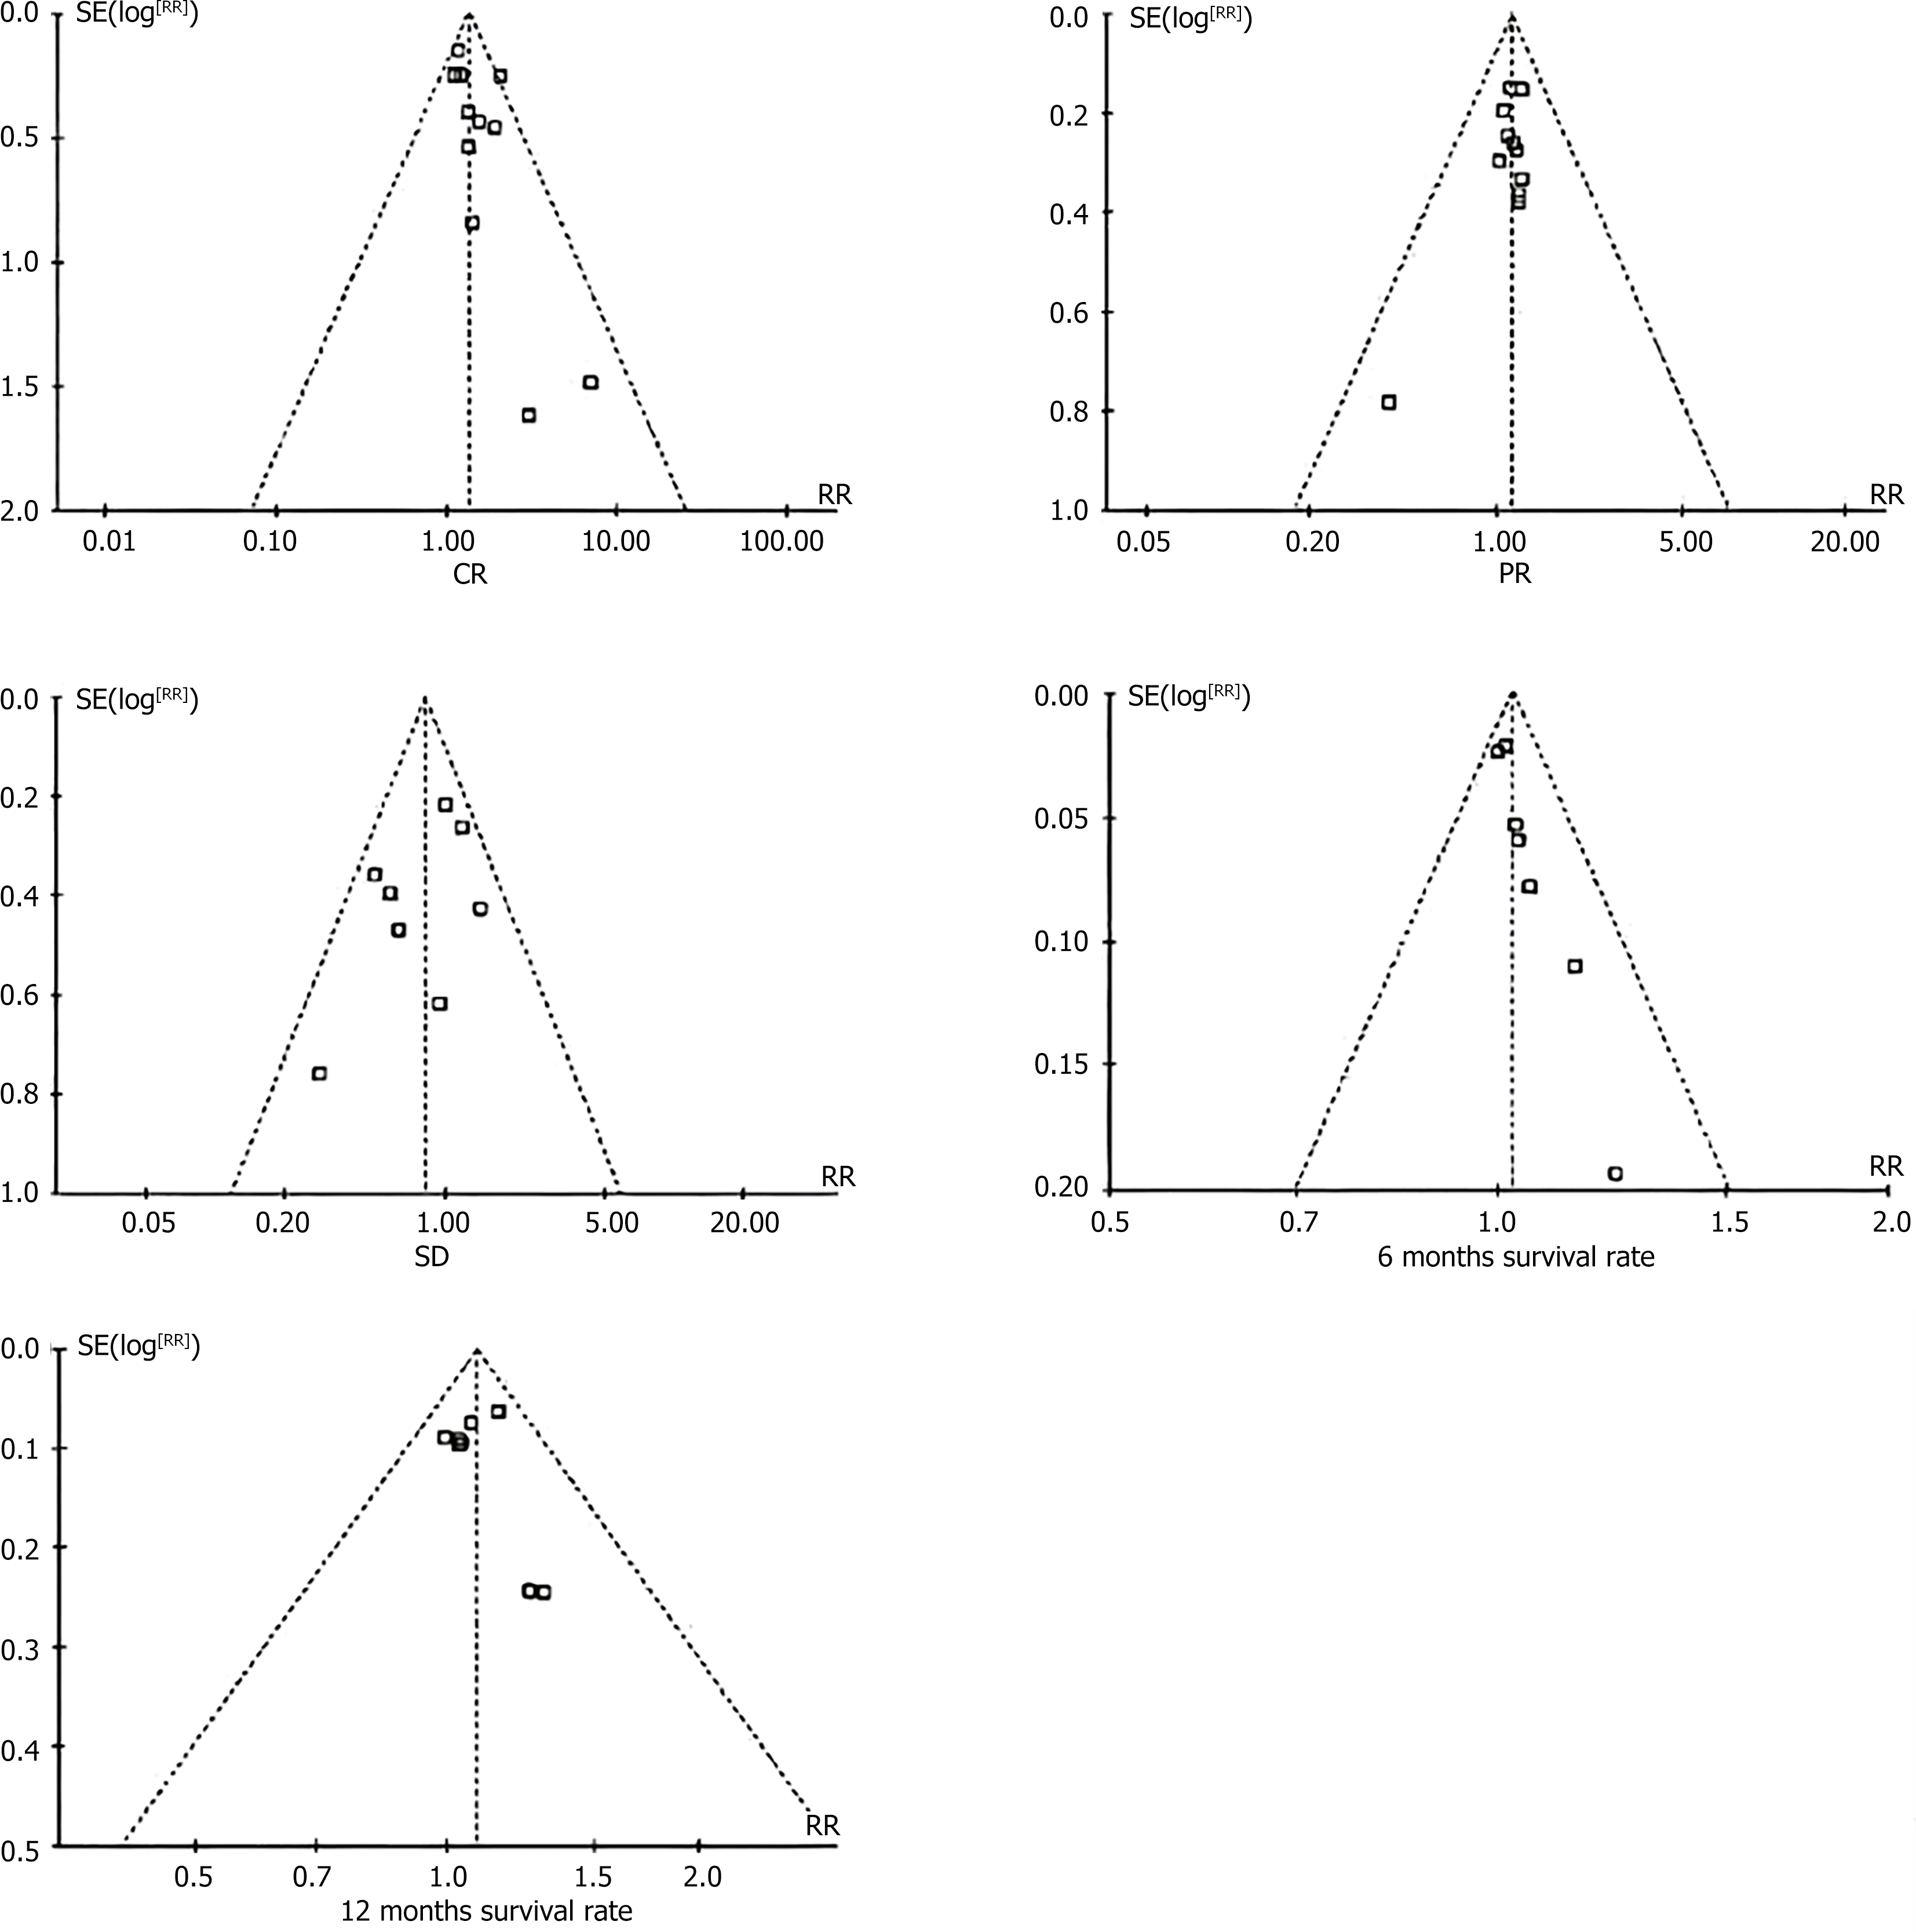
Figure 3 Funnel plot incorporating the results of the study.
CR: Complete response rate; PR: Partial response rate; SD: Stable disease.
- Citation: Deng J, Mi YH, Xie L, Sun XX, Liu DH, Long HJ, He LY, Wu DH, Shang HC. Efficacy and safety of transhepatic arterial chemoembolization with drug-loaded microspheres in unresectable primary liver cancer. World J Gastrointest Oncol 2024; 16(12): 4728-4737
- URL: https://www.wjgnet.com/1948-5204/full/v16/i12/4728.htm
- DOI: https://dx.doi.org/10.4251/wjgo.v16.i12.4728


