Copyright
©The Author(s) 2024.
World J Gastrointest Oncol. Nov 15, 2024; 16(11): 4489-4505
Published online Nov 15, 2024. doi: 10.4251/wjgo.v16.i11.4489
Published online Nov 15, 2024. doi: 10.4251/wjgo.v16.i11.4489
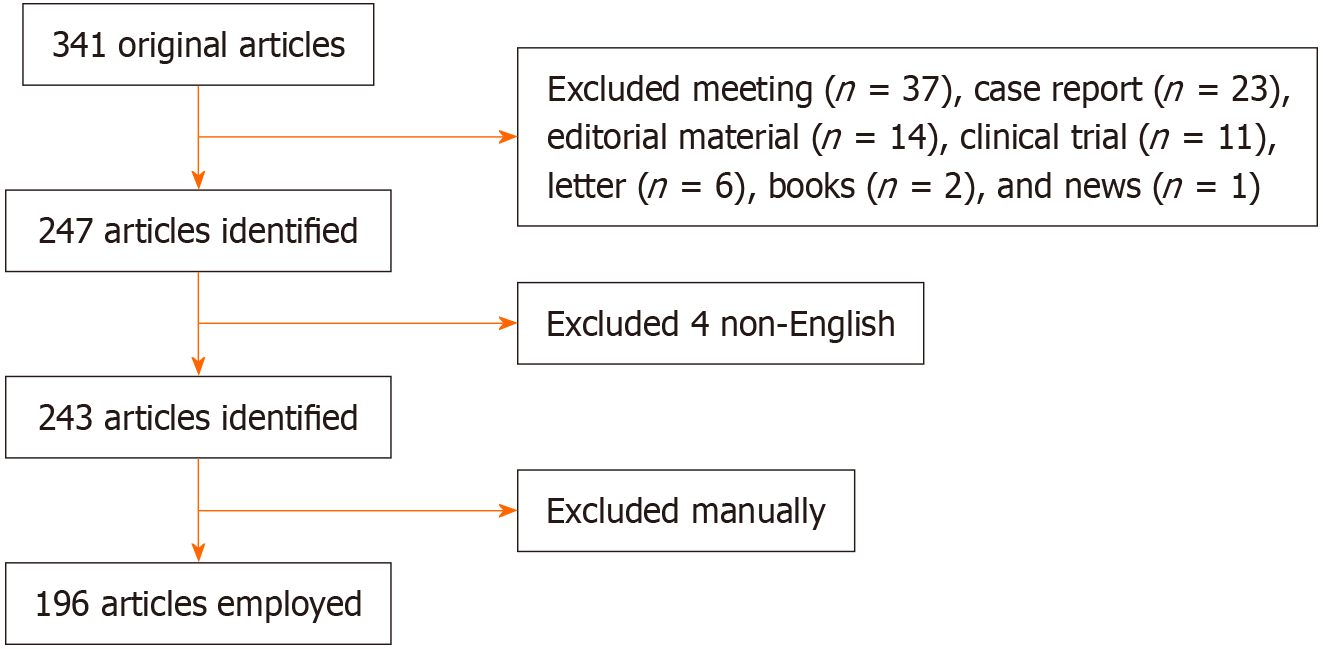
Figure 1 Flowchart of the screening process.
A total of 196 references extracted from the Web of Science Core Collection were used to perform a bibliometric analysis.
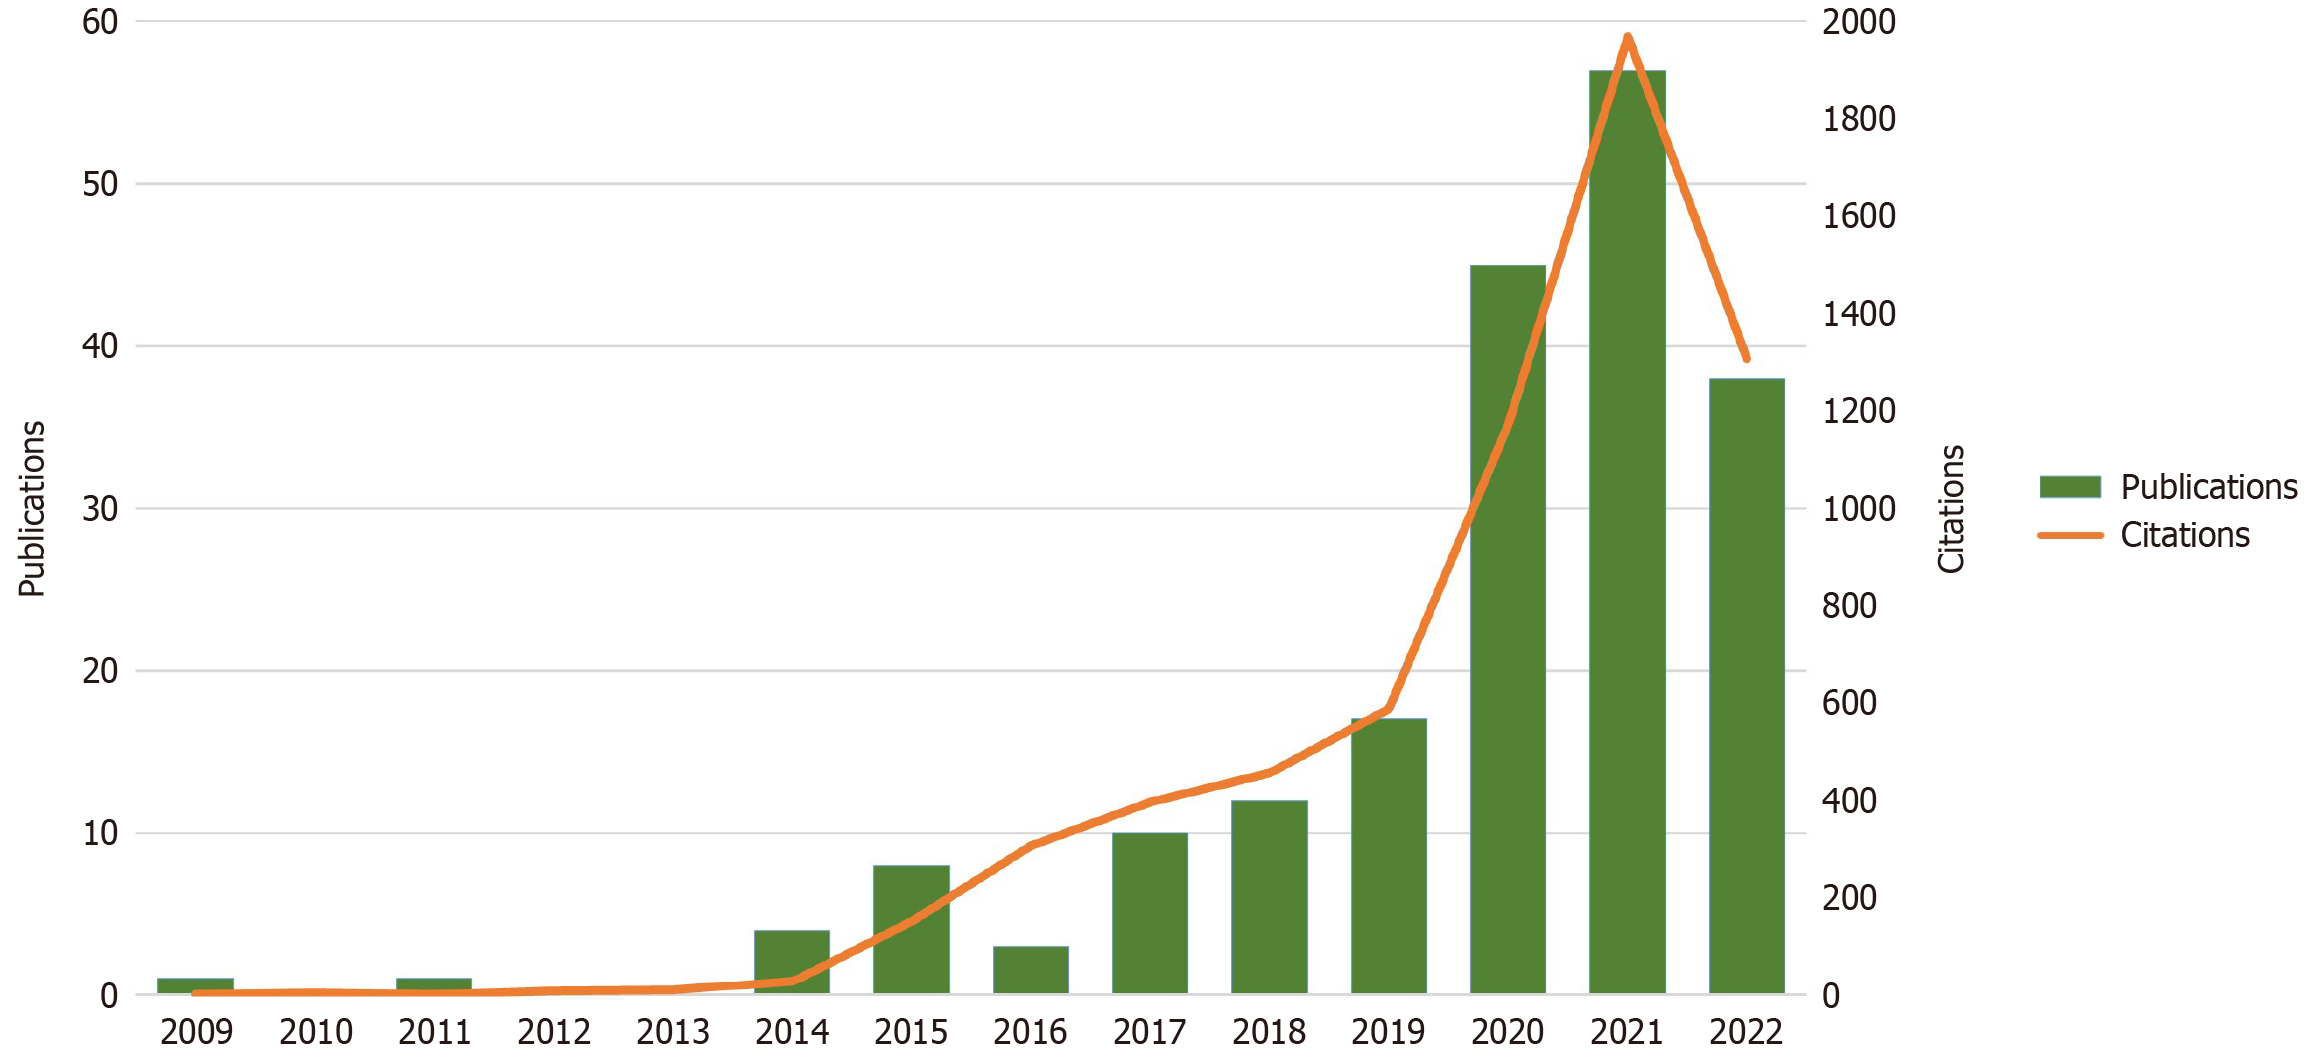
Figure 2 The number of papers published annually and the total number of citations of publications related to olaparib in pancreatic cancer.
The annual number of citations of publications, similar to the number of publications, showed an overall increasing trend.
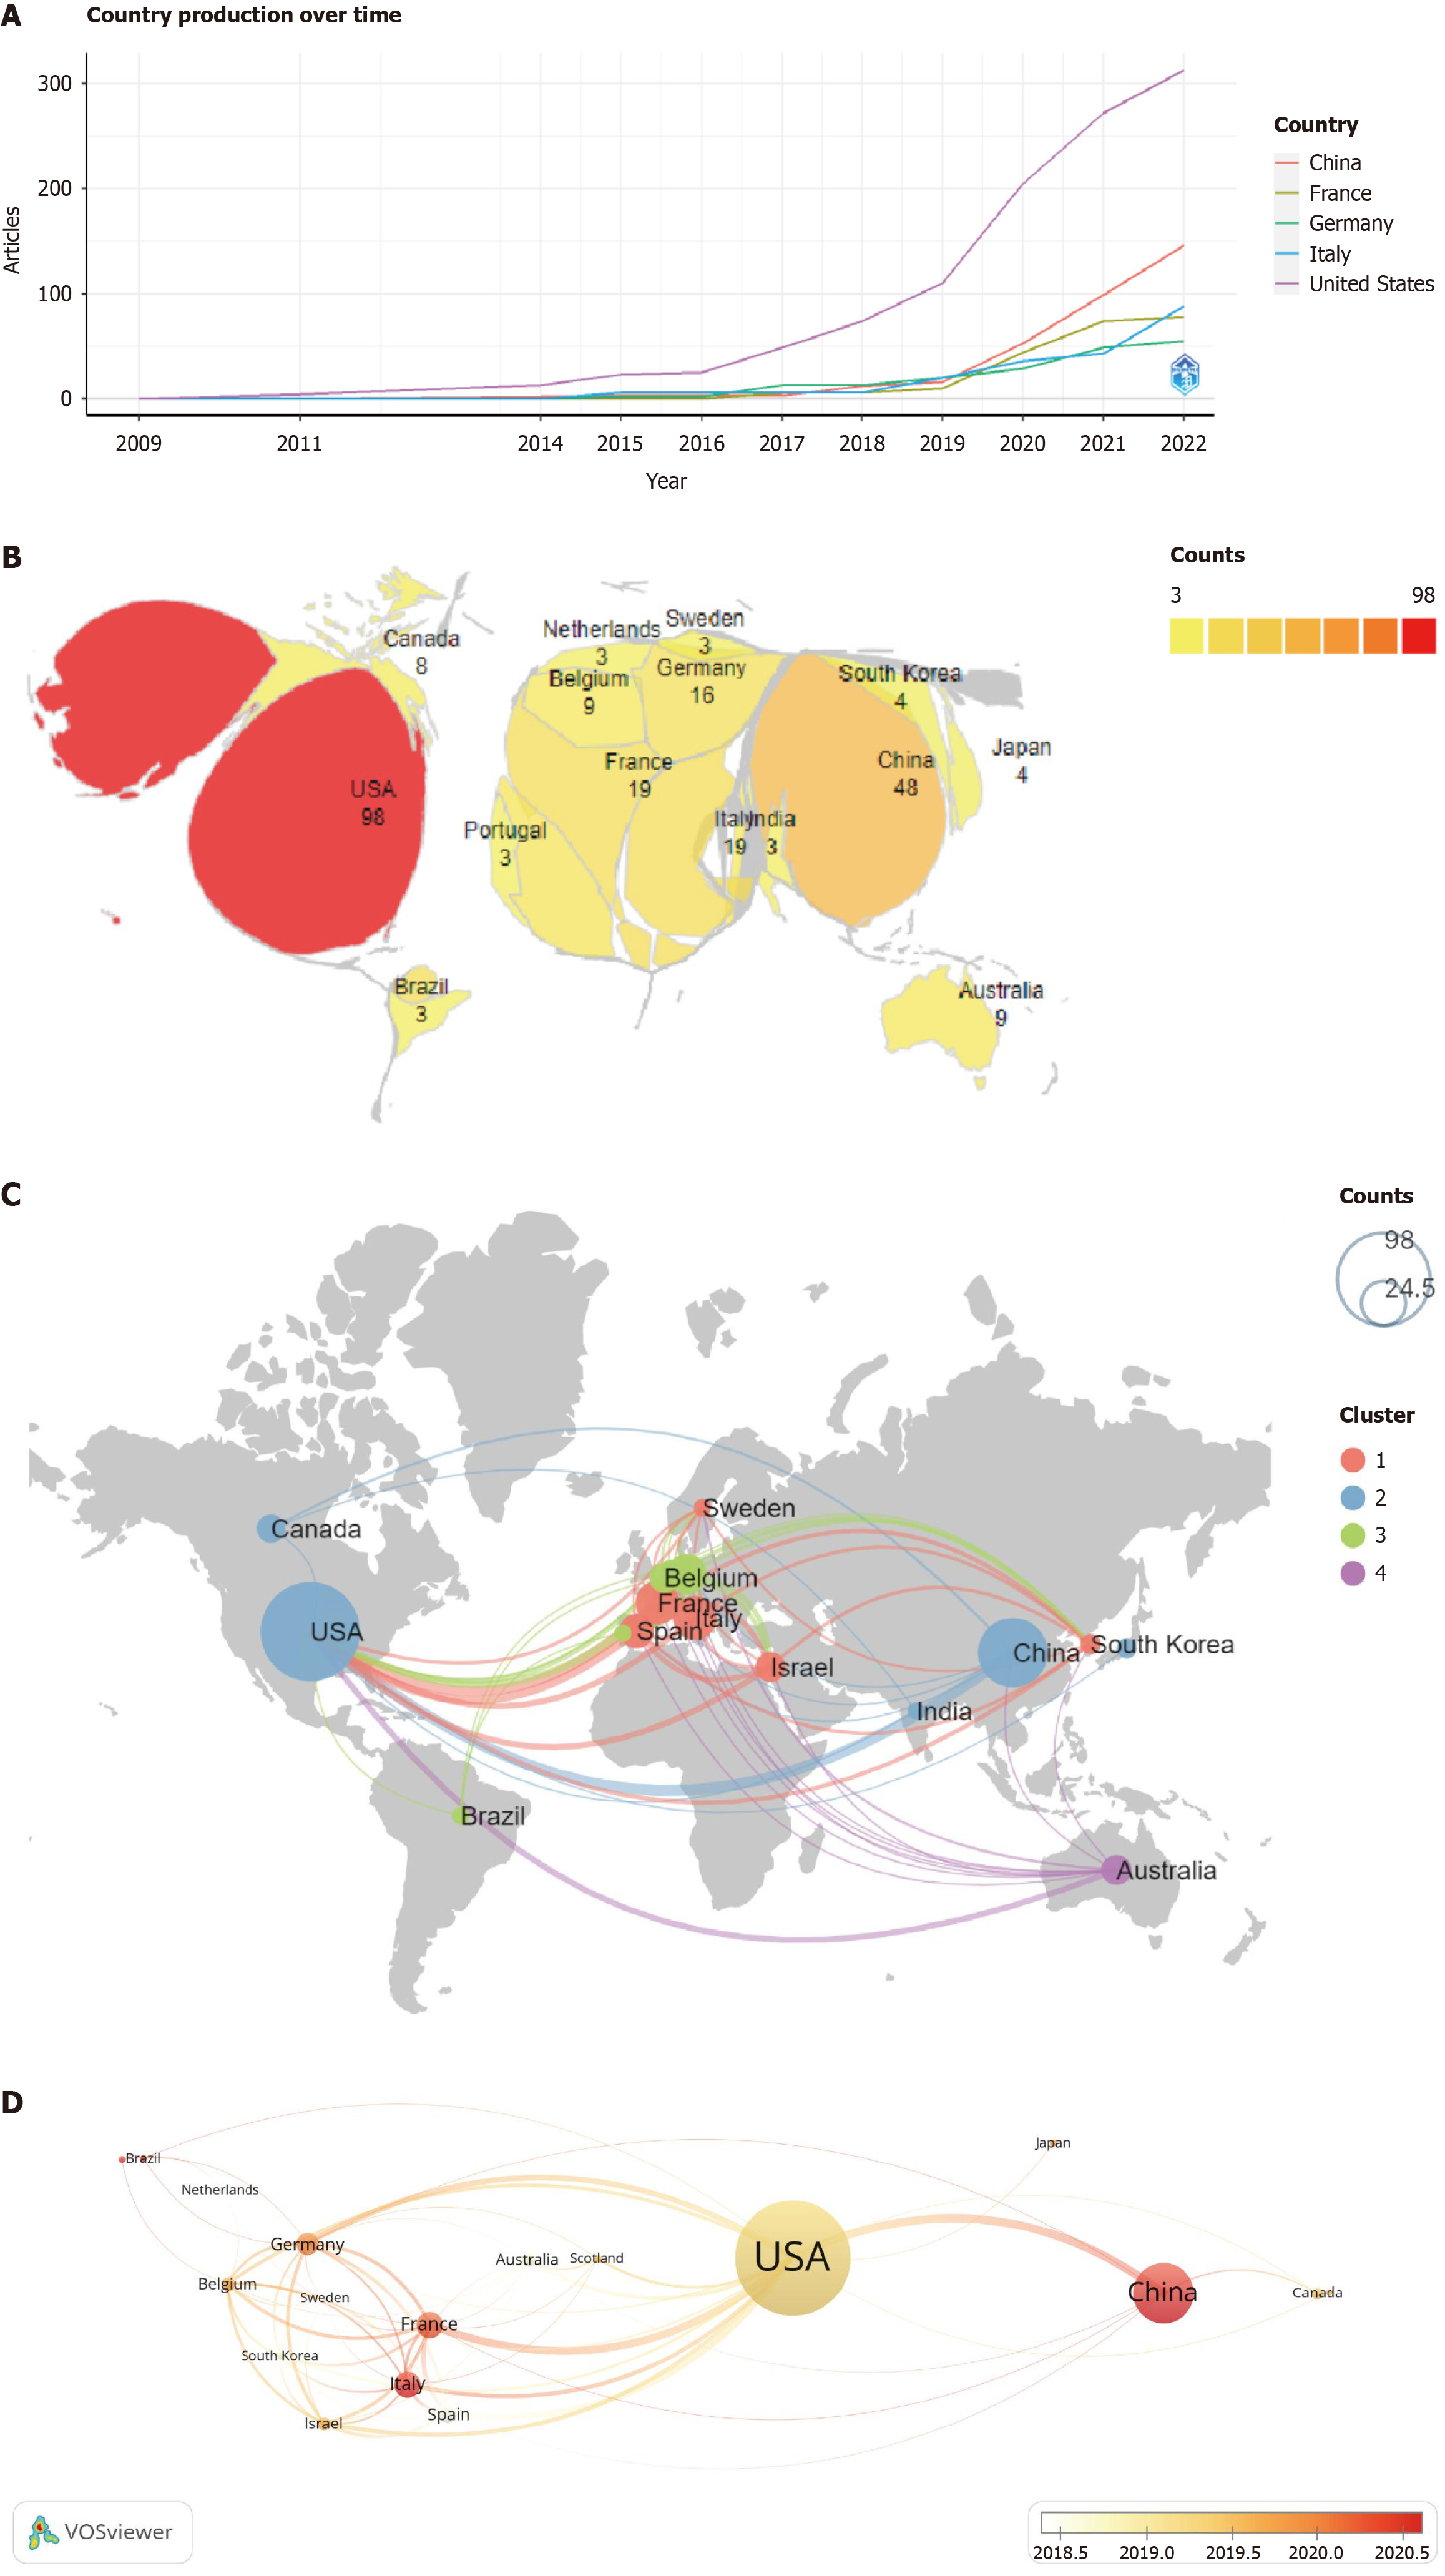
Figure 3 Analysis of countries/regions.
A: Countries’ production throughout the year; B: Deformed geographical distribution map of global productivity related to olaparib in pancreatic cancer. The area and color represent the number of publications; C: Geographical distribution map and collaboration map of publications related to olaparib in pancreatic cancer. Node size and color represent the number of publications; D: Global collaboration and time evolution of countries/regions in this field. The colors of the nodes represent the average number of publications annually.
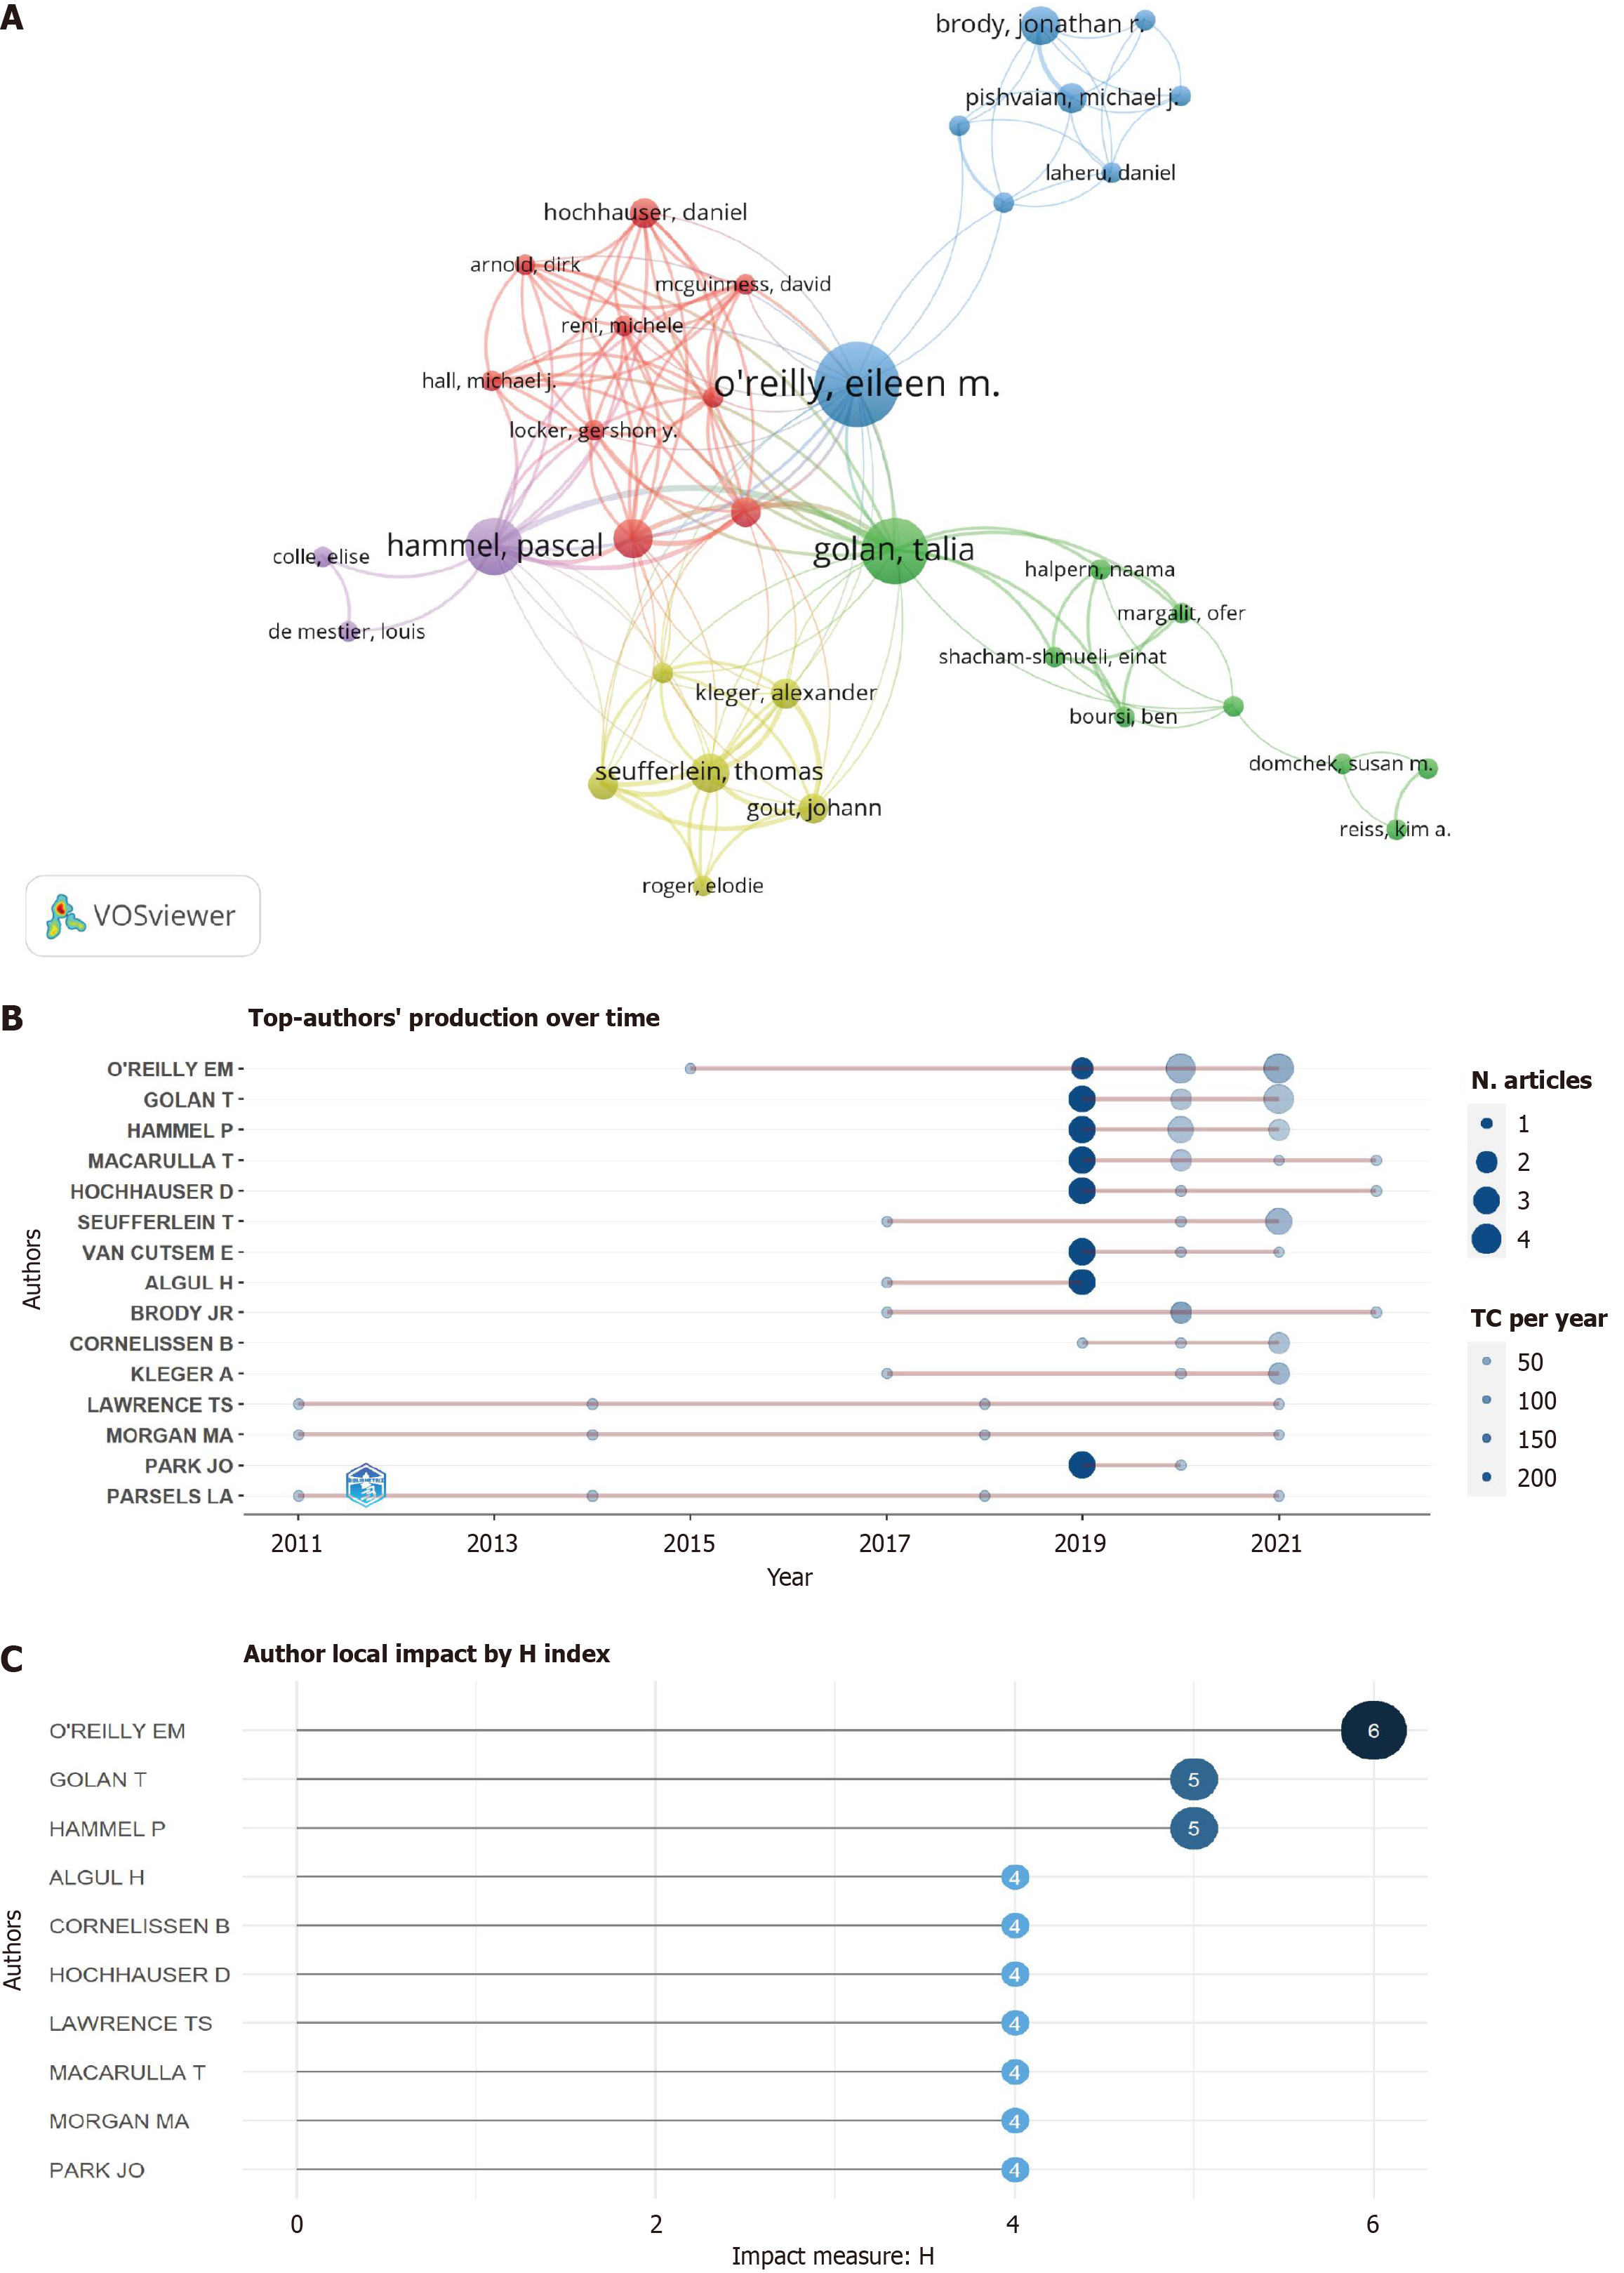
Figure 4 Illustrations of the collaborative network in olaparib and pancreatic cancer.
A: Cooperative network and cluster analysis of authors. The thickness of the line indicates the strength of cooperation; B: The top 15 authors’ production over time; C: Author local impact according to the H index.
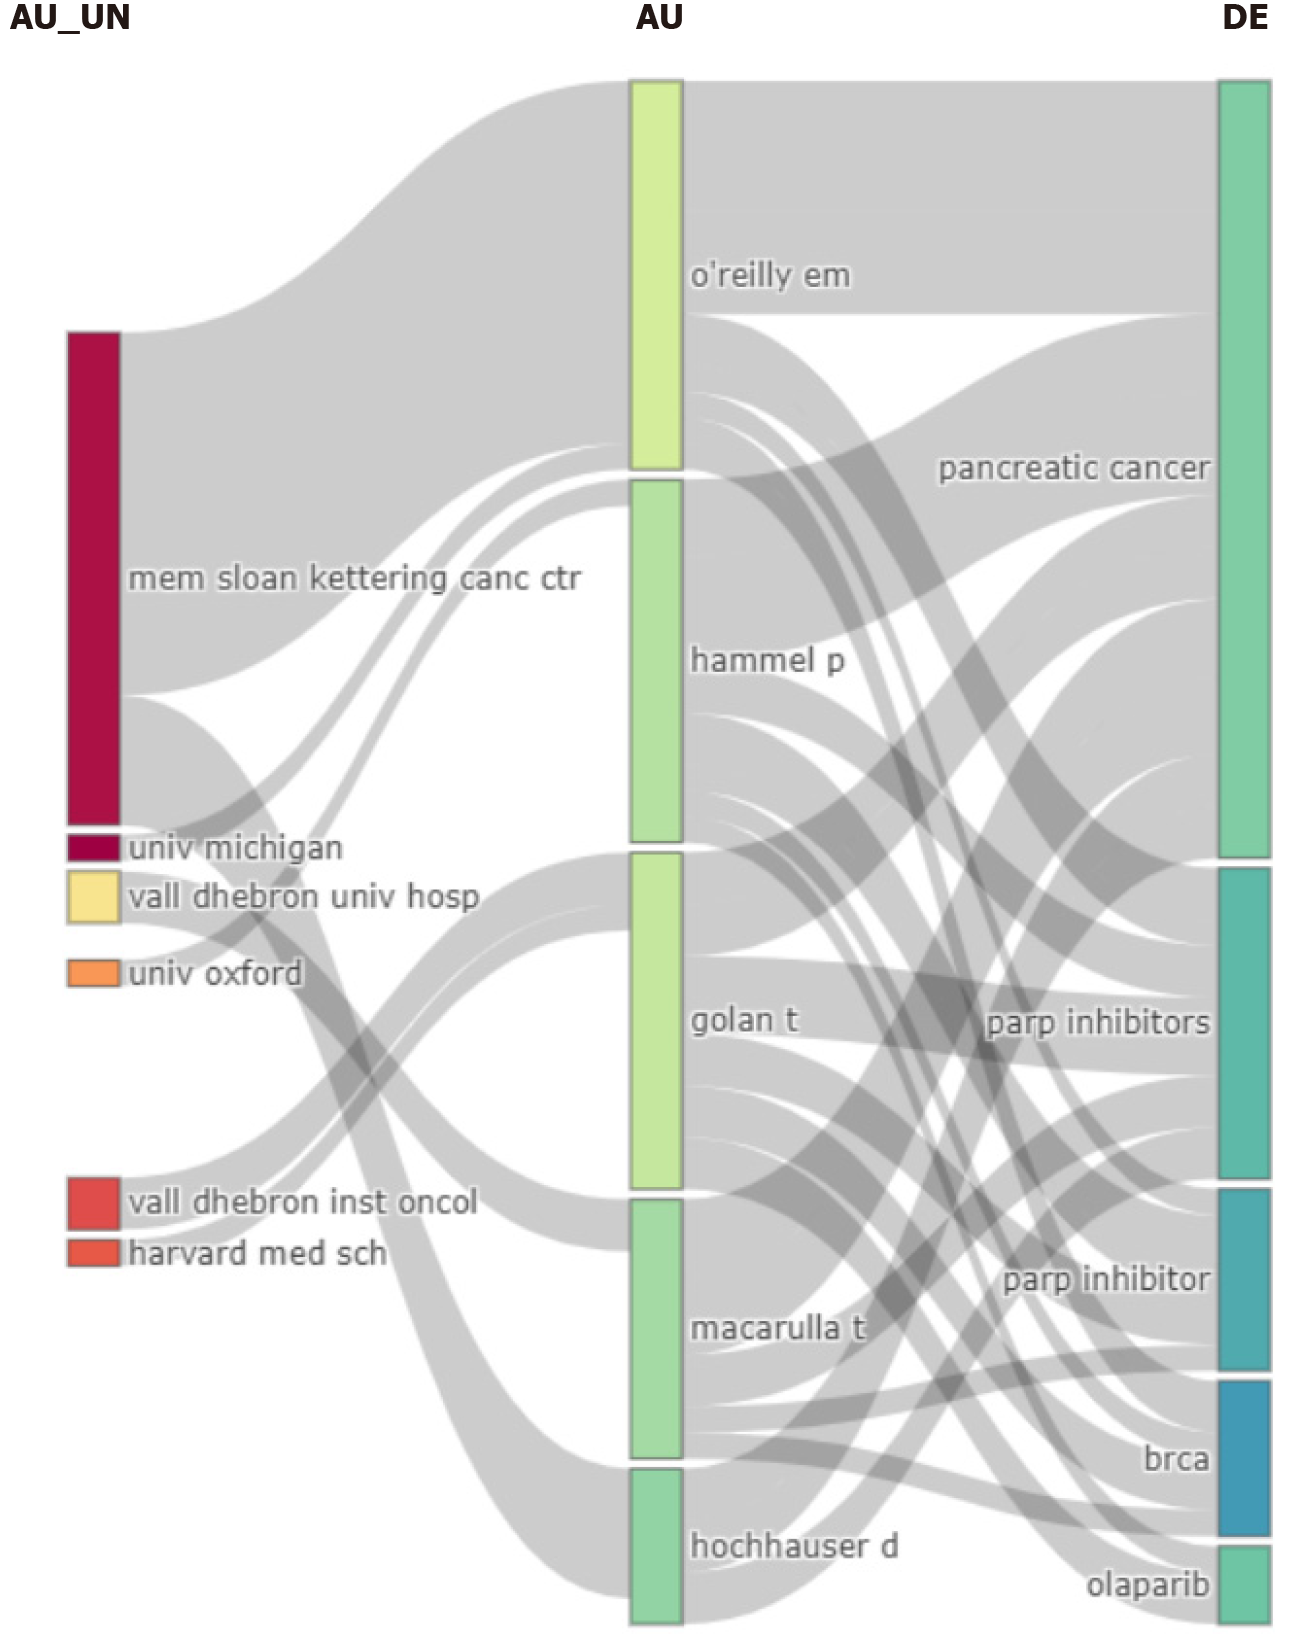
Figure 5 Relationships among institutions, authors, and keywords.
Three-field plot of institutions, authors, and keywords related to olaparib in pancreatic cancer.
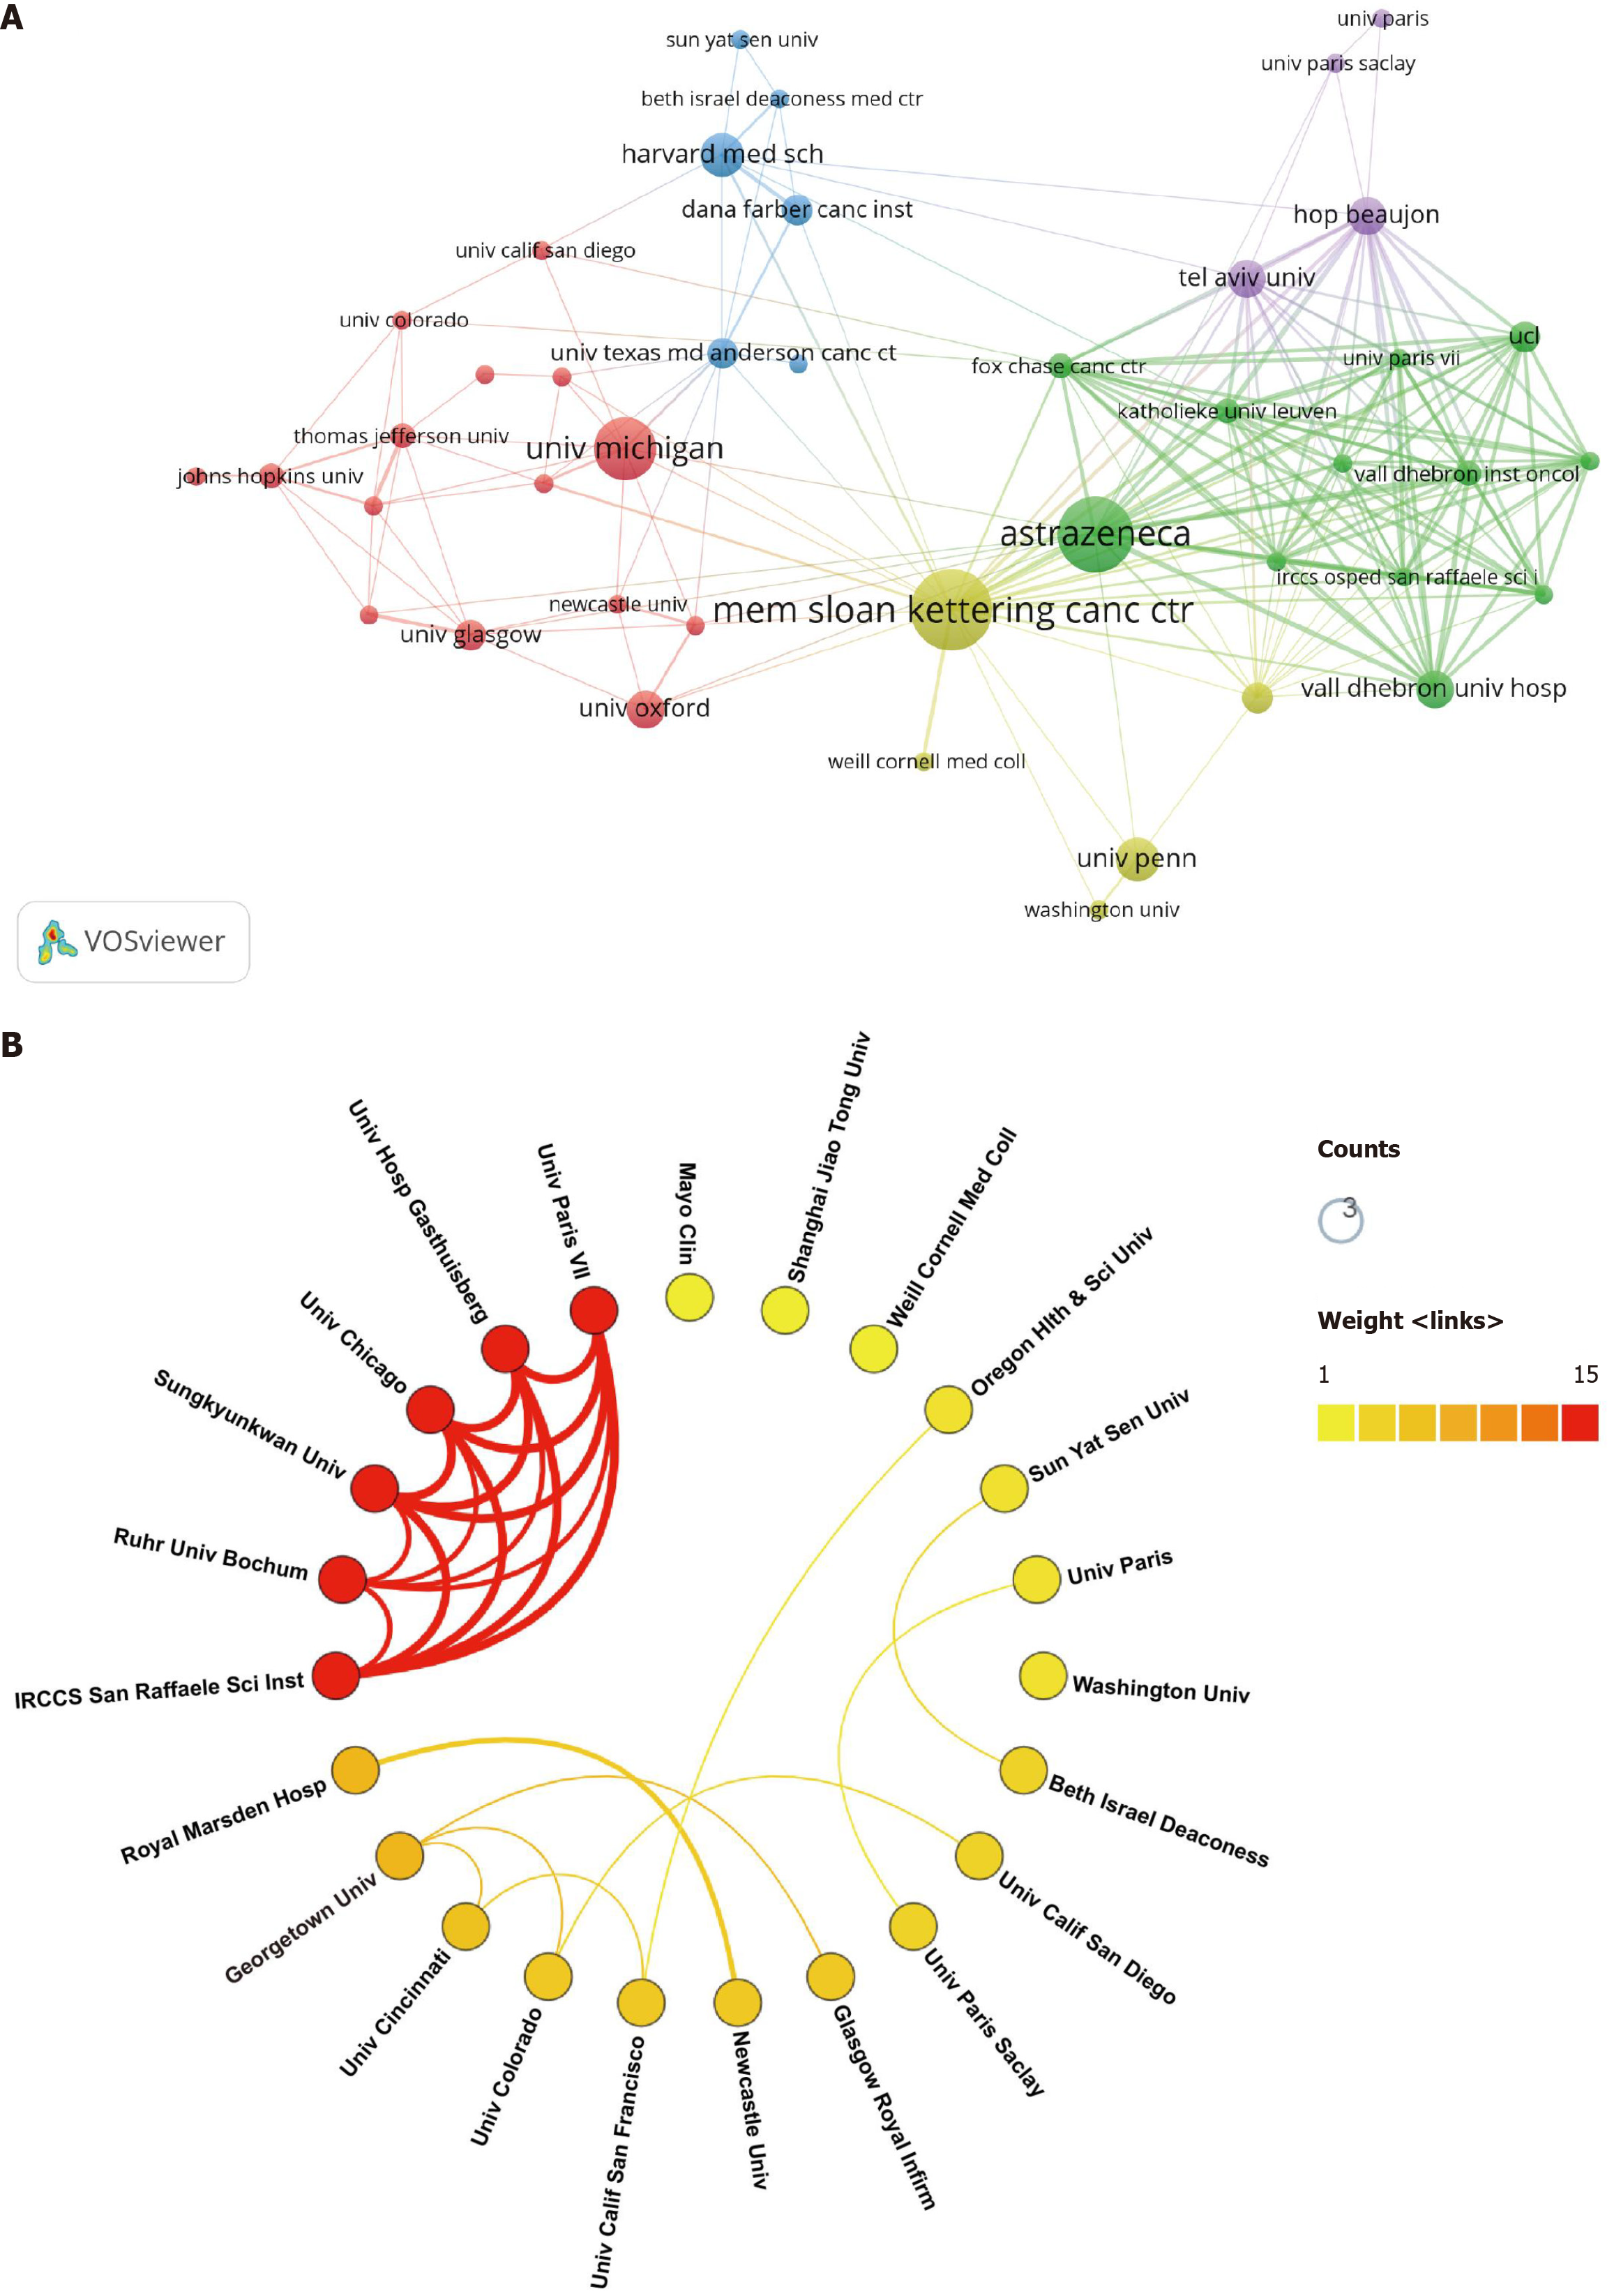
Figure 6 Illustrations of cluster analysis of cooperation among institutions and collaboration networks.
A: Visual cluster analysis of cooperation among institutions via VOSviewer; B: Cross-institution collaboration network. The color indicates the strength of cooperation between institutions.
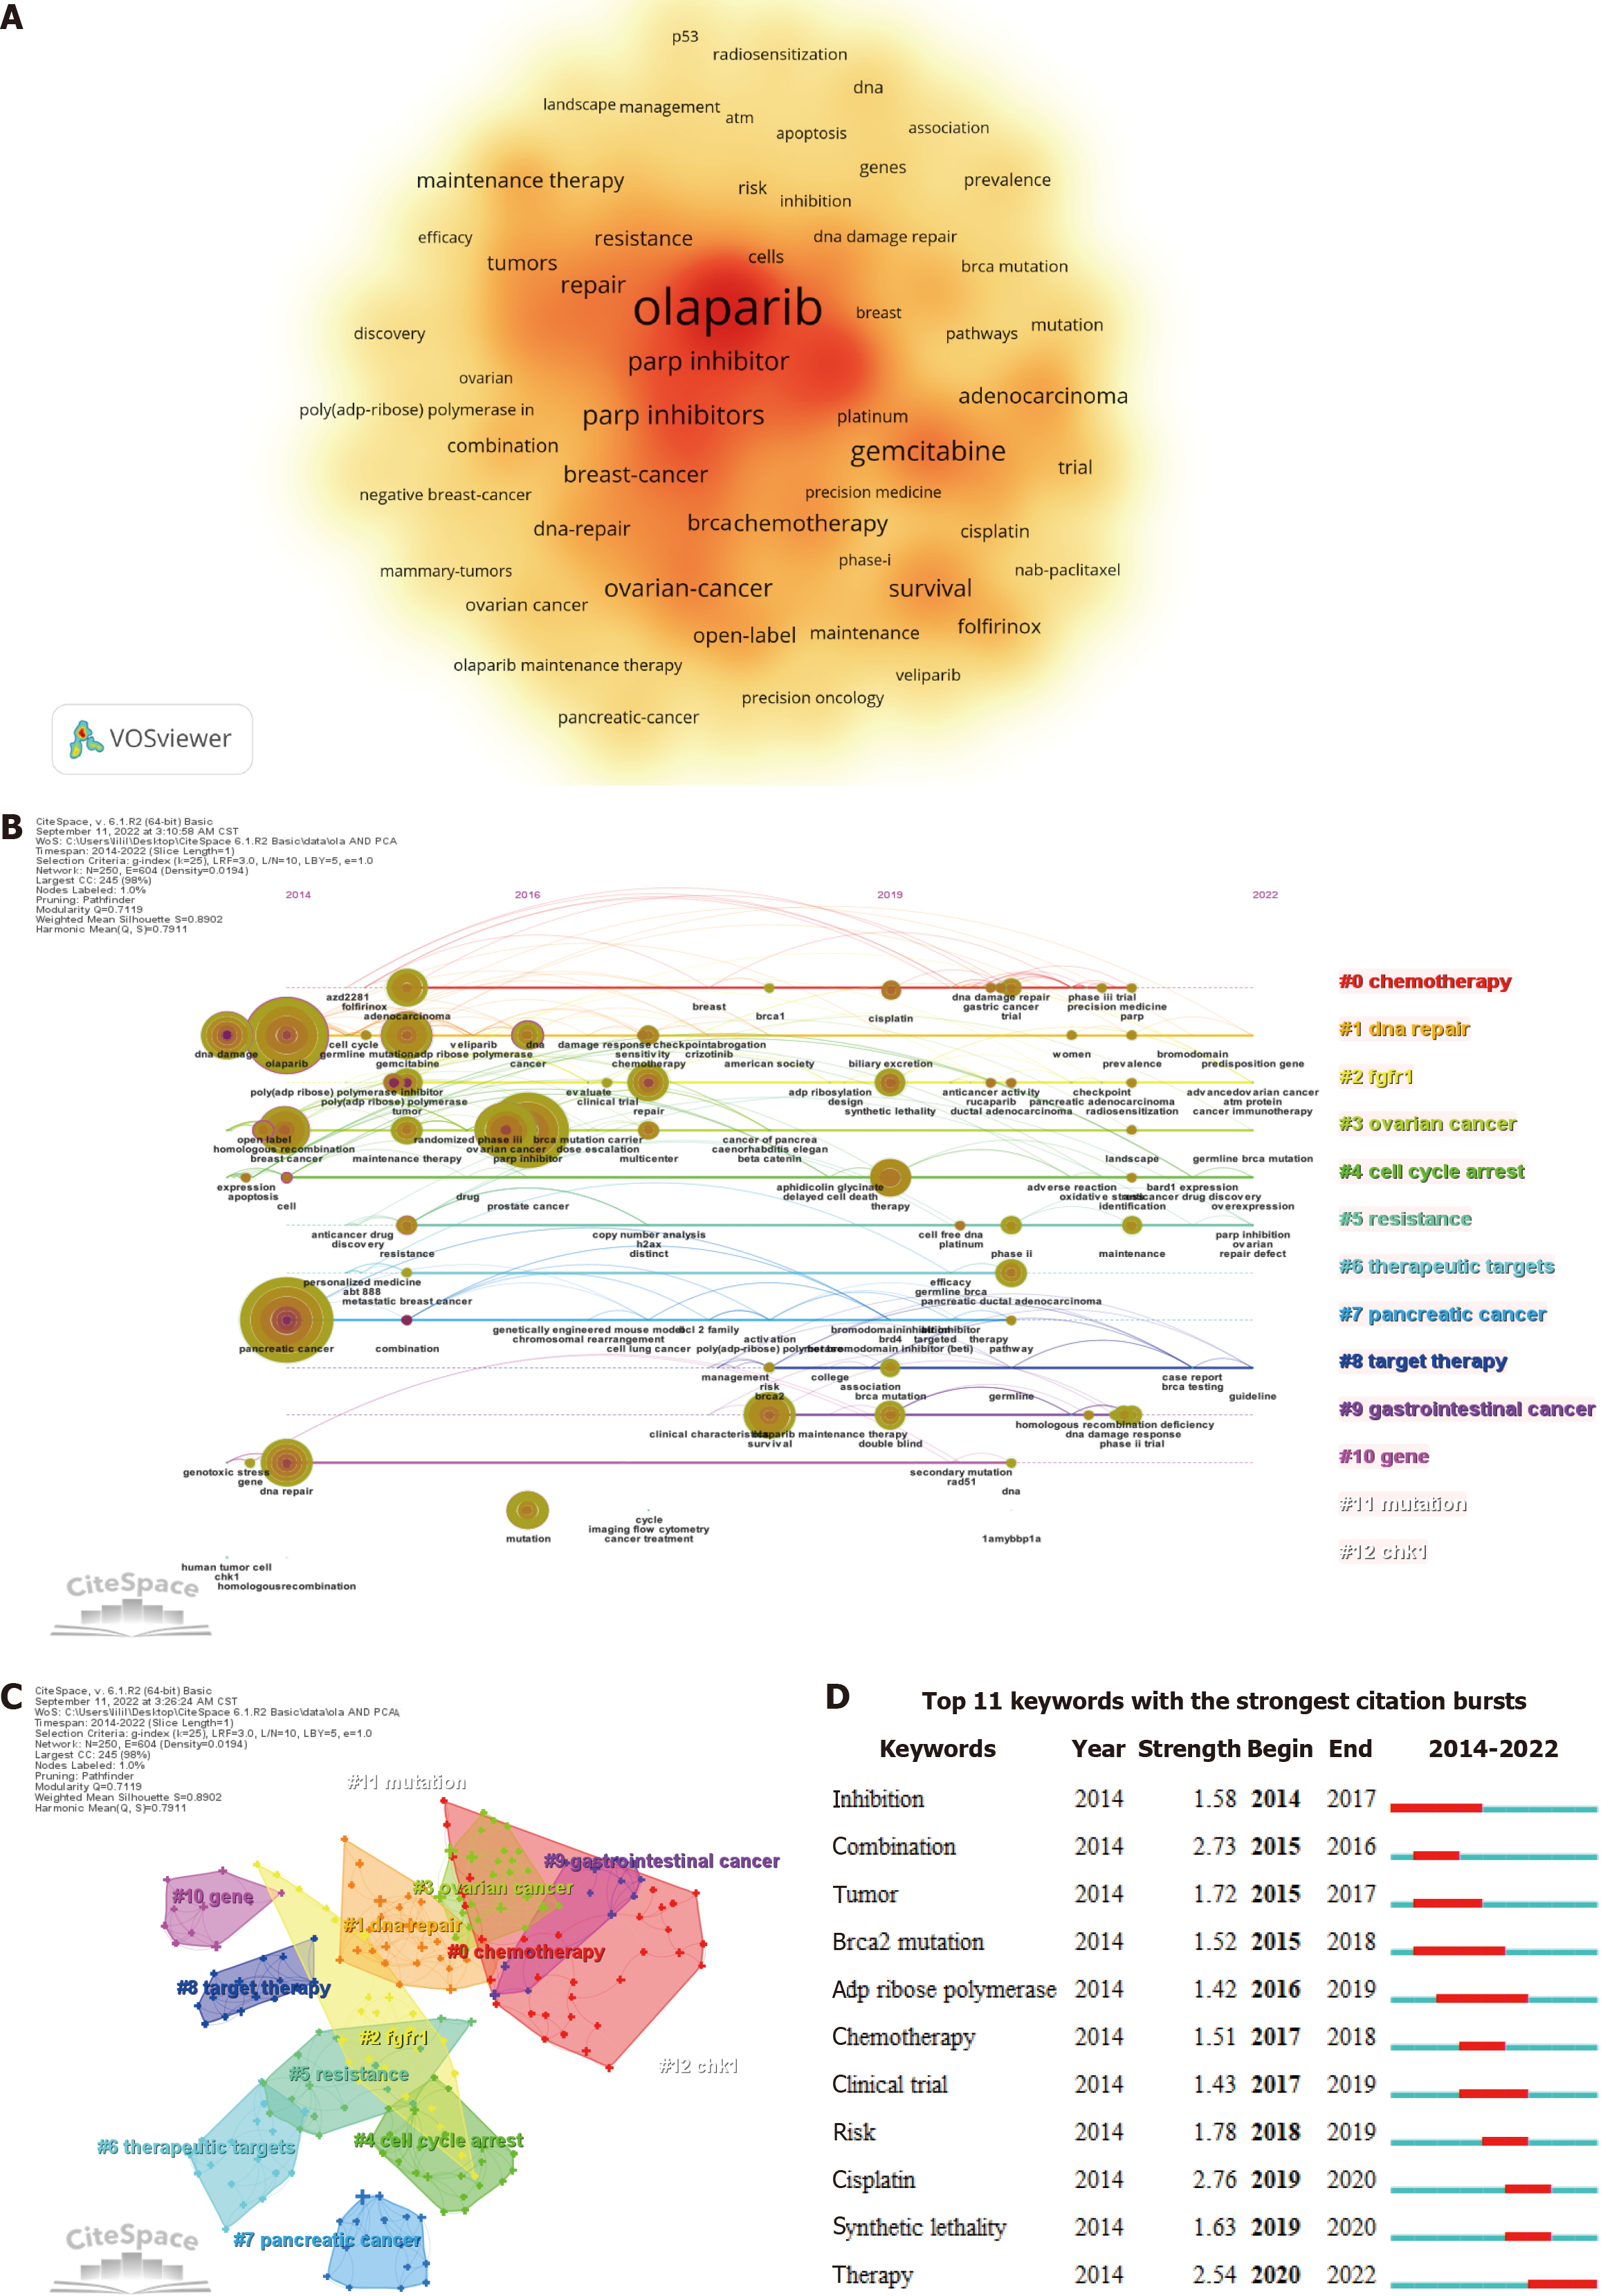
Figure 7 The top 12 clustering terms of olaparib and pancreatic cancer and the keyword trends.
A: Density map of the co-occurrence analysis of keywords. The word size, circle size, and opacity of color are positively related to frequency; B: Cluster analysis of keywords; C: Keyword timeline map of 12 clusters; D: The top 11 keywords with the strongest bursts.
- Citation: Feng X, Chai YH, Jiang KX, Jiang WB, Chen WC, Pan Y. Bibliometric analysis of olaparib and pancreatic cancer from 2009 to 2022: A global perspective. World J Gastrointest Oncol 2024; 16(11): 4489-4505
- URL: https://www.wjgnet.com/1948-5204/full/v16/i11/4489.htm
- DOI: https://dx.doi.org/10.4251/wjgo.v16.i11.4489


