Copyright
©The Author(s) 2024.
World J Gastrointest Oncol. Oct 15, 2024; 16(10): 4264-4273
Published online Oct 15, 2024. doi: 10.4251/wjgo.v16.i10.4264
Published online Oct 15, 2024. doi: 10.4251/wjgo.v16.i10.4264
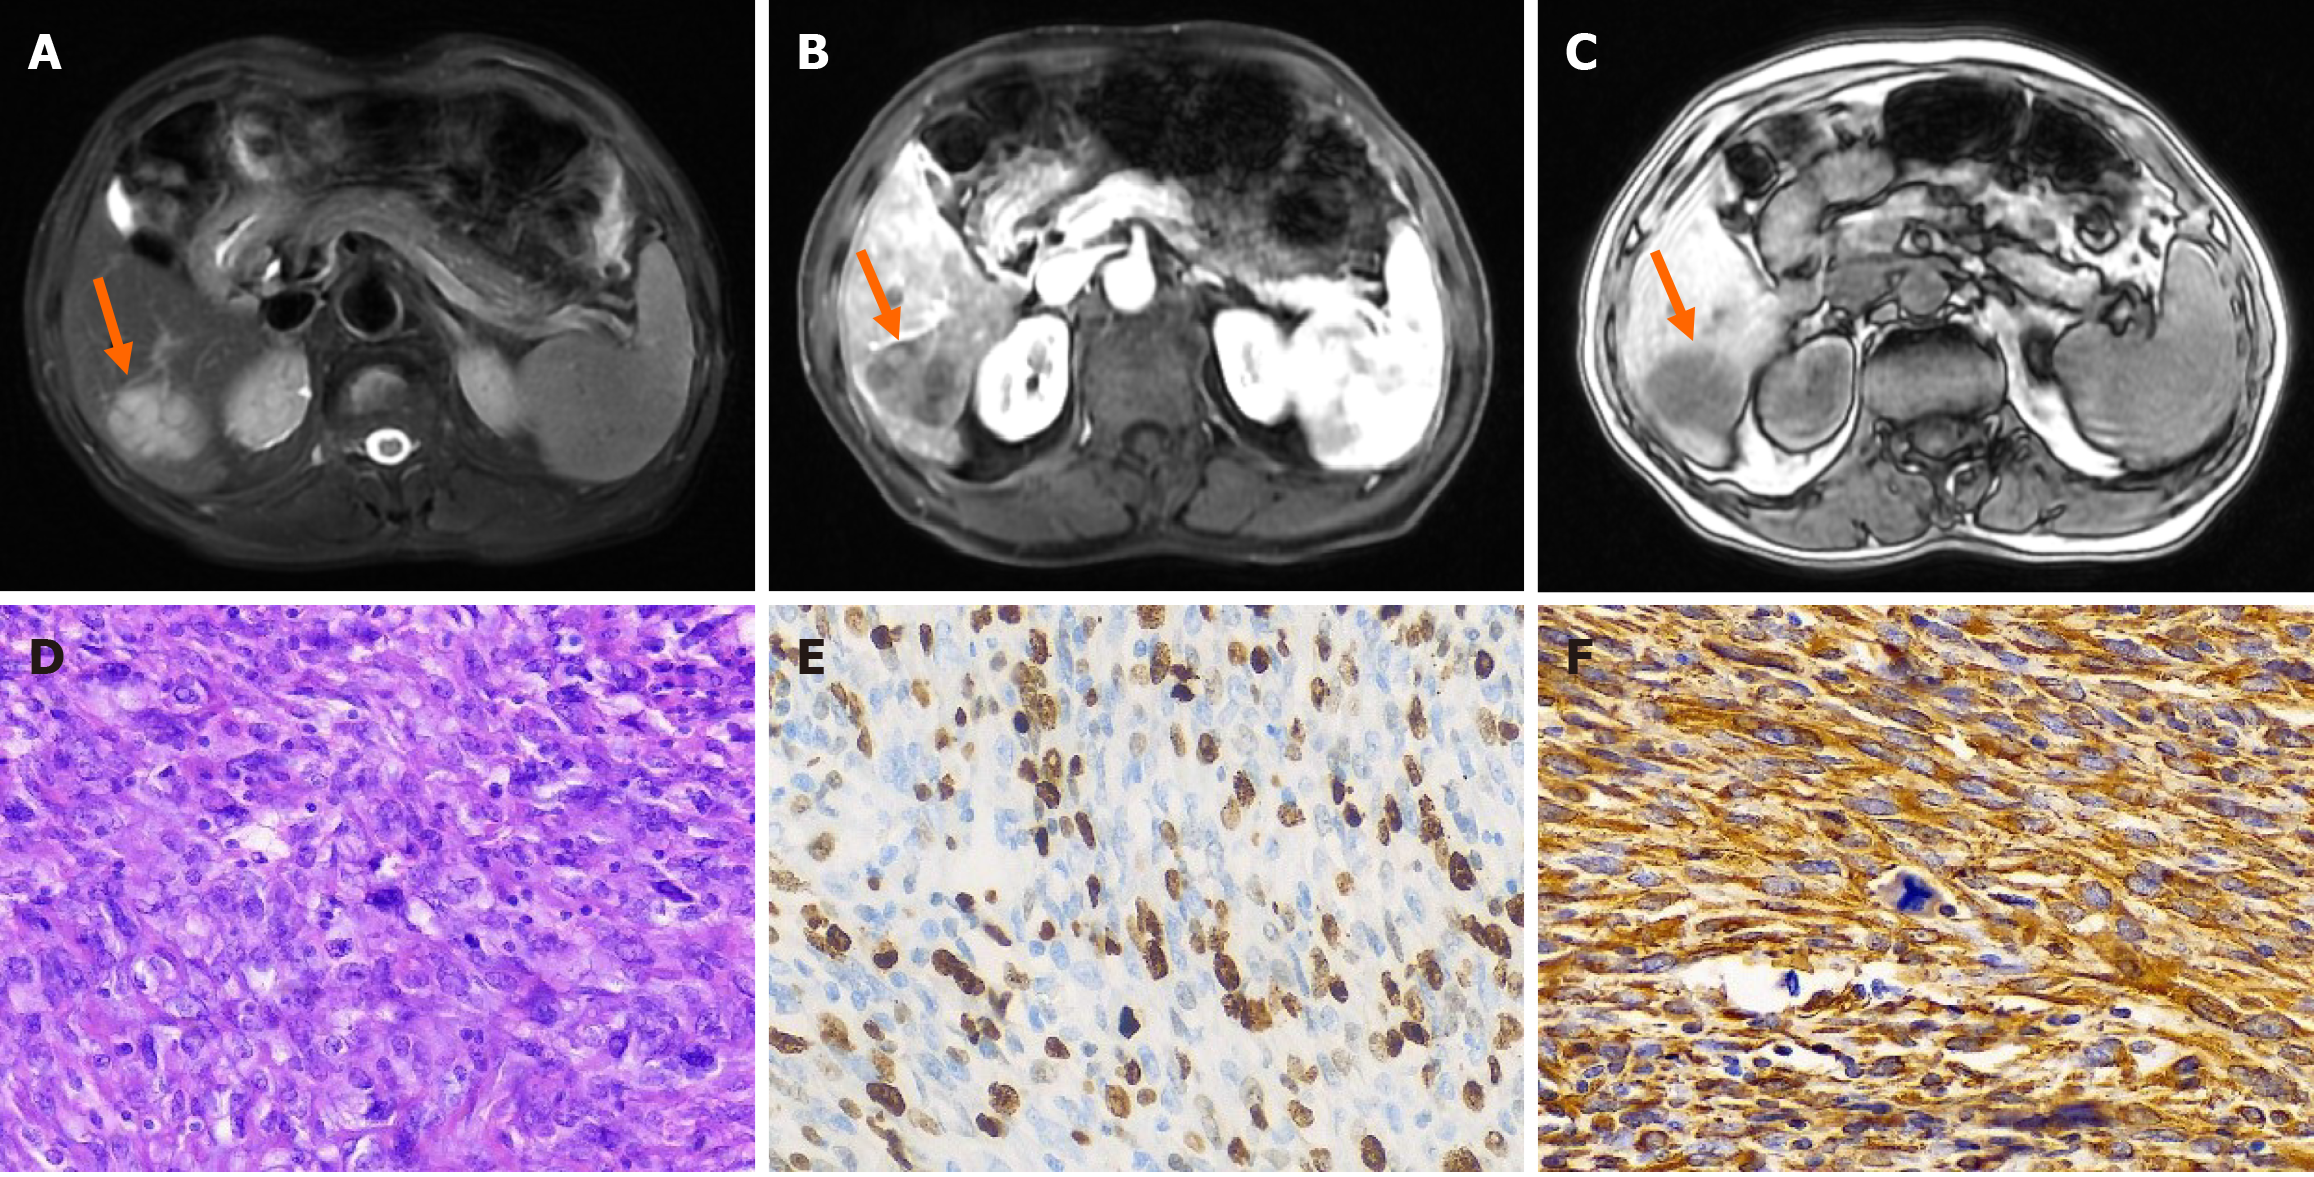
Figure 1 Magnetic resonance imaging and pathological results of primary hepatic fibrosarcoma.
A: Magnetic resonance imaging (MRI) T2 weighted imaging of the compressed fat sequence revealed high signal density (arrow); B: MRI revealed mild heterogeneity with modestly distinct margins during the arterial phase (arrow); C: The lesion in the hepatobiliary phase showed low signal intensity (arrow); D: Hematoxylin and eosin staining 400 ×; E: Ki-67 positivity rate of approximately 60%, immunohistochemical staining 400 ×; F: Vimin (+), immunohistochemical staining 400 ×.
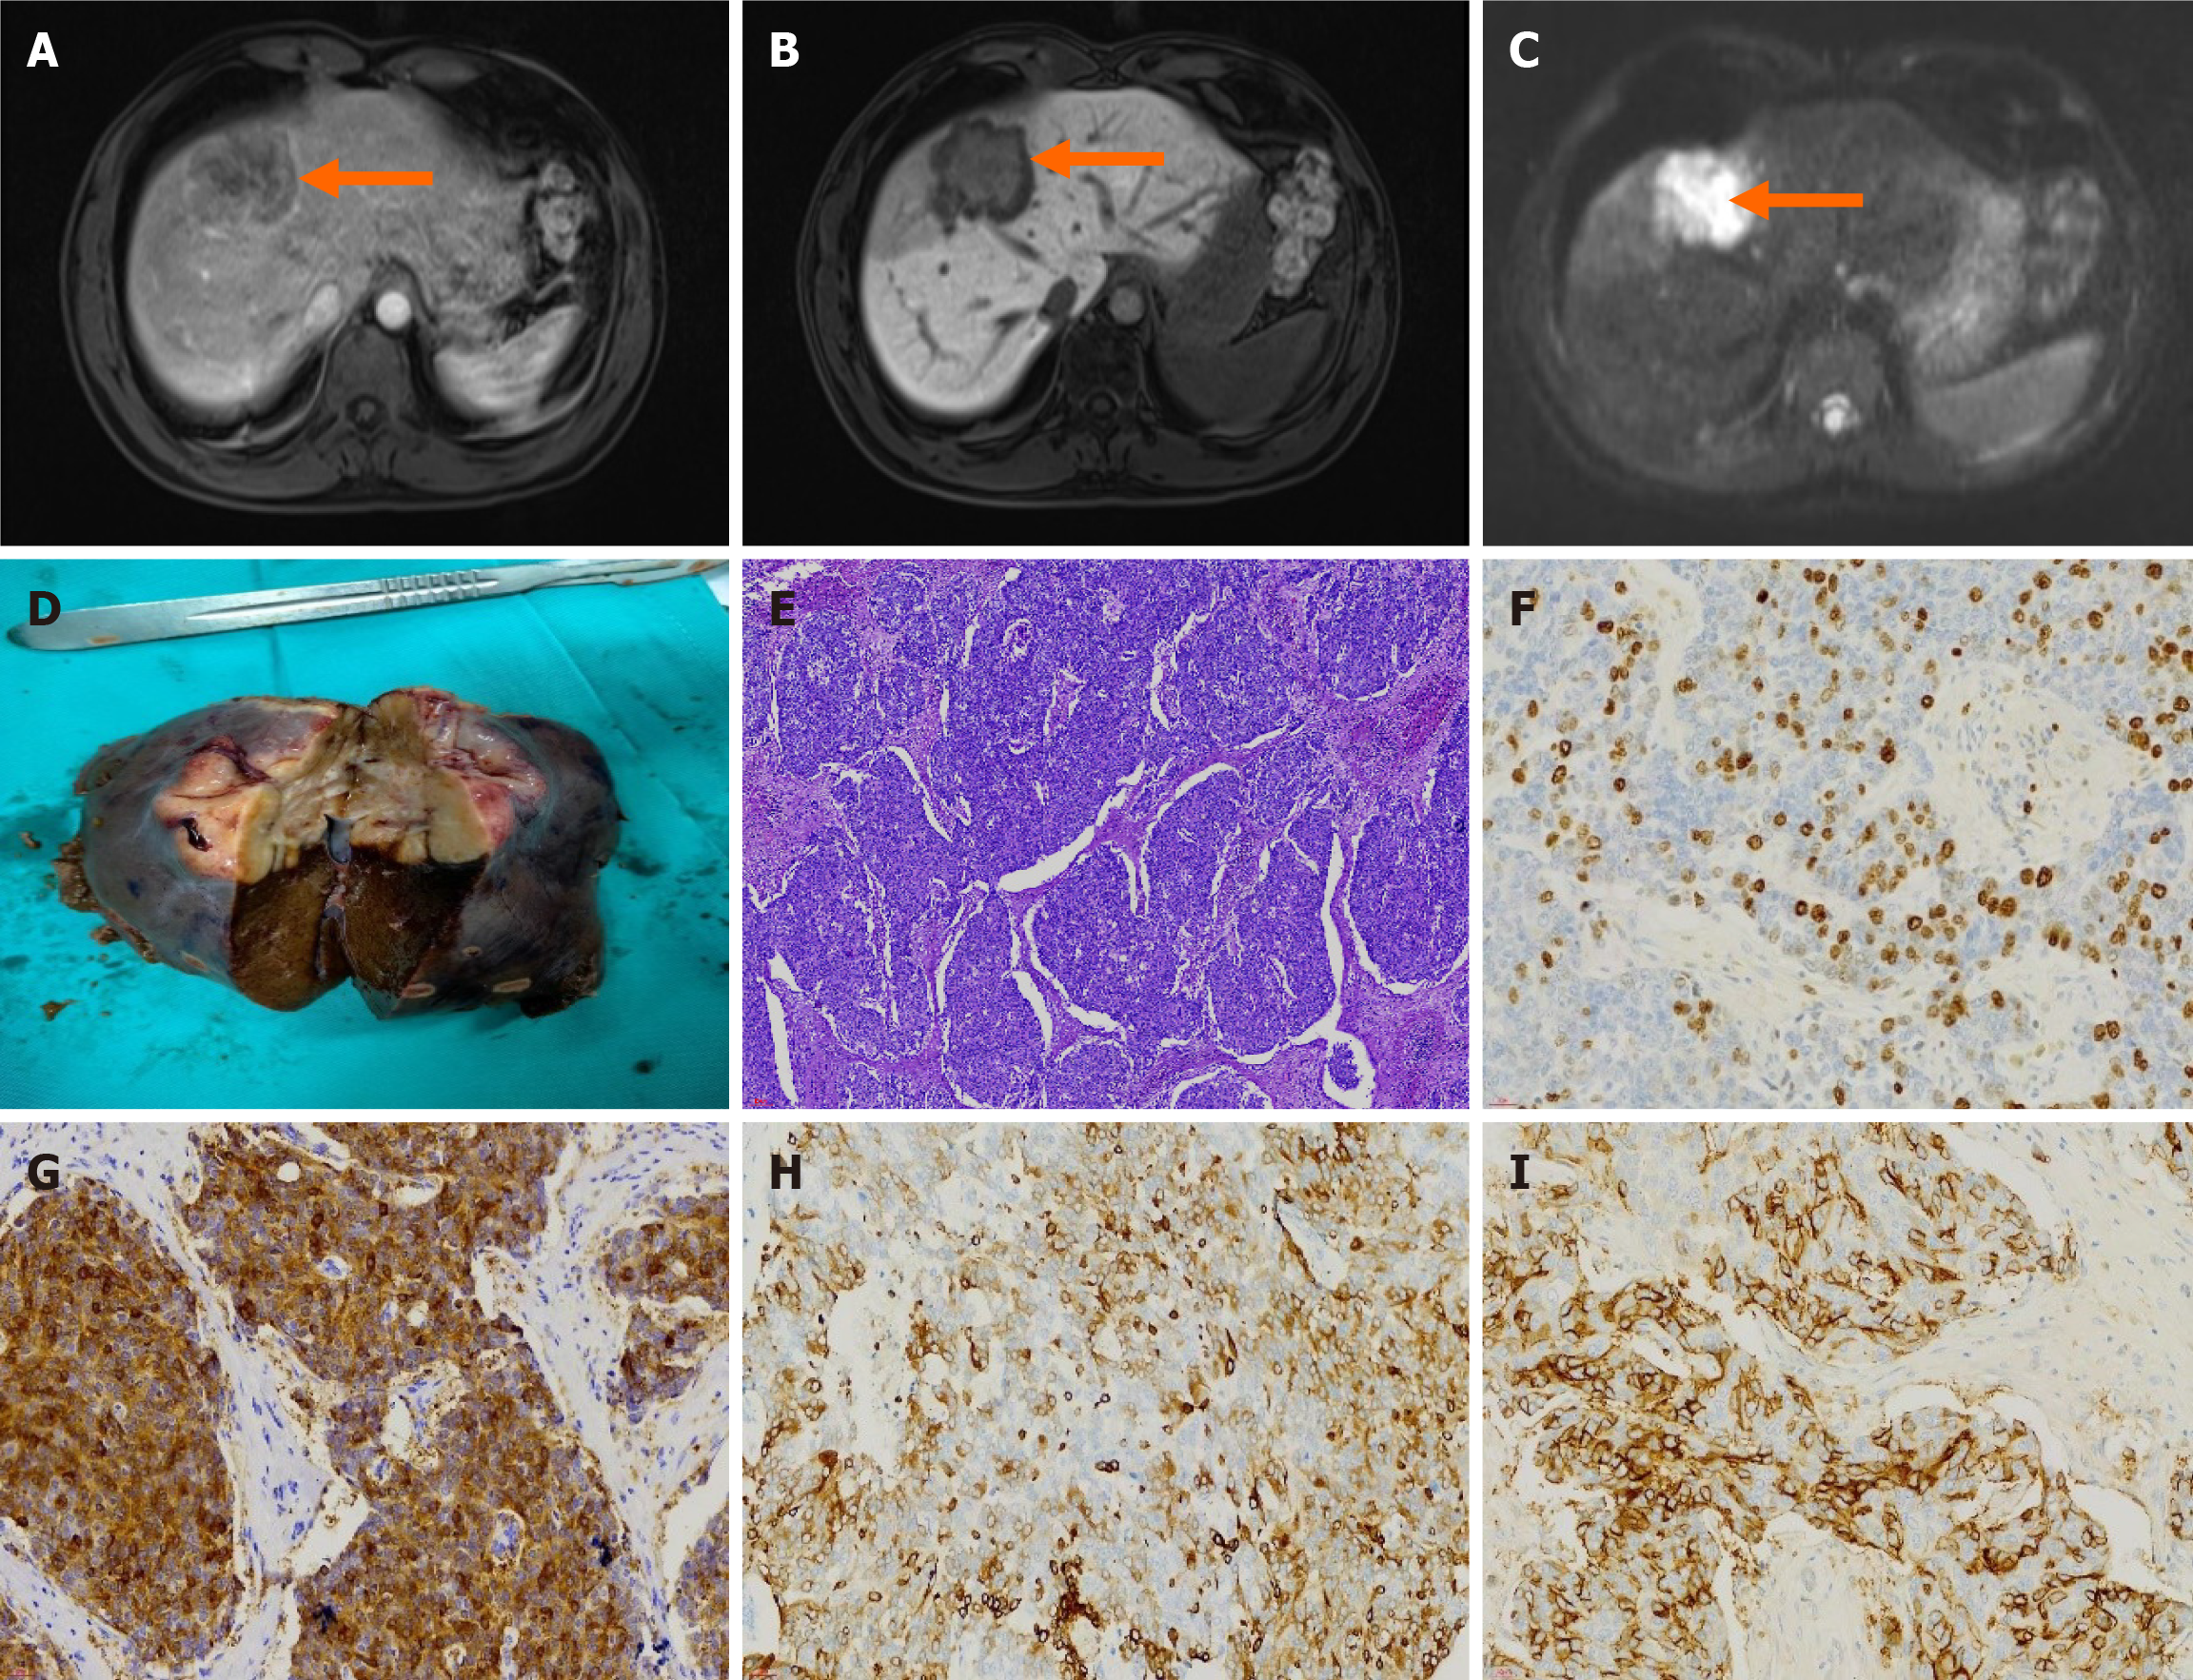
Figure 2 Magnetic resonance imaging, pathological examination, and immunohistochemical results of primary hepatic neuroendocrine tumors.
A: The margins of the lesion showed enhancement during the arterial phase of magnetic resonance imaging, with the middle lobe exhibiting a mild septal-like enhancement pattern (arrow); B: The lesion in the hepatobiliary phase exhibited a low and slightly low signal (arrow); C: Diffusion weighted imaging revealed a high signal shadow of the lesion (arrow); D: Tumor pathology specimen; E: Hematoxylin and eosin staining 100 ×; F: Ki-67 positivity rate of approximately 30%, immunohistochemical staining 400 ×; G: synaptophysin cell positivity, immunohistochemical staining 400 ×; H: Cytokeratin wide cell positive, immunohistochemical staining 400 ×; I: CD56 partially cell positive, immunohistochemical staining 400 ×.
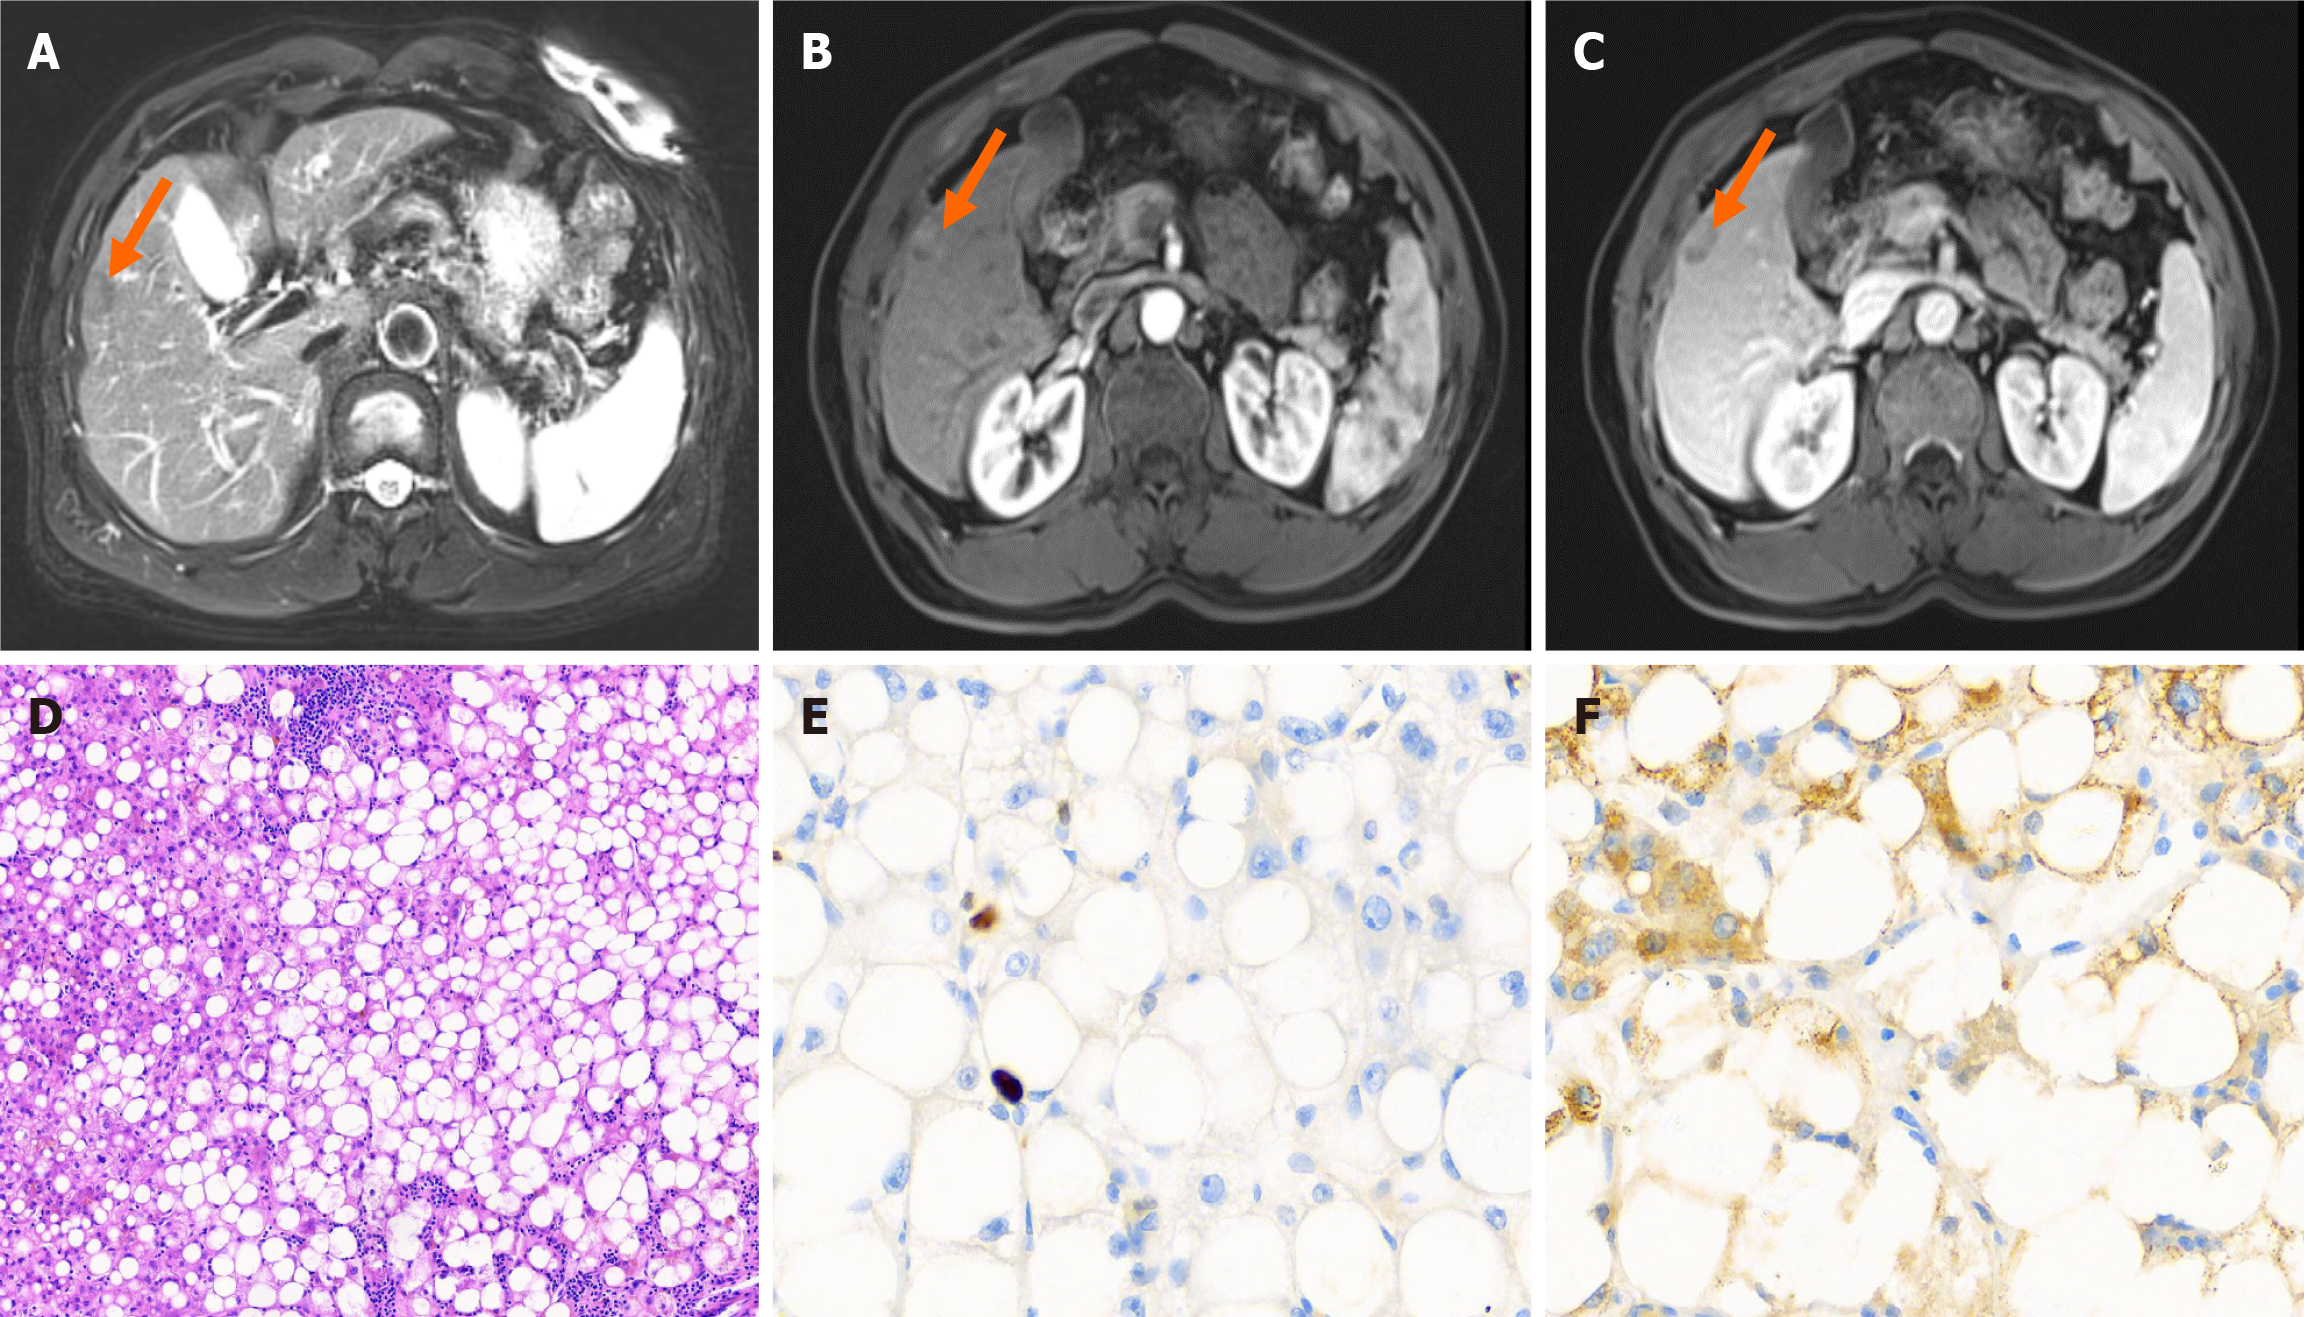
Figure 3 Magnetic resonance imaging, pathological examination and immunohistochemical results of focal hepatic steatosis.
A: The lesion in segment S5 is slightly hypointense on the T2-weighted fat-suppressed magnetic resonance imaging (MRI) sequence (arrow); B: The lesion begins to enhance during the arterial phase of MRI (arrow); C: The lesion shows less enhancement in the delayed phase of MRI compared to the adjacent liver parenchyma (arrow); D: Hematoxylin and eosin staining 100 ×; E: Ki-67 (positive, < 5%), immunohistochemical staining 400 ×; F: Hepatocyte (+), immunohistochemical staining 400 ×.
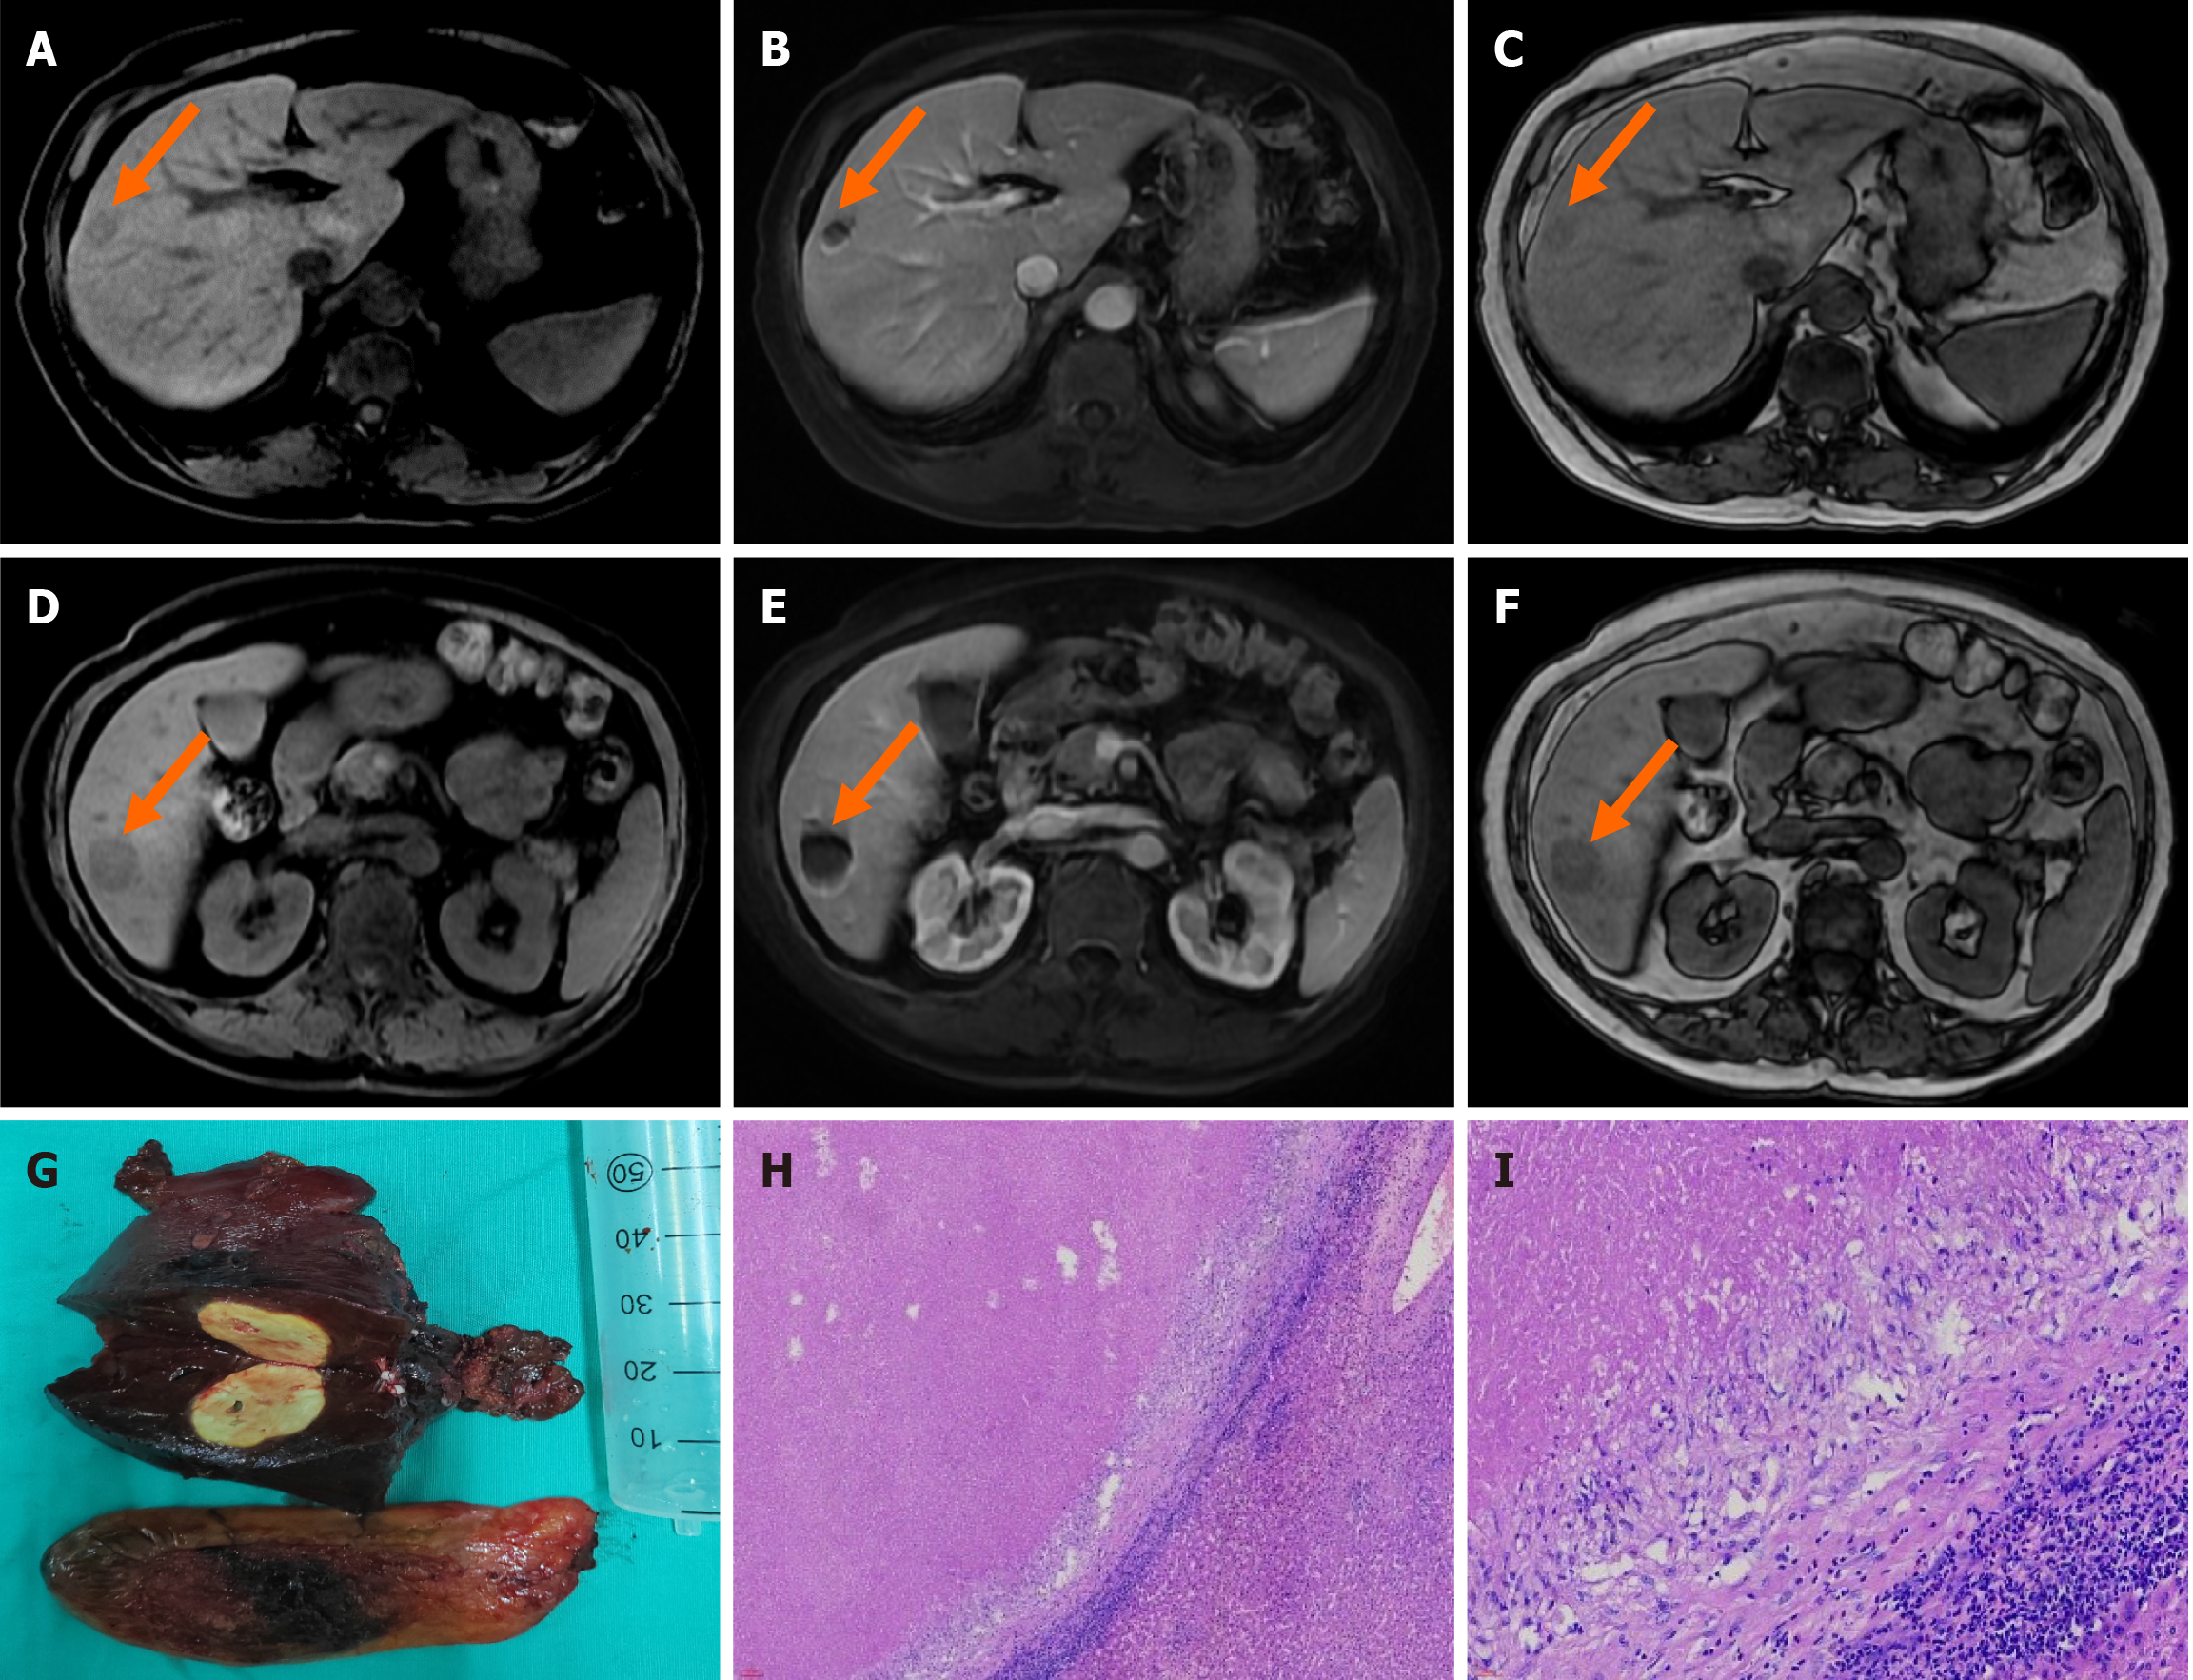
Figure 4 Magnetic resonance imaging, specimen and pathological results of single necrotic nodule in the liver.
A: On T1-weighted magnetic resonance imaging (MRI), a nodular isointense to slightly hyperintense signal is observed in segment S8 of the liver (arrow); B: During the arterial phase of MRI, the lesion in segment S8 shows a progressive and irregular peripheral enhancement pattern (arrow); C: In the hepatobiliary phase, the lesion in segment S8 exhibits a hypointense signal (arrow); D: On T1-weighted MRI, a nodular isointense to slightly hyperintense signal is observed in segment S6 of the liver (arrow); E: During the arterial phase of MRI contrast enhancement, the lesion in segment S6 demonstrates a ring-like enhancement (arrow); F: In the hepatobiliary phase, the lesion in segment S6 shows a hypointense signal (arrow); G: Specimens of the tumor in segment S6 of the liver and the gallbladder; H: Hematoxylin and eosin (HE) staining 100 ×; I: HE staining 400 ×.
- Citation: Zhao Y, Bie YK, Zhang GY, Feng YB, Wang F. Rare and lacking typical clinical symptoms of liver tumors: Four case reports. World J Gastrointest Oncol 2024; 16(10): 4264-4273
- URL: https://www.wjgnet.com/1948-5204/full/v16/i10/4264.htm
- DOI: https://dx.doi.org/10.4251/wjgo.v16.i10.4264


