Copyright
©The Author(s) 2024.
World J Gastrointest Oncol. Oct 15, 2024; 16(10): 4146-4156
Published online Oct 15, 2024. doi: 10.4251/wjgo.v16.i10.4146
Published online Oct 15, 2024. doi: 10.4251/wjgo.v16.i10.4146
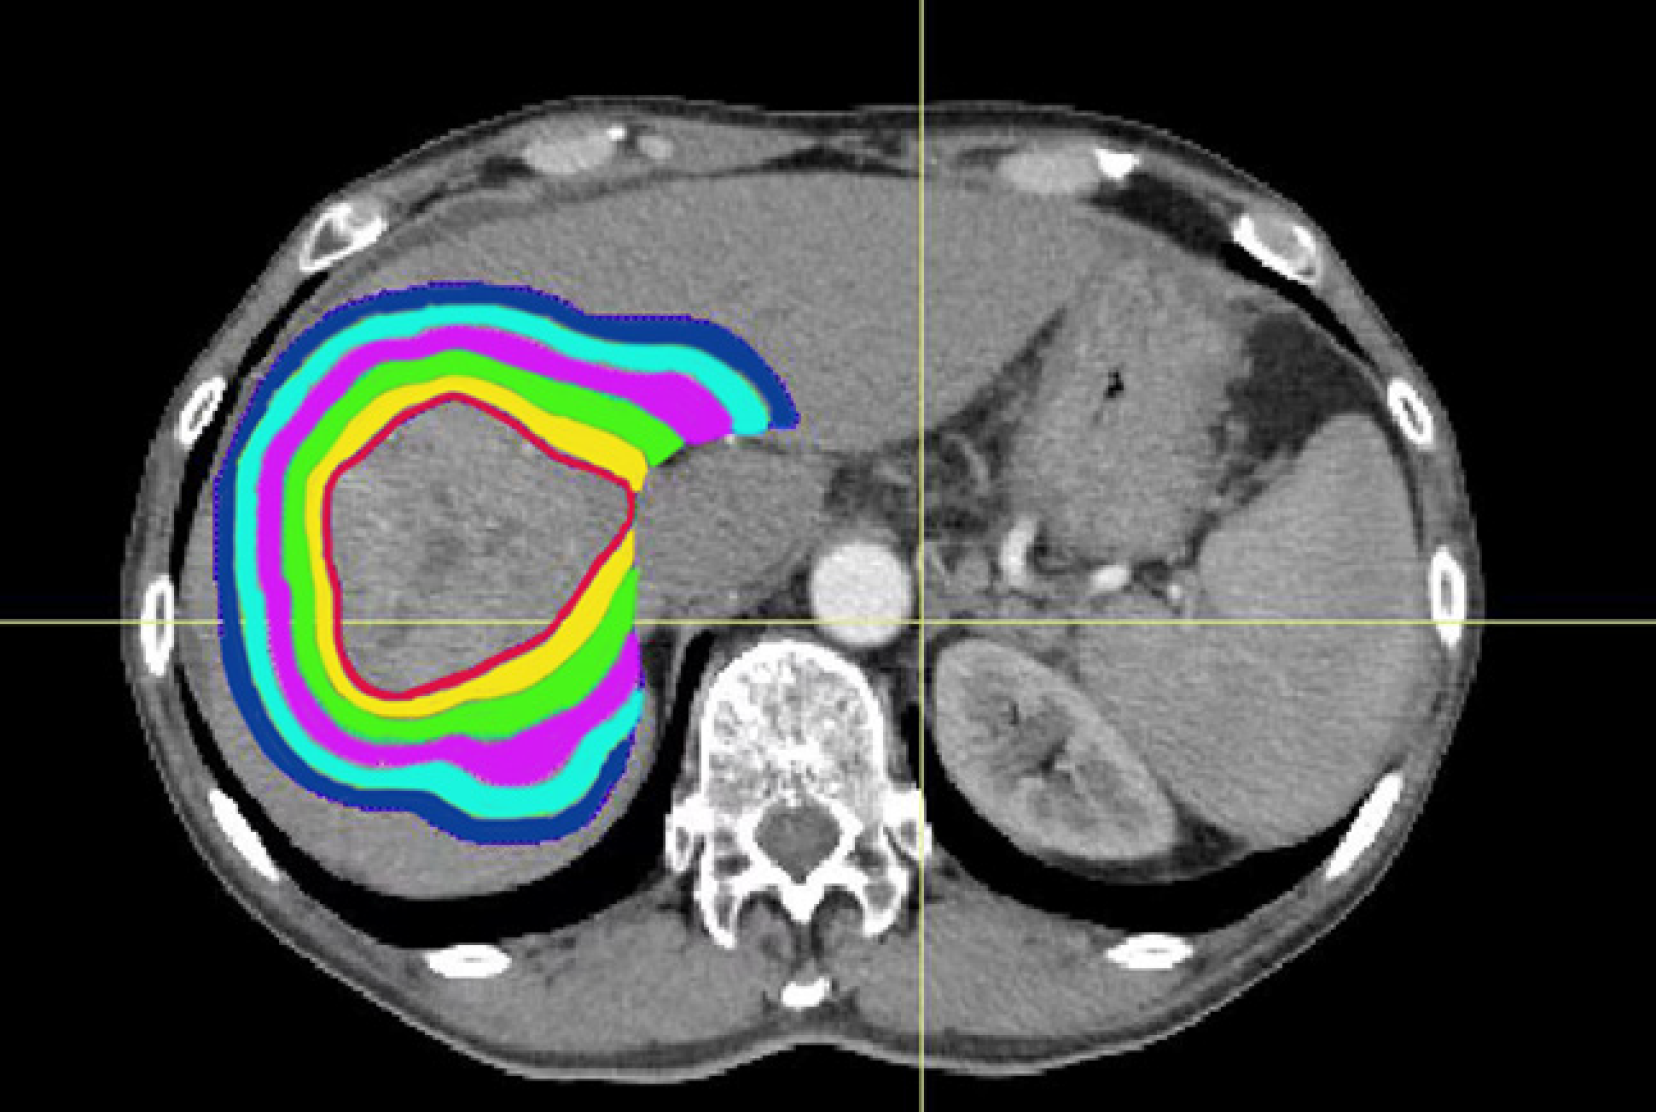
Figure 1 Sub-organ of the uninvolved liver.
The red line indicates planning target volume, the yellow shadow indicates the sub-organ1, the green shadow indicates the sub-organ2, the pink shadow indicates the sub-organ3, the sky blue shadow indicates the sub-organ4, the blue shadow indicates the sub-organ5.
Figure 2 The neural network prediction model.
A: Regression diagram of Dn0-Dn50 for the neural network prediction model; B: Regression diagram of Dn60-Dn100 and Dnmean for the neural network prediction model; C: The predicted value by the neural network model and the actual planned value. Pink is the predicted value of the neural network model; blue is the target planned value. Dnx = Dx (Dx: Dose of x% uninvolved liver volume)/prescription dose of planning target volume (Dprescription).
- Citation: Zhang HW, Wang YH, Hu B, Pang HW. Uninvolved liver dose prediction in stereotactic body radiation therapy for liver cancer based on the neural network method. World J Gastrointest Oncol 2024; 16(10): 4146-4156
- URL: https://www.wjgnet.com/1948-5204/full/v16/i10/4146.htm
- DOI: https://dx.doi.org/10.4251/wjgo.v16.i10.4146


