Copyright
©The Author(s) 2024.
World J Gastrointest Oncol. Oct 15, 2024; 16(10): 4115-4128
Published online Oct 15, 2024. doi: 10.4251/wjgo.v16.i10.4115
Published online Oct 15, 2024. doi: 10.4251/wjgo.v16.i10.4115
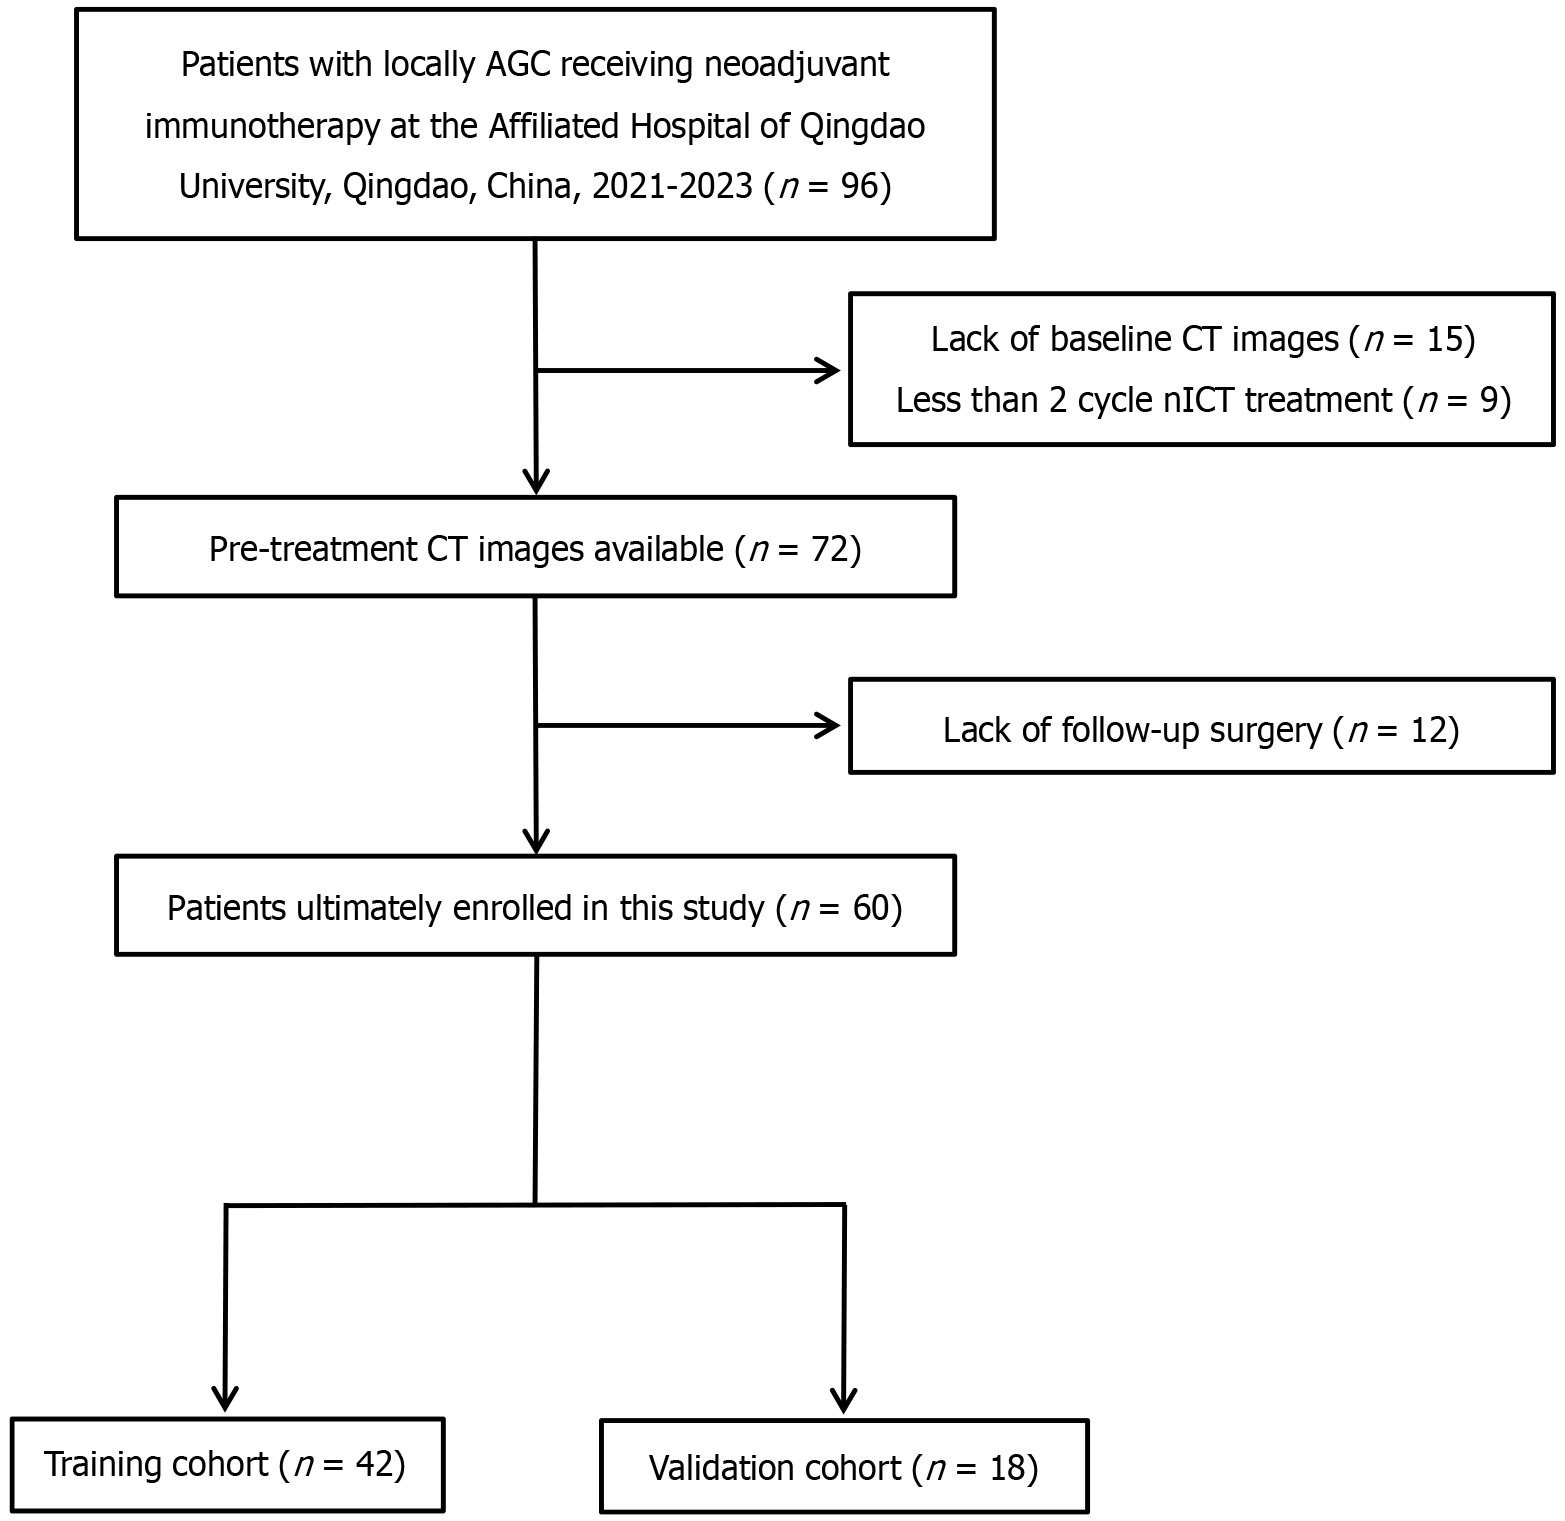
Figure 1 A flow chart of patient enrollment.
AGC: Advanced gastric cancer; CT: Computed tomography; nICT: Neoadjuvant immunochemotherapy.
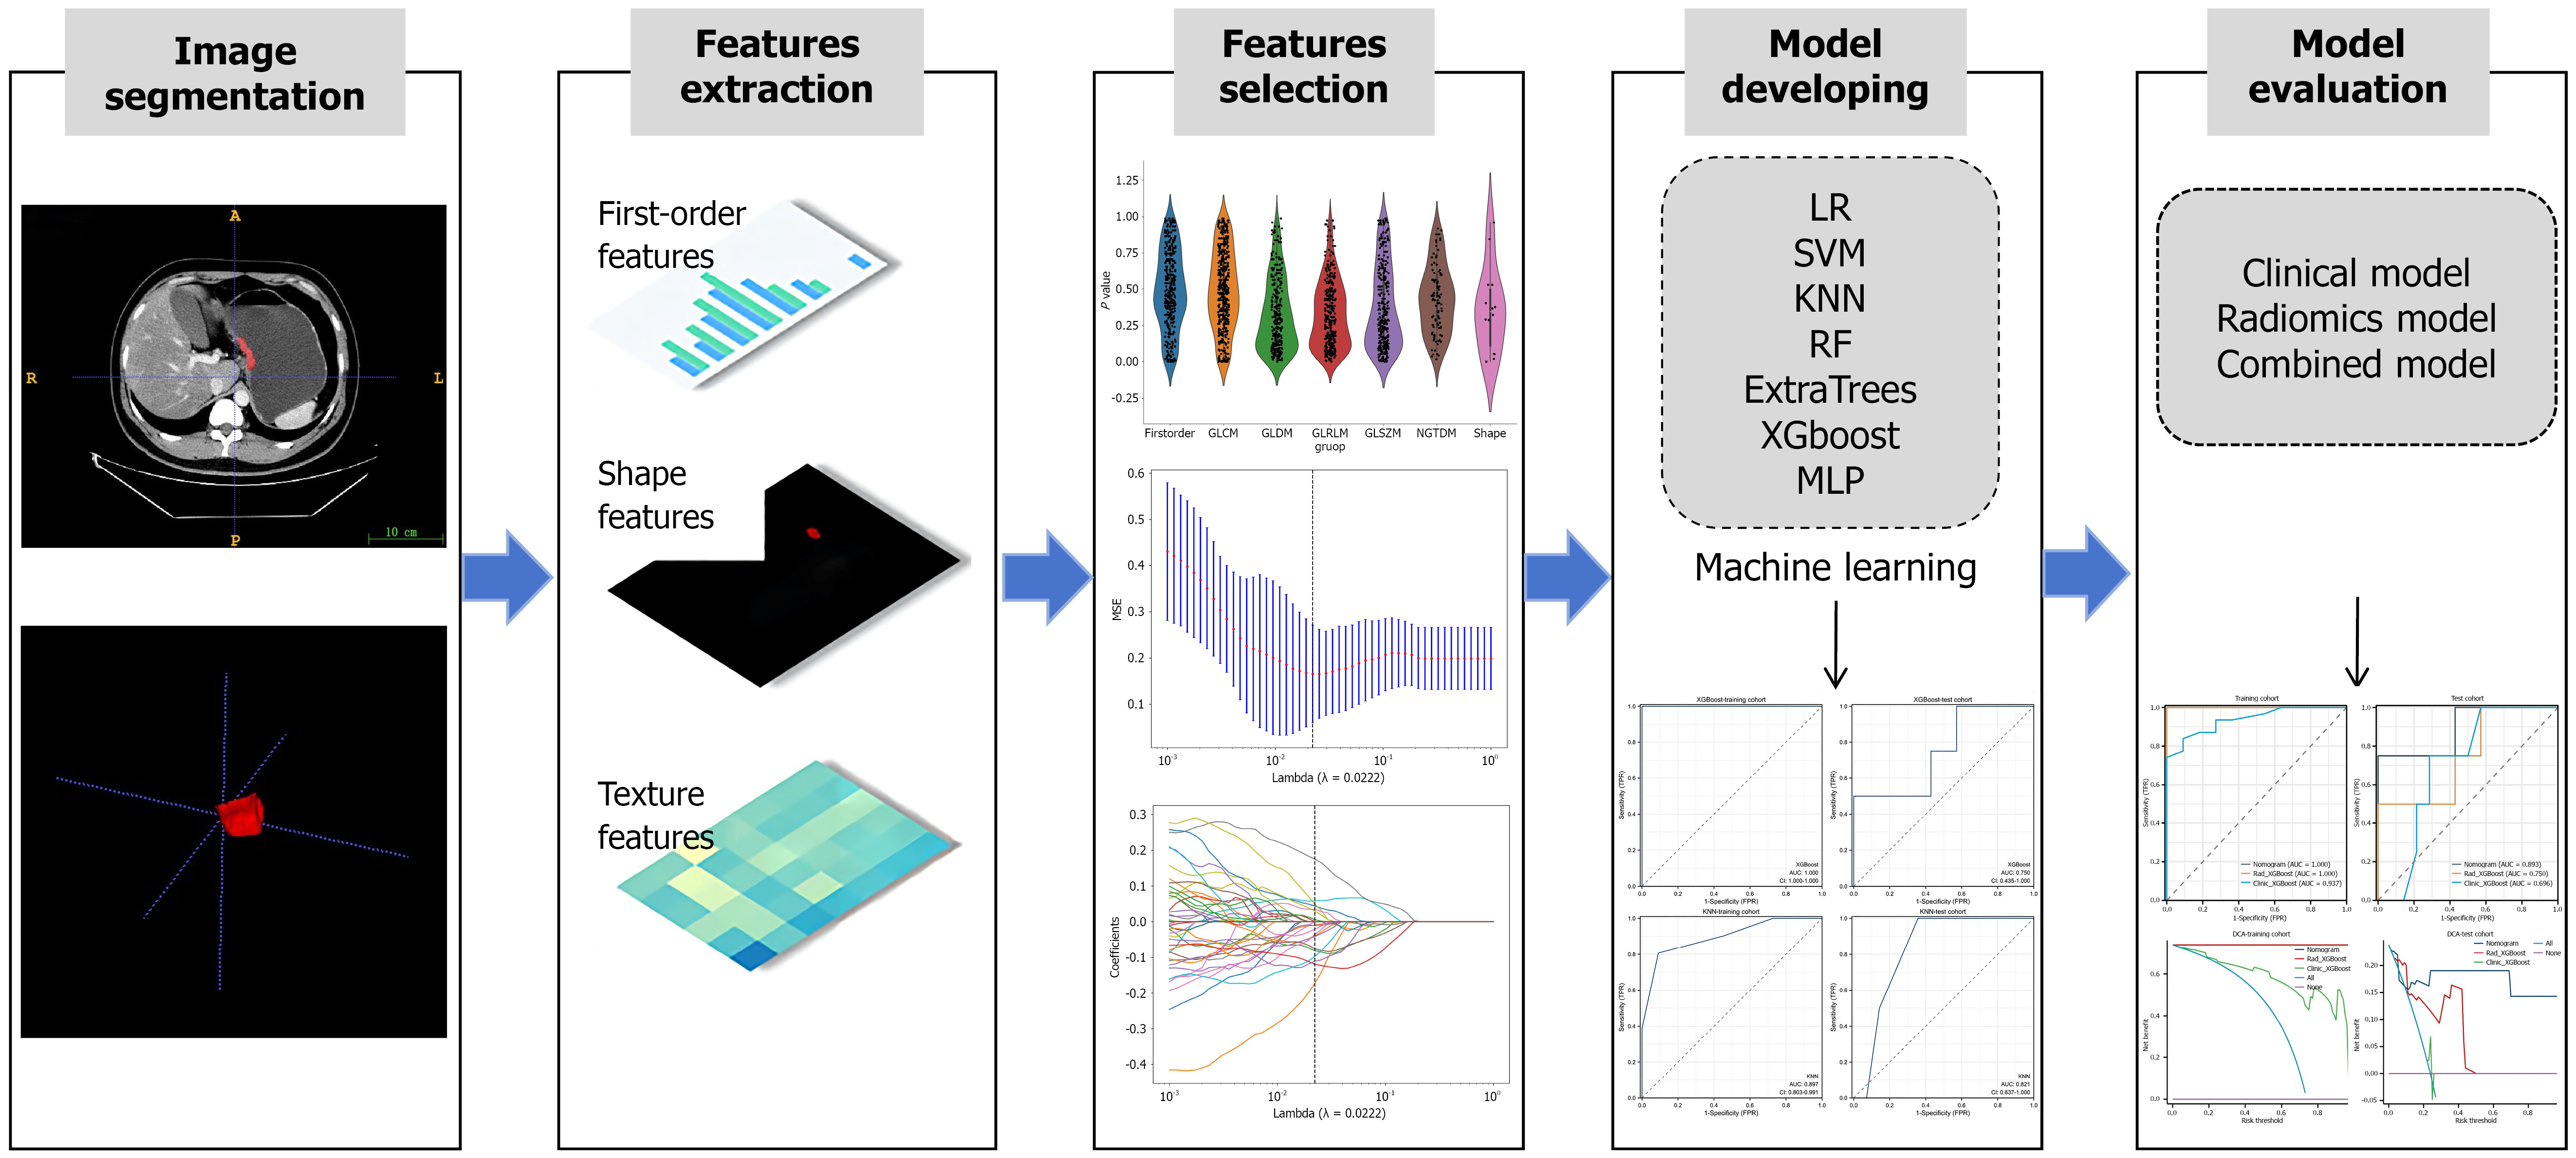
Figure 2 A flow chart of the radiomic analysis.
According to the computed tomography images, important imaging features were screened and combined with important clinical risk factors to generate a radiomic nomogram. The performance and clinical utility of the radiomic model in predicting the response of patients with advanced gastric cancer to neoadjuvant immunochemotherapy were evaluated through receiver operating characteristic curve analysis and decision curve analysis. LR: Logistic regression; KNN: K-nearest neighbor classification; RF: Random forest; XGBoost: EXtreme gradient boosting; MLP: Multilayer perceptron; SVM: Support vector machine; MSE: Mean squared error; TPR: True positive rate; FPR: False positive rate; DCA: Decision curve analysis.
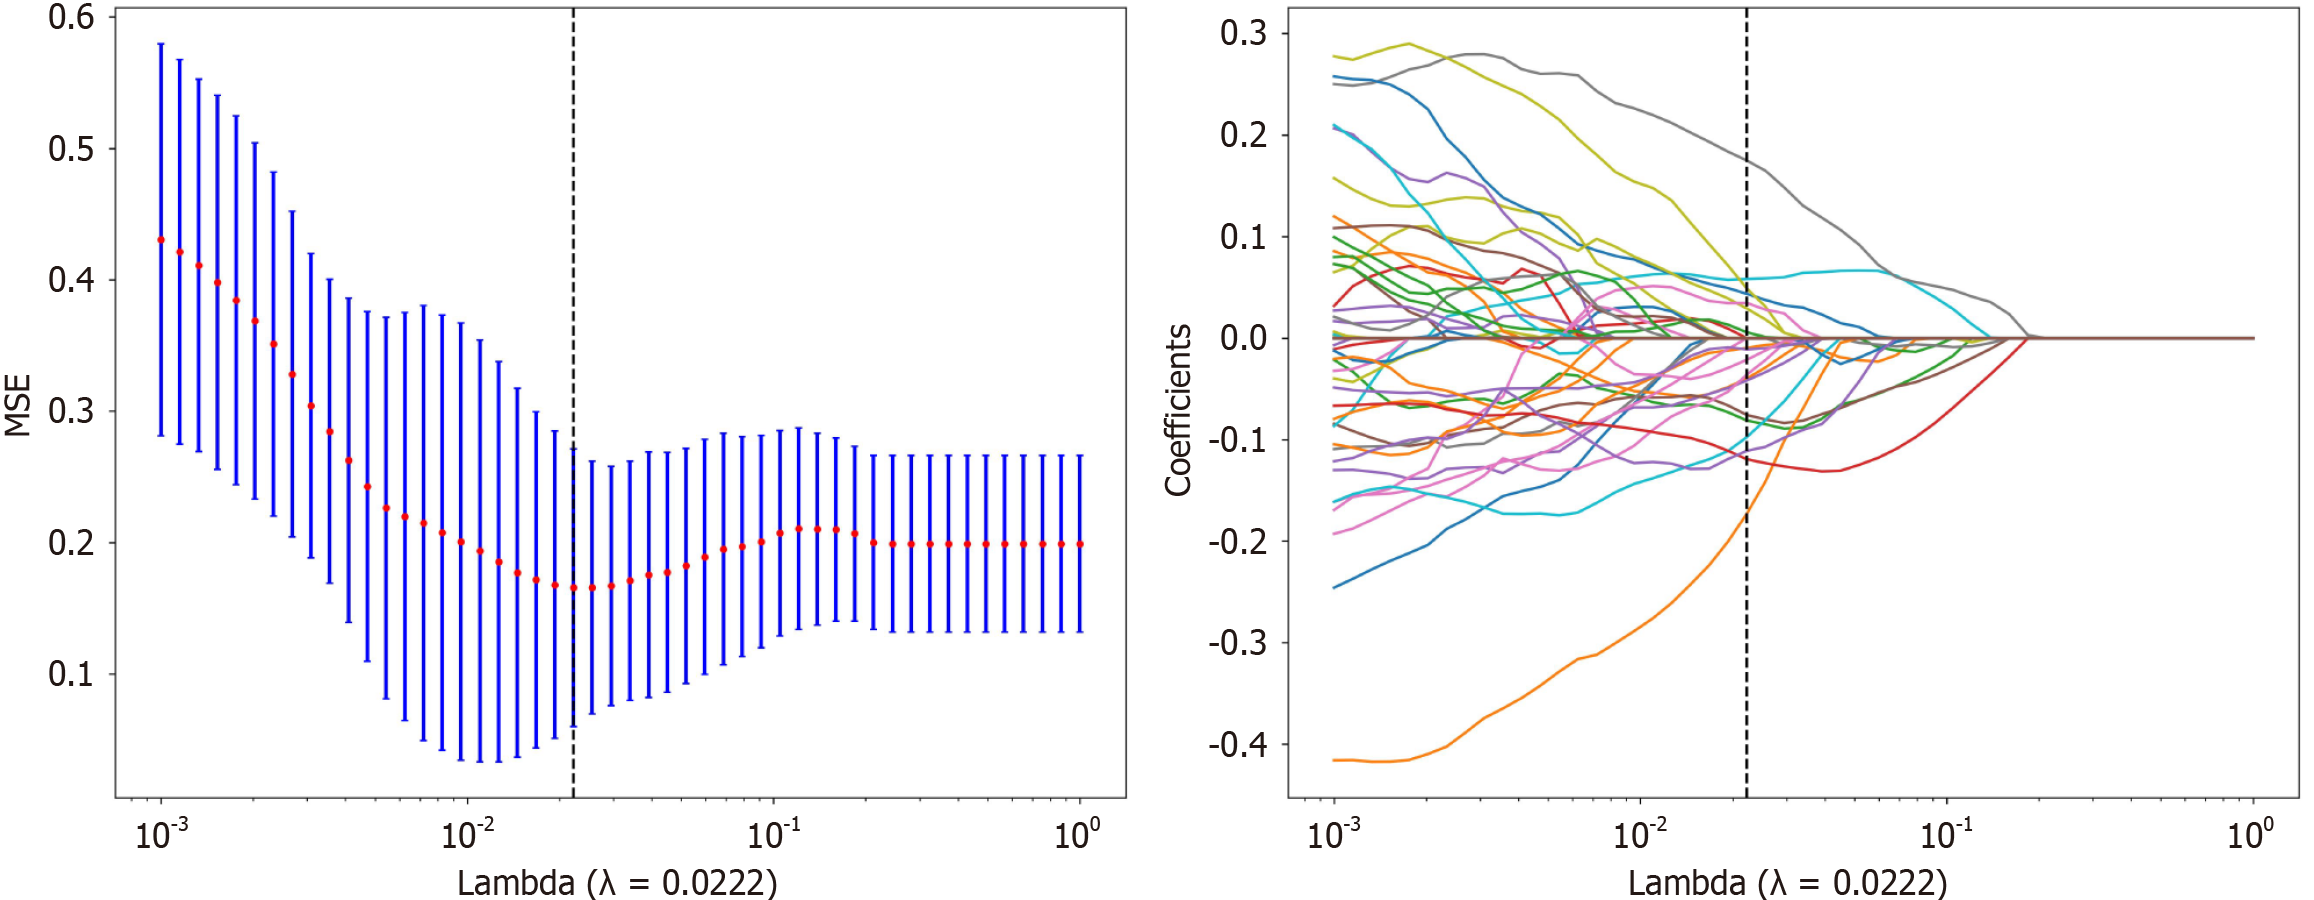
Figure 3 Least absolute shrinkage and selection operator regression was used to screen for radiomic features.
MSE: Mean squared error.
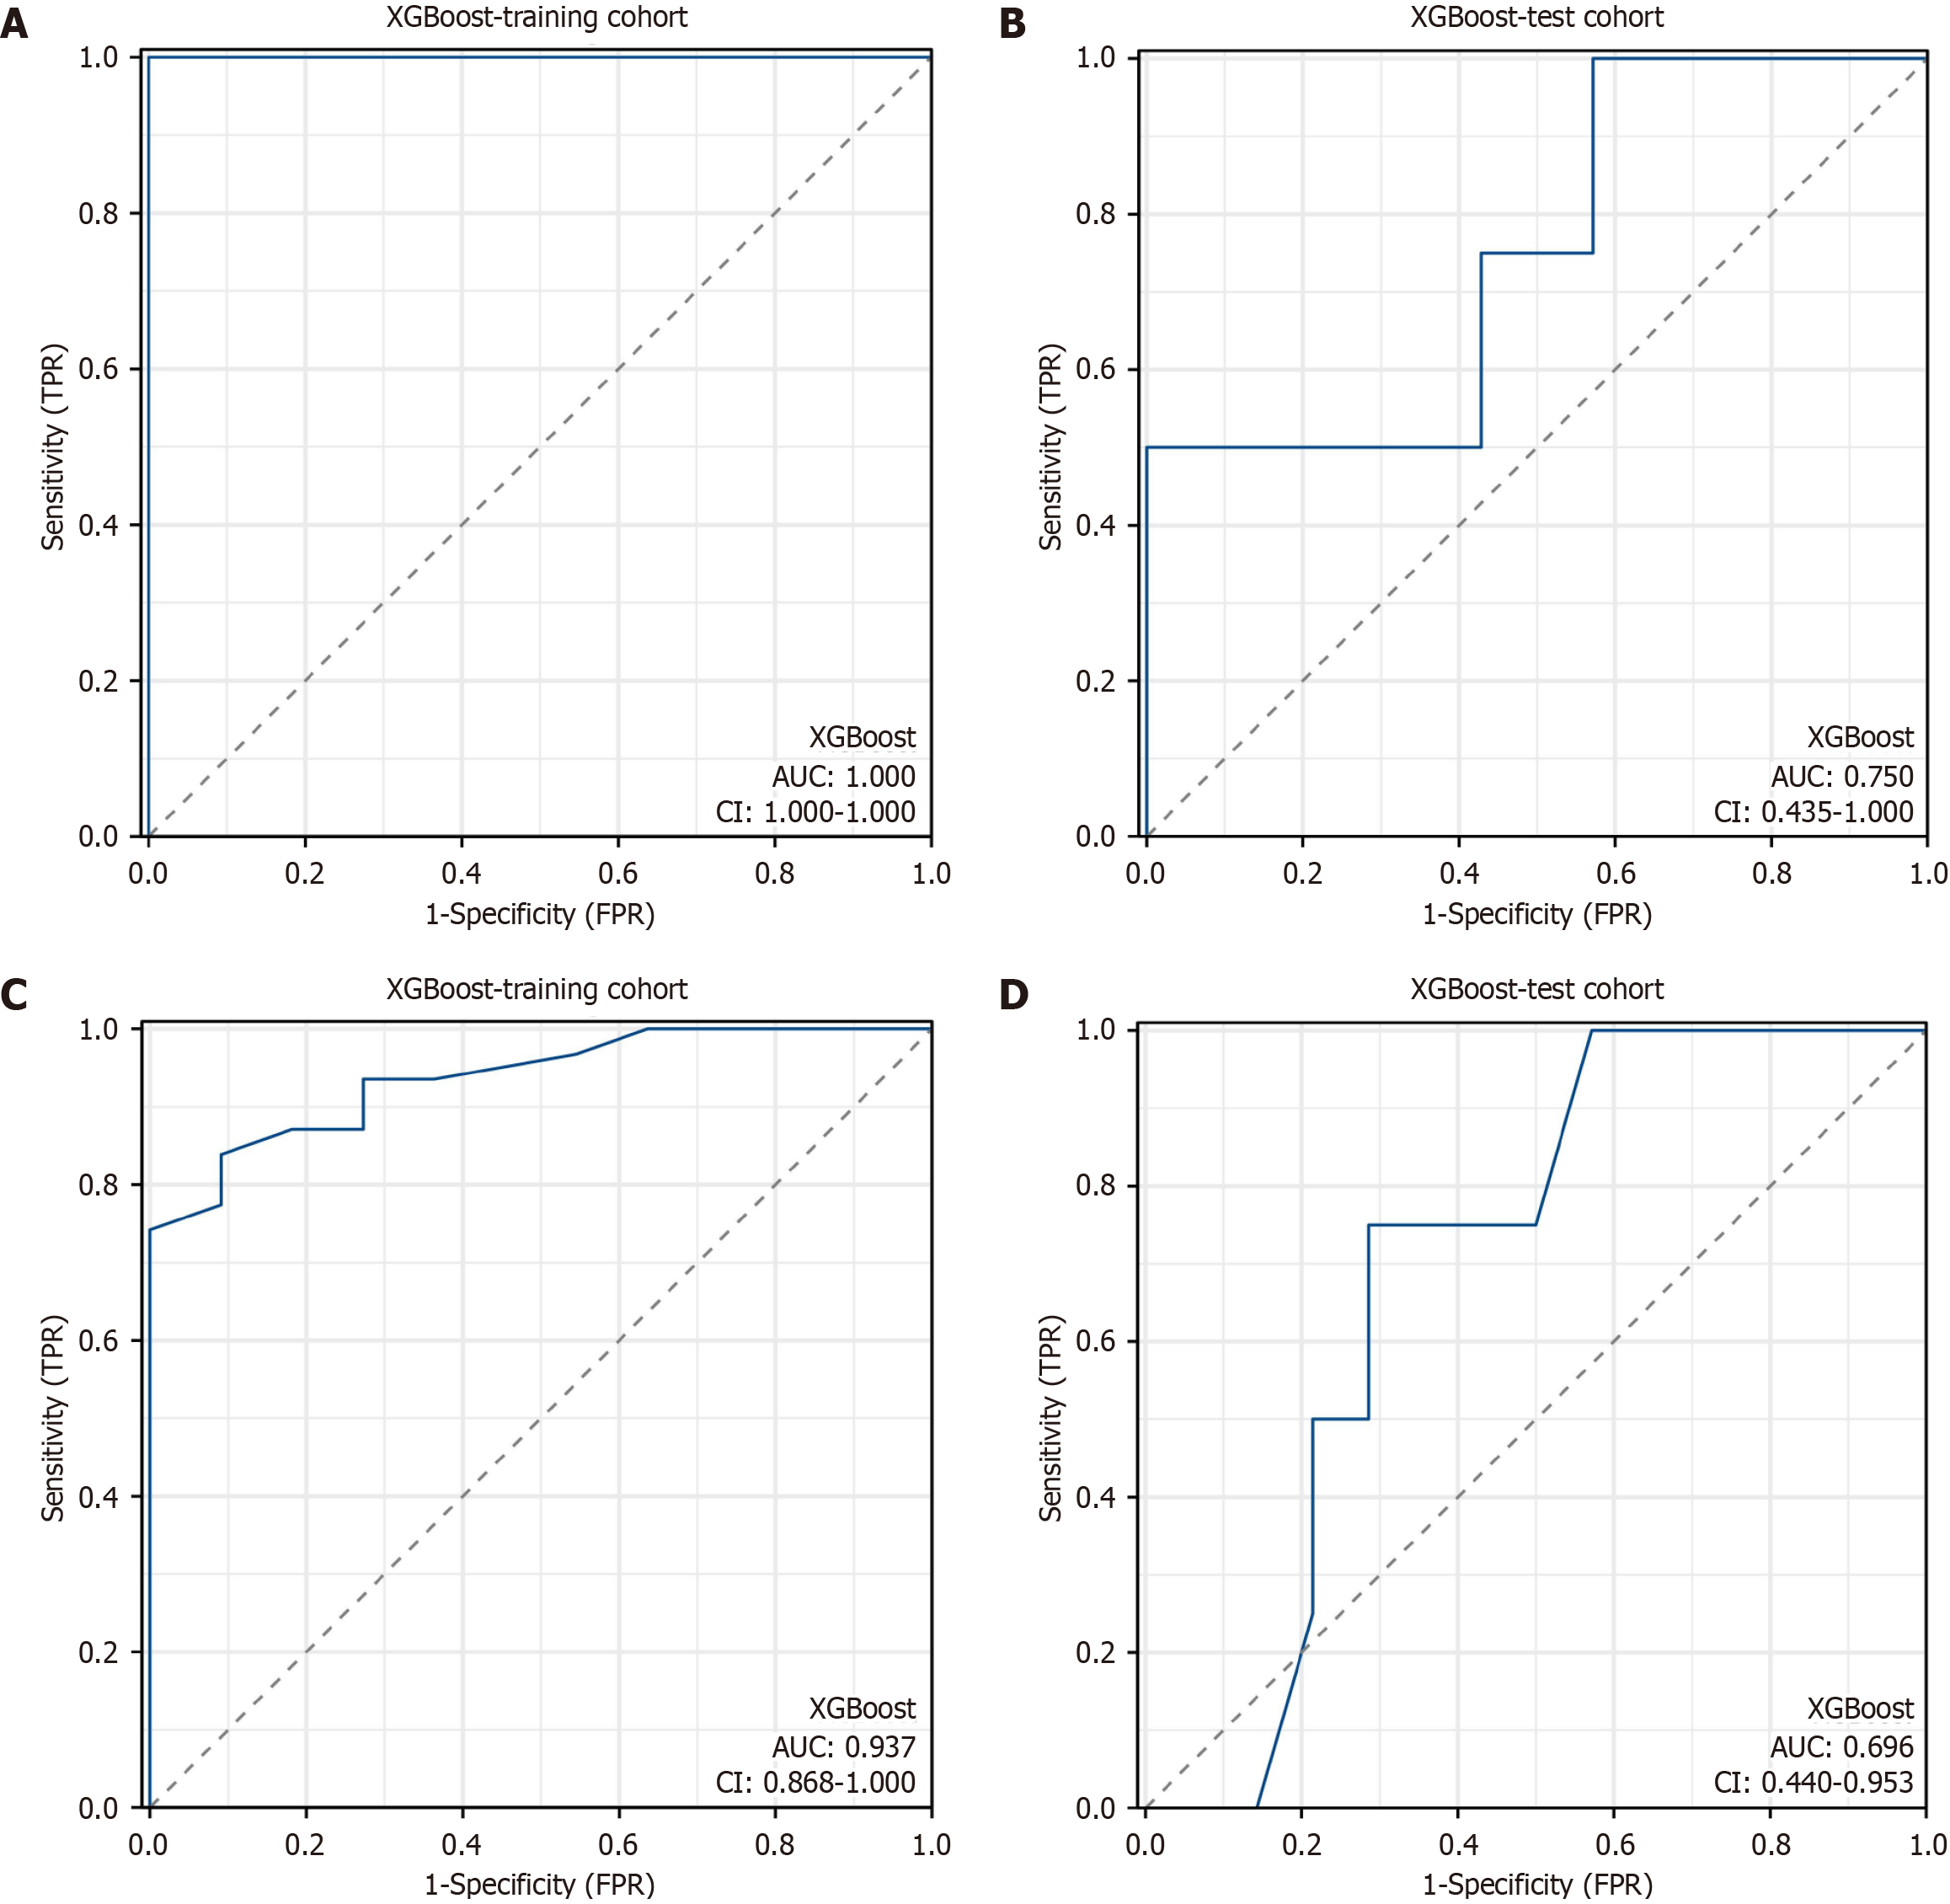
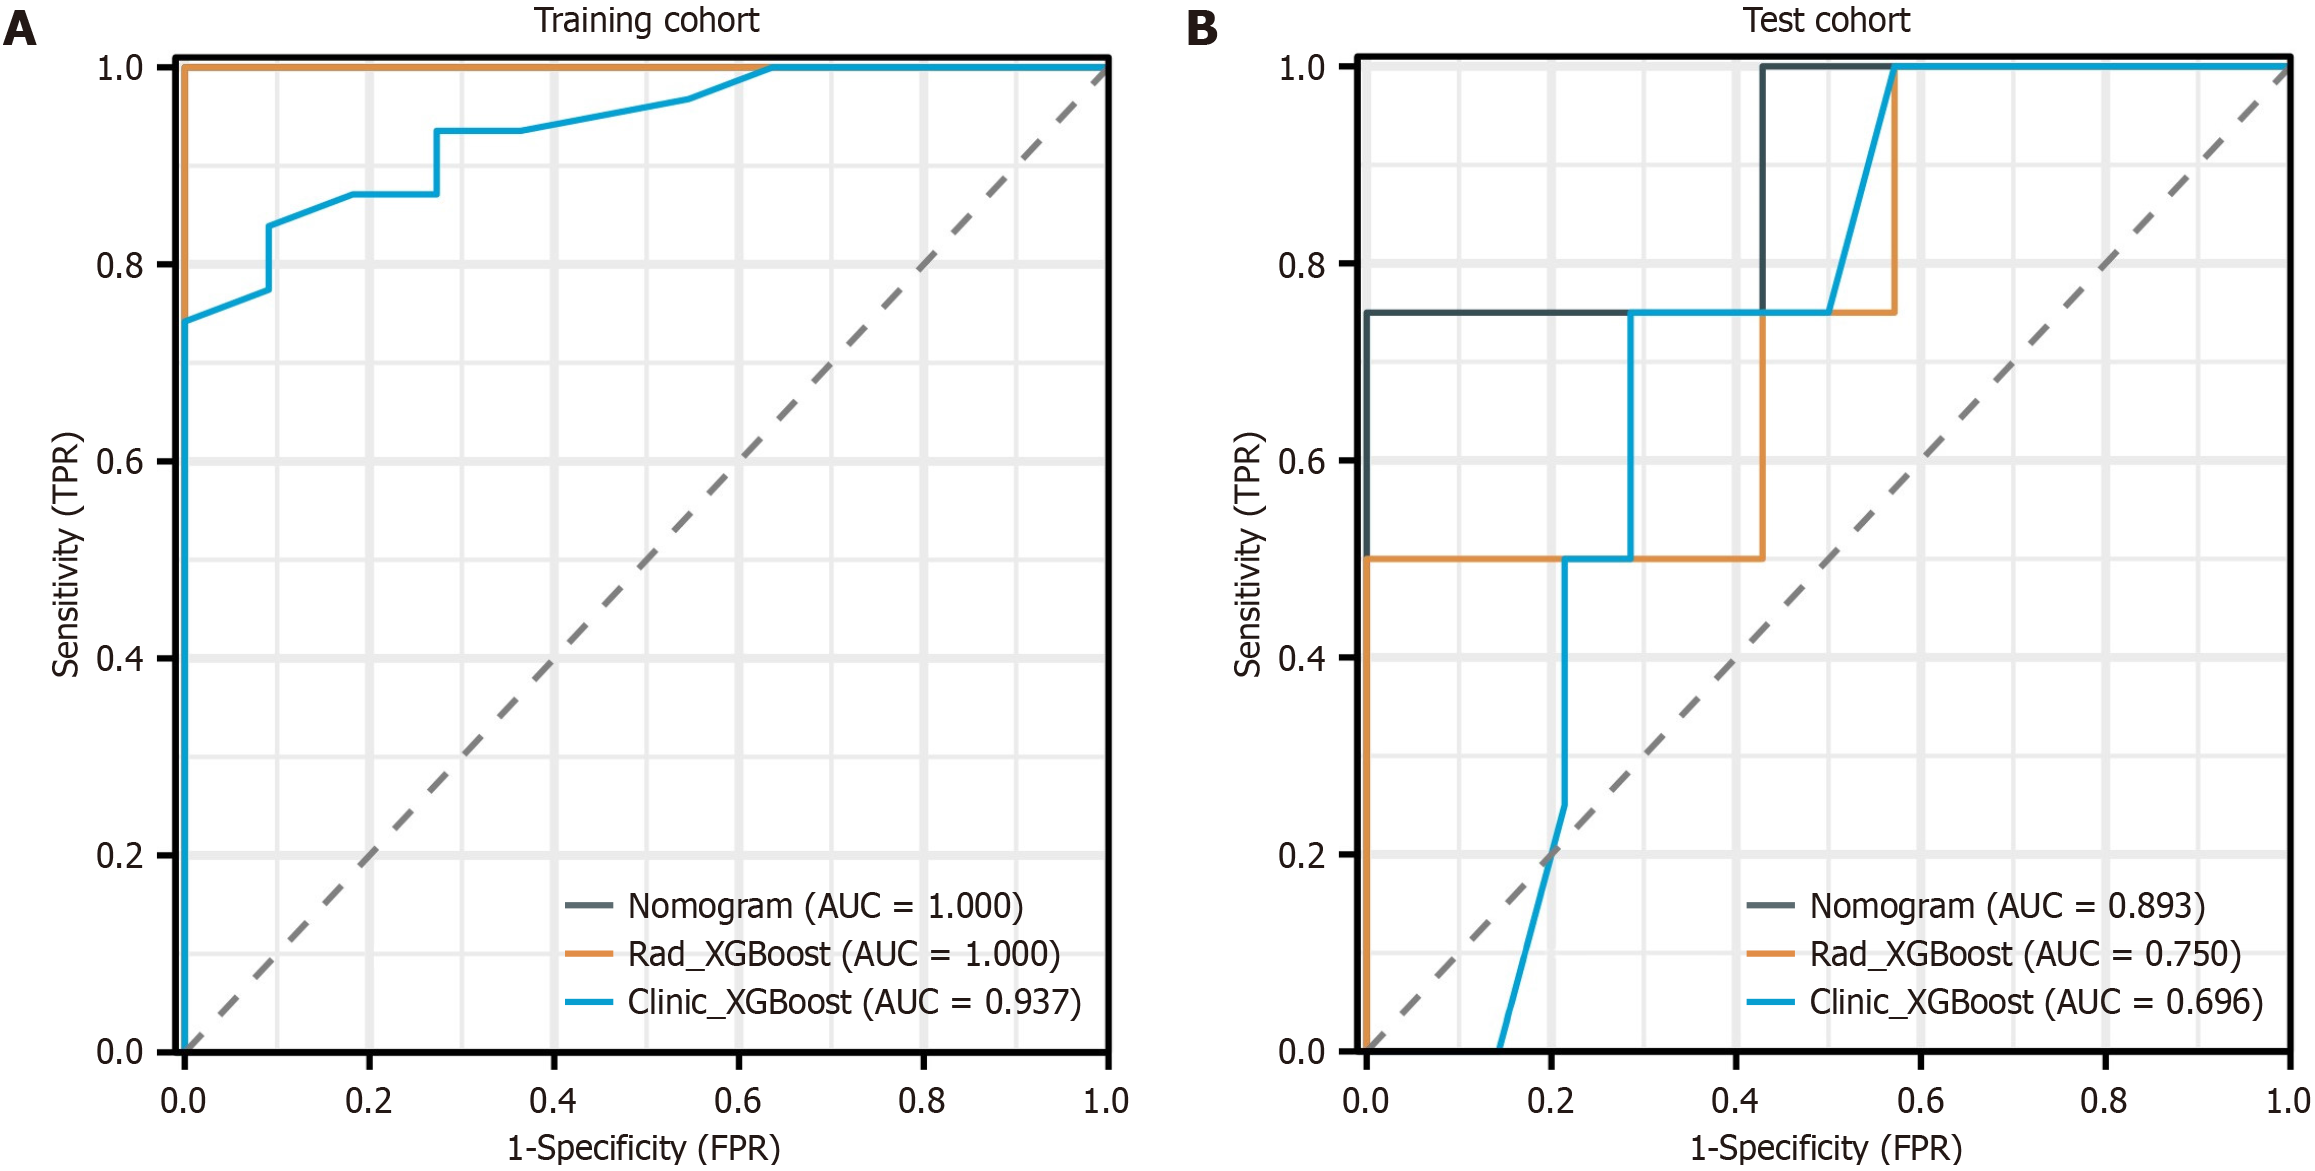
Figure 4 Receiver operating characteristic curve analysis of the radiomic model and the clinical model.
A: The area under the curve (AUC) of the radiomic model was 1.000 [95% confidence interval (CI): 1.000-1.000] in the training cohort; B: The AUC of the radiomic model was 0.750 (95%CI: 0.435-1.000) in the test cohort; C: The AUC of the clinical model was 0.937 (95%CI: 0.868-1.000) in the training cohort; D: The AUC of the clinical model was 0.696 (95%CI: 0.440-0.953) in the test cohort. XGBoost: EXtreme gradient boosting; TPR: True positive rate; FPR: False positive rate.
Figure 5 Radiomic nomogram for predicting the response of patients with advanced gastric cancer to neoadjuvant immunoche
Figure 6 Operating characteristic curve analysis of the nomogram.
A: Area under the curve (AUC) of 1.000 [95% confidence interval (CI): 1.000-1.000] in the training cohort of the nomogram; B: AUC of 0.893 (95%CI: 0.803-0.991) in the test cohort of the nomogram. The operating characteristic curves revealed that the AUCs of the nomogram were superior to those of both the radiomic signature and the clinical signature. AUC: Area under the curve; XGBoost: EXtreme gradient boosting; TPR: True positive rate; FPR: False positive rate.
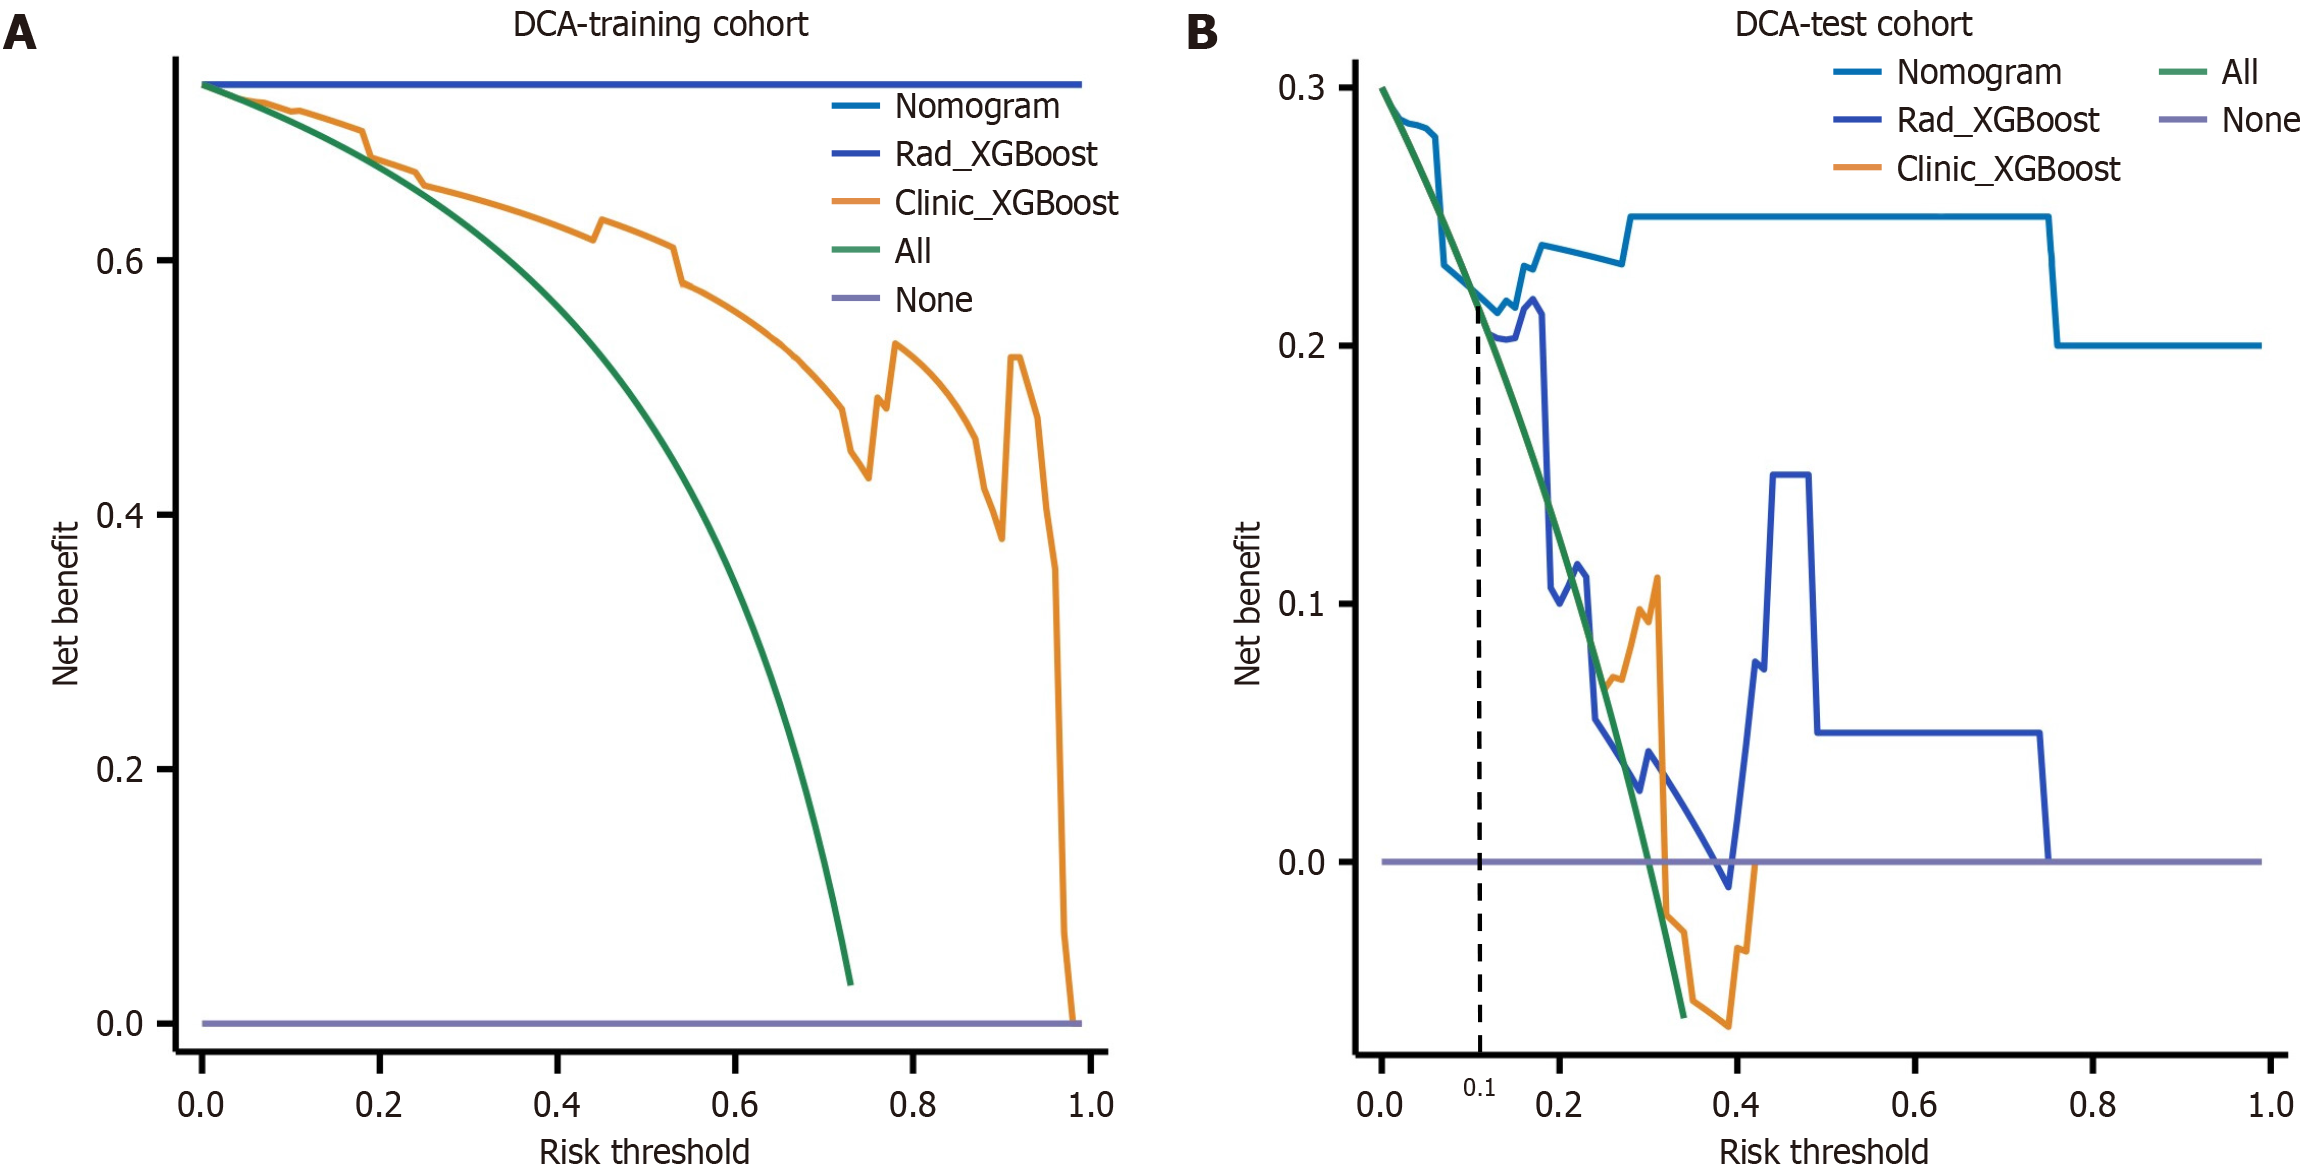
Figure 7 Decision curves were generated to compare the differences in the net benefit of the various models.
A: Decision curves in the training cohort; B: Decision curves in the test cohort. The X-axis indicates the threshold probability, and the Y-axis indicates the net benefit. The decision curve revealed that when the threshold probability exceeded 10%, the net benefit of the clinical application of the nomogram exceeded that of the other models in the test cohort. XGBoost: EXtreme gradient boosting; DCA: Decision curve analysis.
- Citation: Zhang J, Wang Q, Guo TH, Gao W, Yu YM, Wang RF, Yu HL, Chen JJ, Sun LL, Zhang BY, Wang HJ. Computed tomography-based radiomic model for the prediction of neoadjuvant immunochemotherapy response in patients with advanced gastric cancer. World J Gastrointest Oncol 2024; 16(10): 4115-4128
- URL: https://www.wjgnet.com/1948-5204/full/v16/i10/4115.htm
- DOI: https://dx.doi.org/10.4251/wjgo.v16.i10.4115


