Copyright
©The Author(s) 2024.
World J Gastrointest Oncol. Jan 15, 2024; 16(1): 79-89
Published online Jan 15, 2024. doi: 10.4251/wjgo.v16.i1.79
Published online Jan 15, 2024. doi: 10.4251/wjgo.v16.i1.79
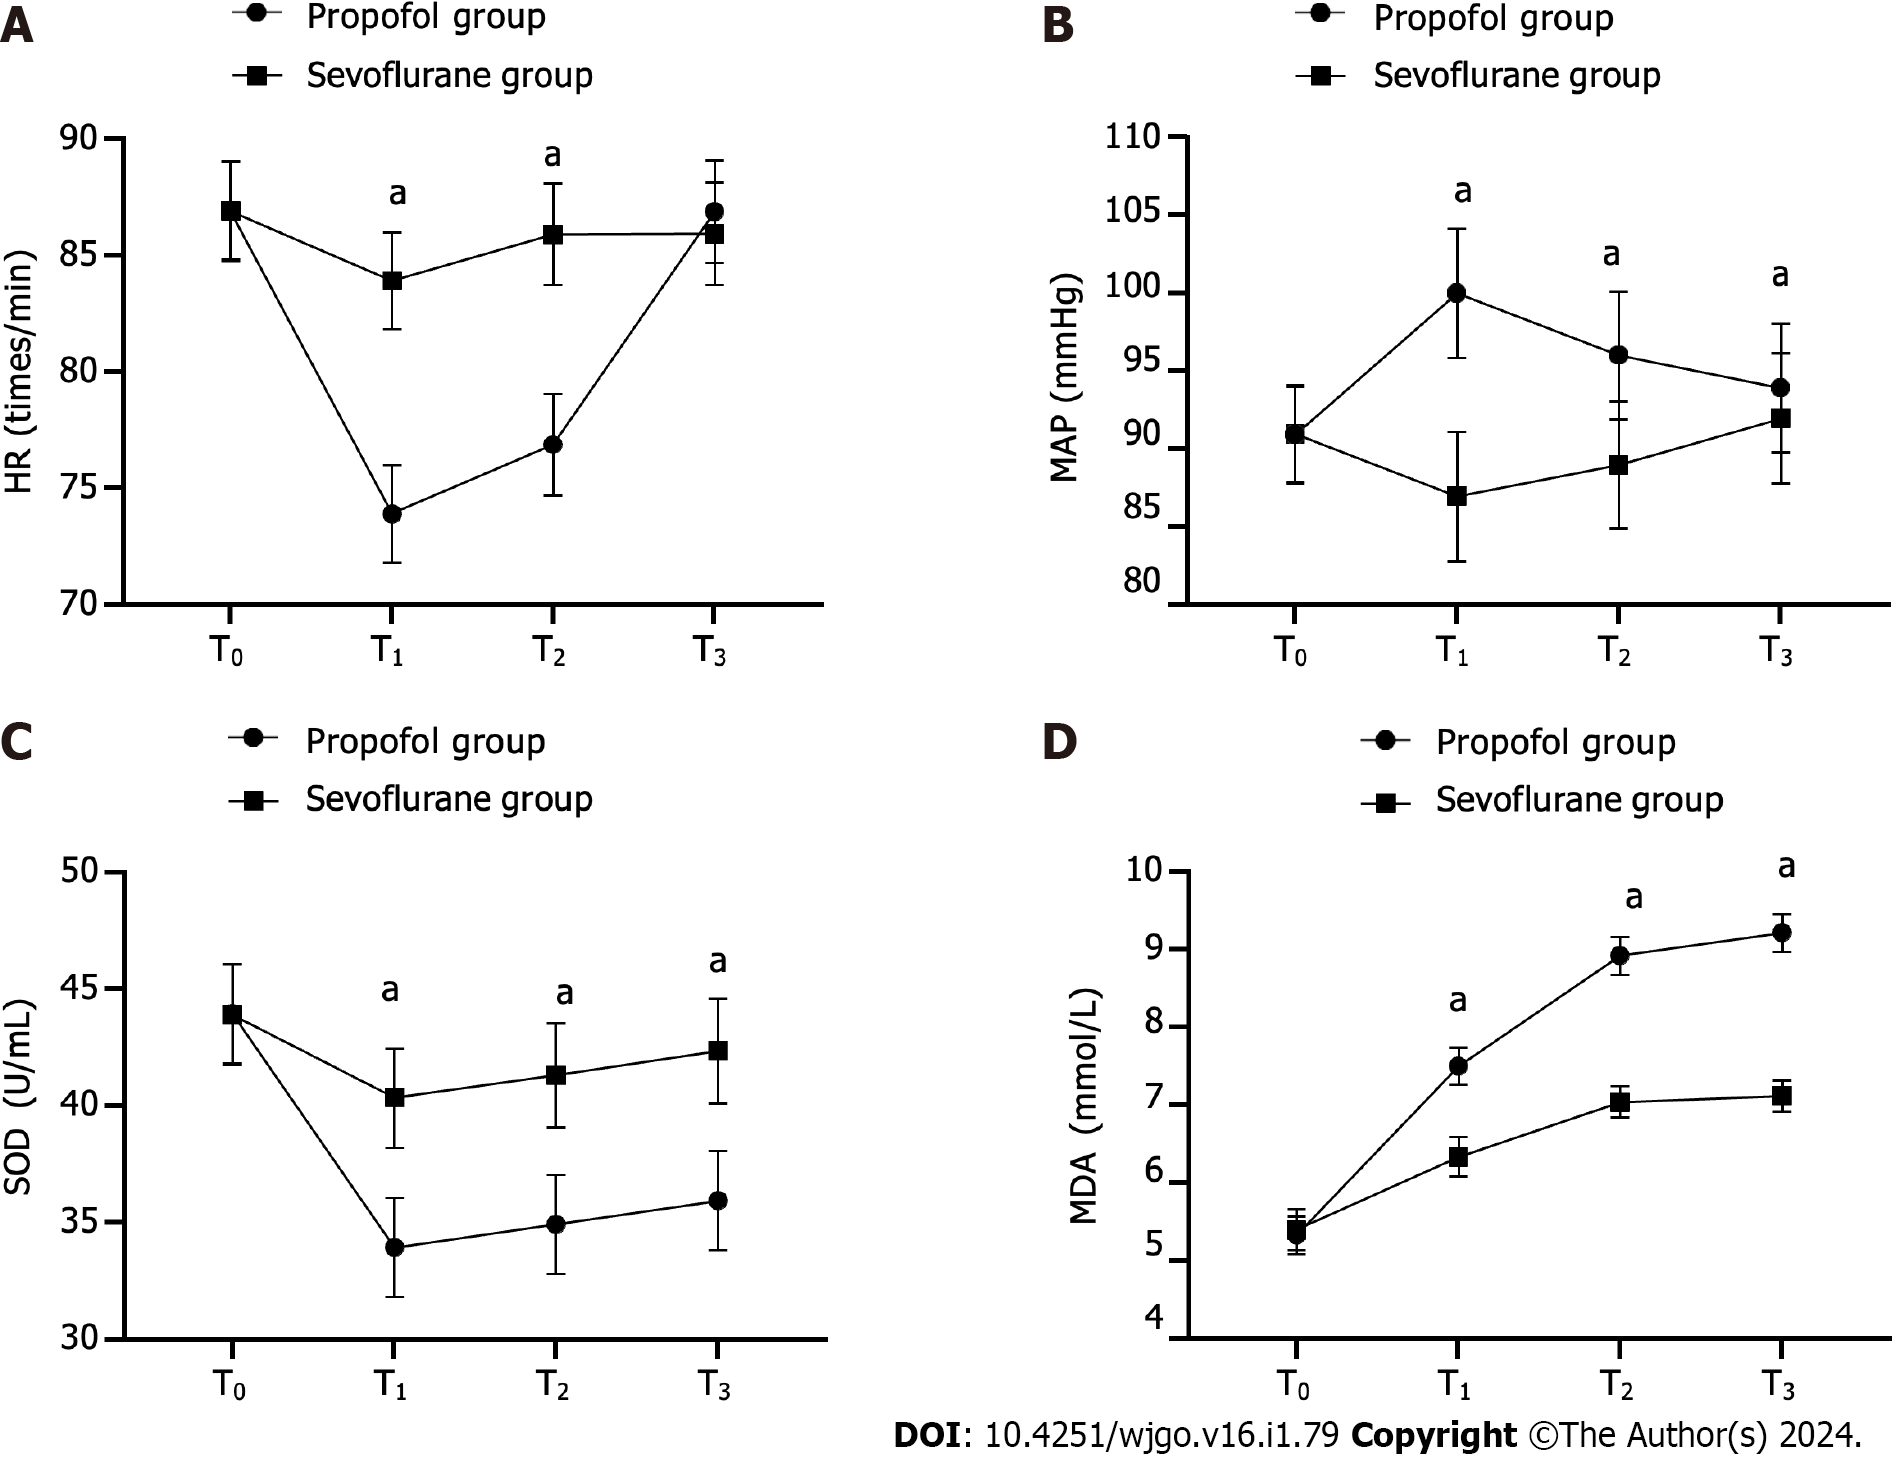
Figure 1 Comparison of physiological stress indices (mean ± SD).
A: Comparison of heart rate (times/min) at different time points; B: Comparison of mean arterial pressure (mmHg) at different time points; C: Comparison of superoxide dismutase (U/mL) at different time points; D: Comparison of malondialdehyde (mmol/L) at different time points; aP < 0.05. HR: Heart rate; MAP: Mean arterial pressure; SOD: Superoxide dismutase; MDA: Malondialdehyde; T0: Before anesthesia; T1: 30 min after anesthesia; T2: At the conclusion of surgery; T3: 1 h following surgery.
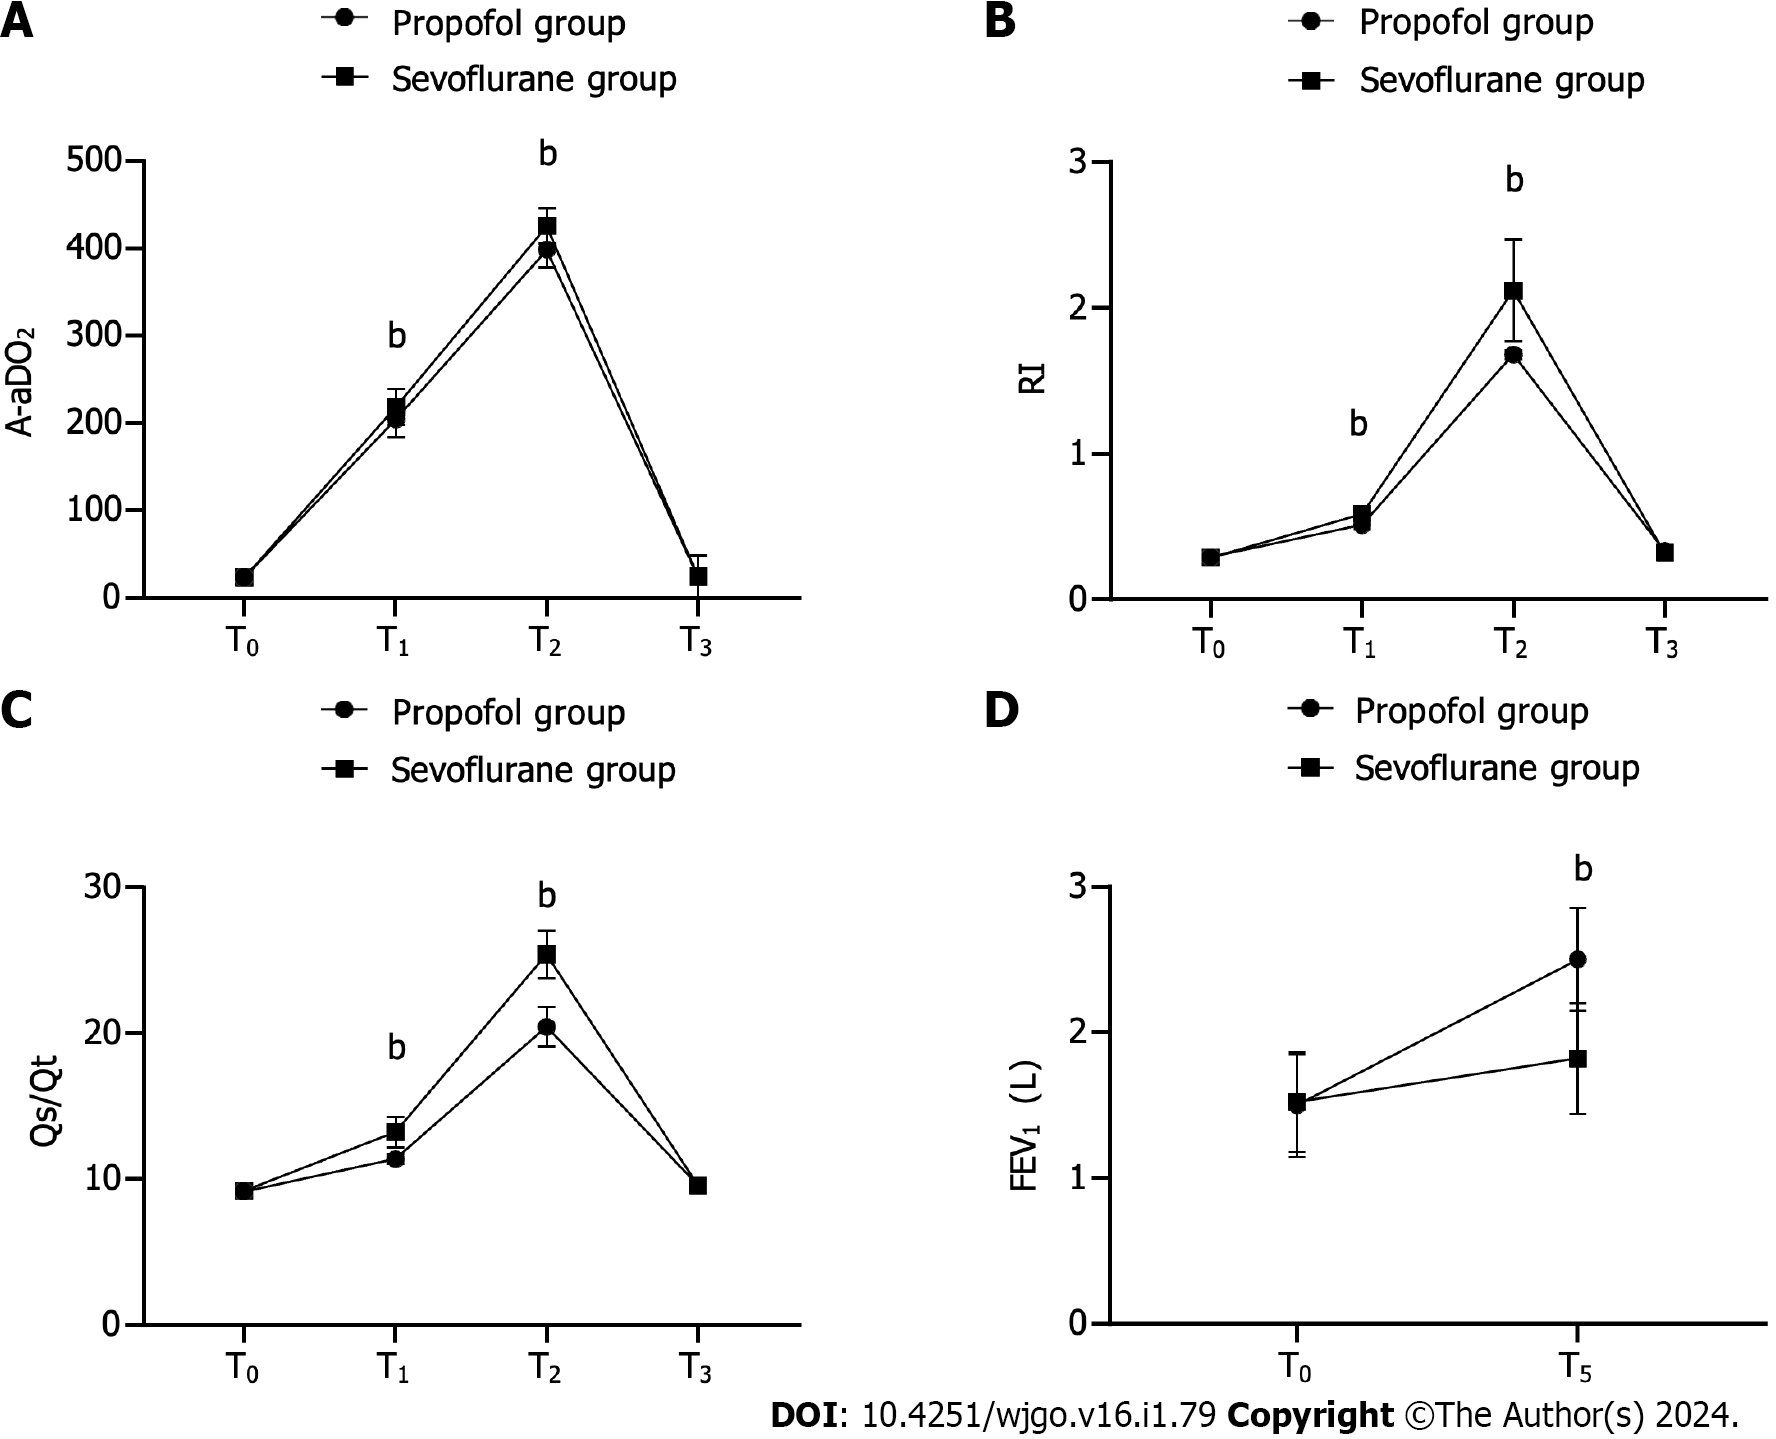
Figure 2 Comparison of pulmonary function indices (mean ± SD).
A: Comparison of alveolar-arterial oxygen tension difference at different time points; B: Comparison of respiratory index at different time points; C: Comparison of pulmonary shunt fraction at different time points; D: Comparison of forced expiratory volume in 1 s (L) at different time points; bP < 0.001. A-aDO2: Alveolar-arterial oxygen tension difference; RI: Respiratory index; Qs/Qt: Pulmonary shunt fraction; FEV1: Forced expiratory volume in 1; T0: Before anesthesia; T1: 30 min after anesthesia; T2: At the conclusion of surgery; T3: 1 h following surgery; T5: 7 d after surgery.
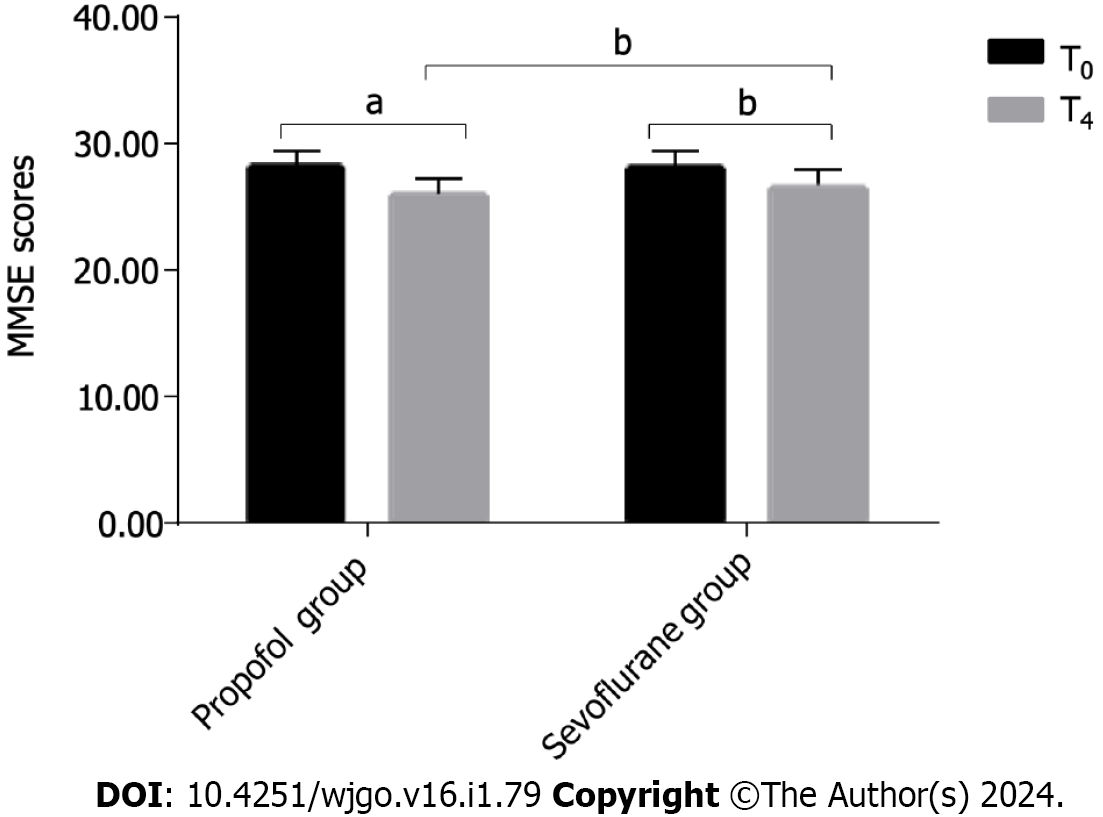
Figure 3 Comparison of mini-mental state examination scores (mean ± SD).
aP < 0.05, bP < 0.01. MMSE: Mini-mental state examination; T0: Before anesthesia; T4: 1 d after surgery.
- Citation: Li AH, Bu S, Wang L, Liang AM, Luo HY. Impact of propofol and sevoflurane anesthesia on cognition and emotion in gastric cancer patients undergoing radical resection. World J Gastrointest Oncol 2024; 16(1): 79-89
- URL: https://www.wjgnet.com/1948-5204/full/v16/i1/79.htm
- DOI: https://dx.doi.org/10.4251/wjgo.v16.i1.79


