Copyright
©The Author(s) 2024.
World J Gastrointest Oncol. Jan 15, 2024; 16(1): 214-233
Published online Jan 15, 2024. doi: 10.4251/wjgo.v16.i1.214
Published online Jan 15, 2024. doi: 10.4251/wjgo.v16.i1.214
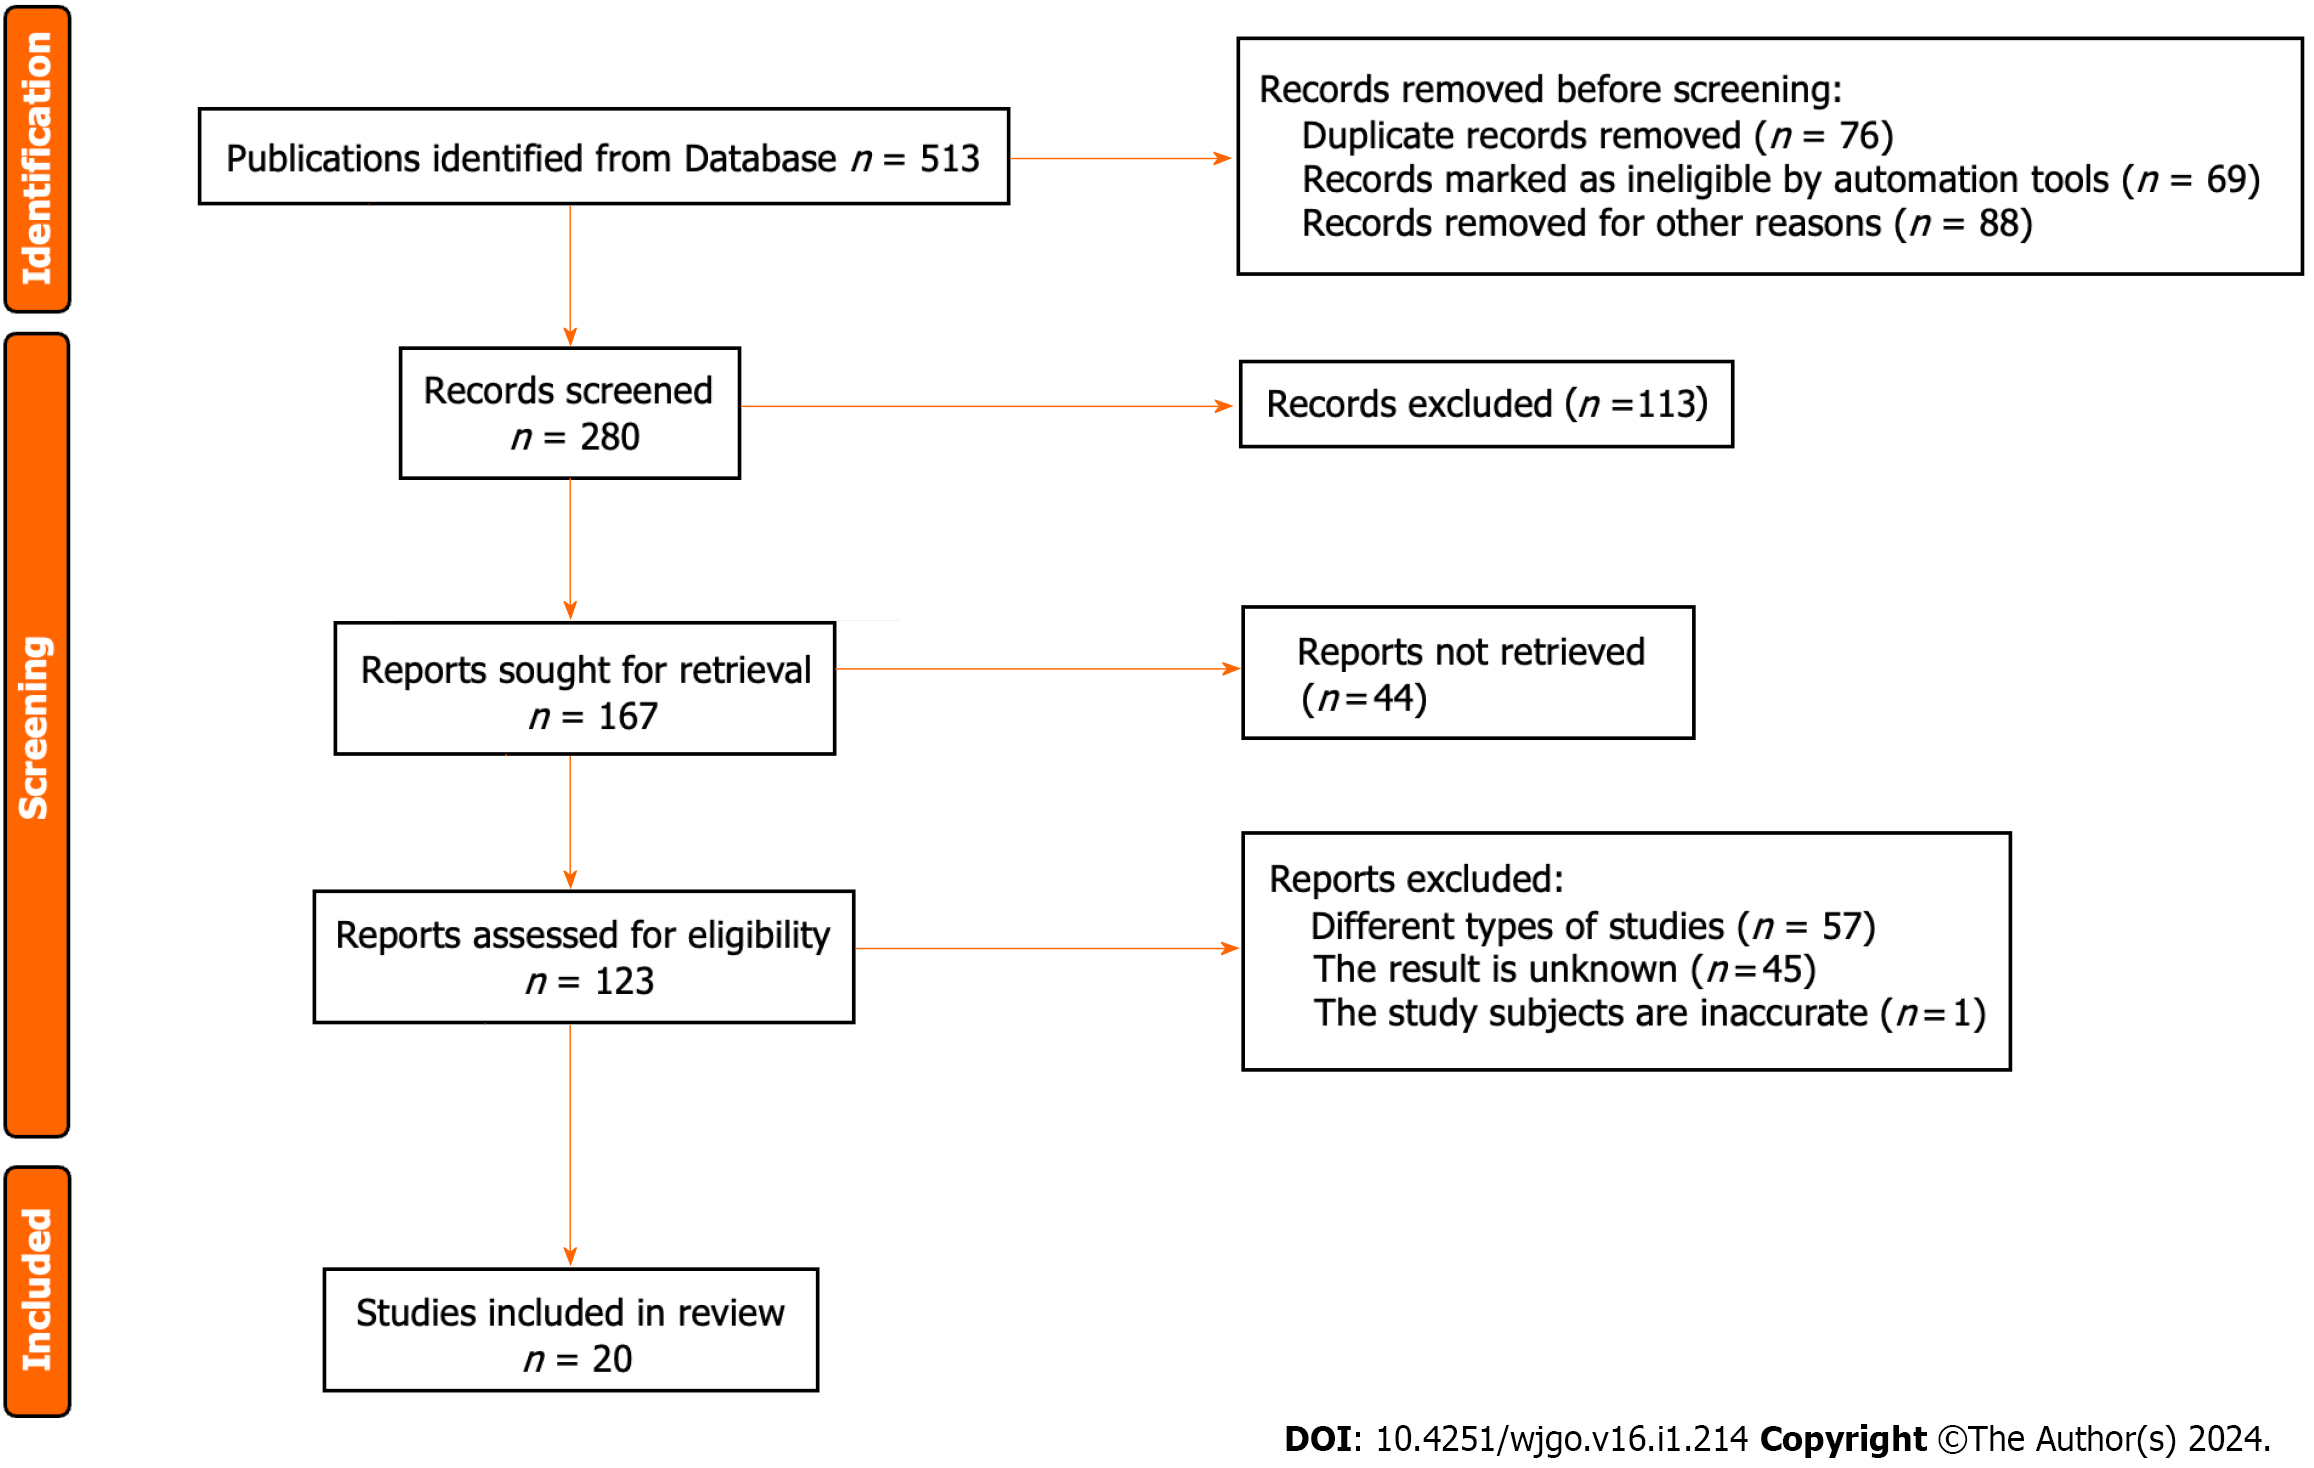
Figure 1 The methods for retrieving the literature.
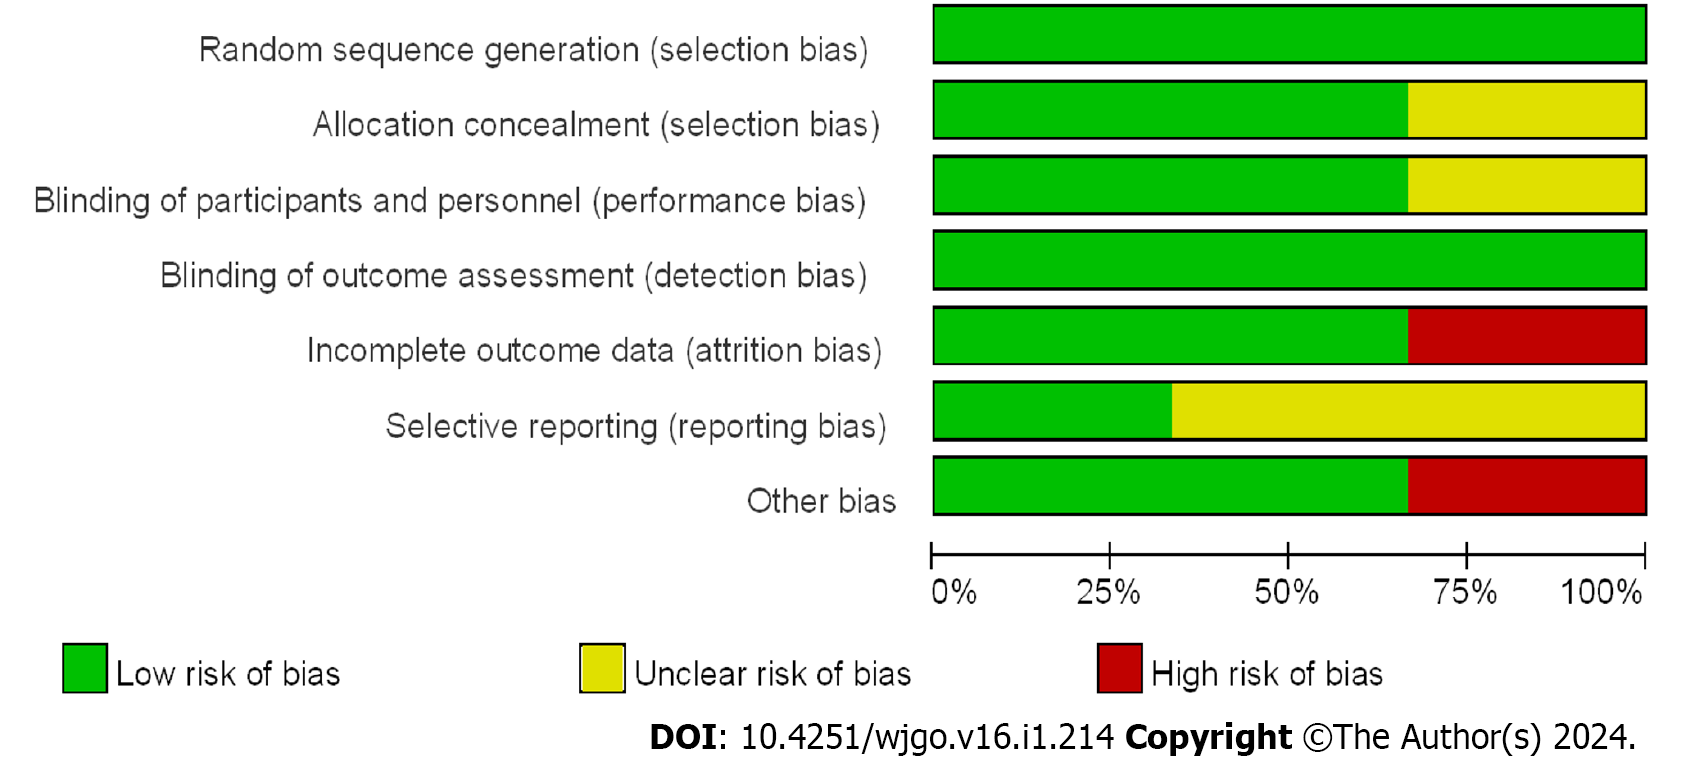
Figure 2 Reference risk bias assessment.
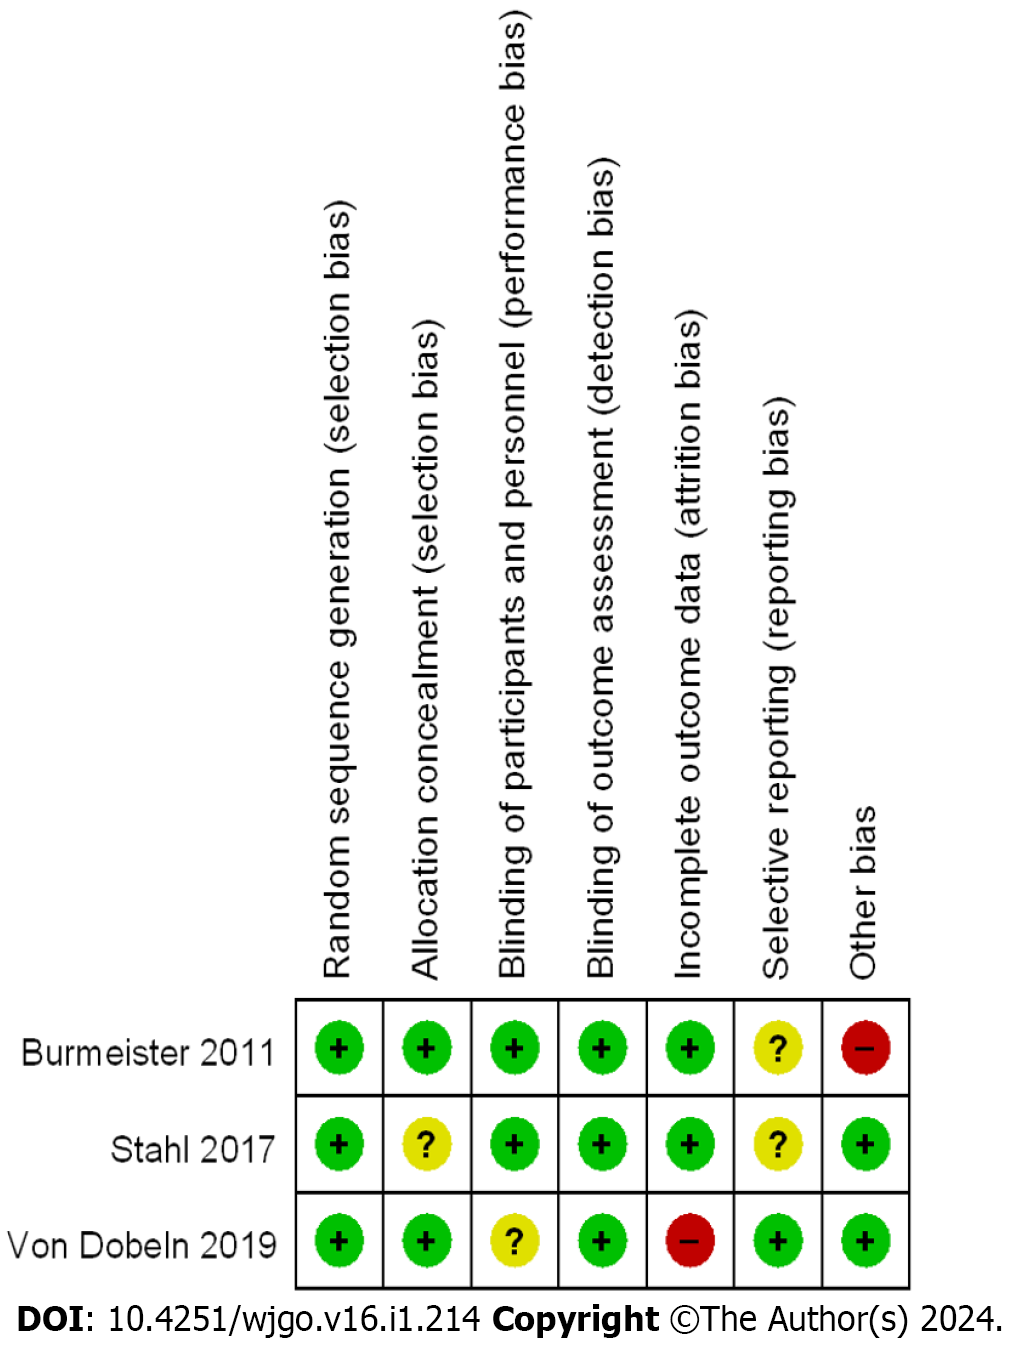
Figure 3 Summary of risk bias.
+: Low risk, -: High risk; ?: Unclear risk.
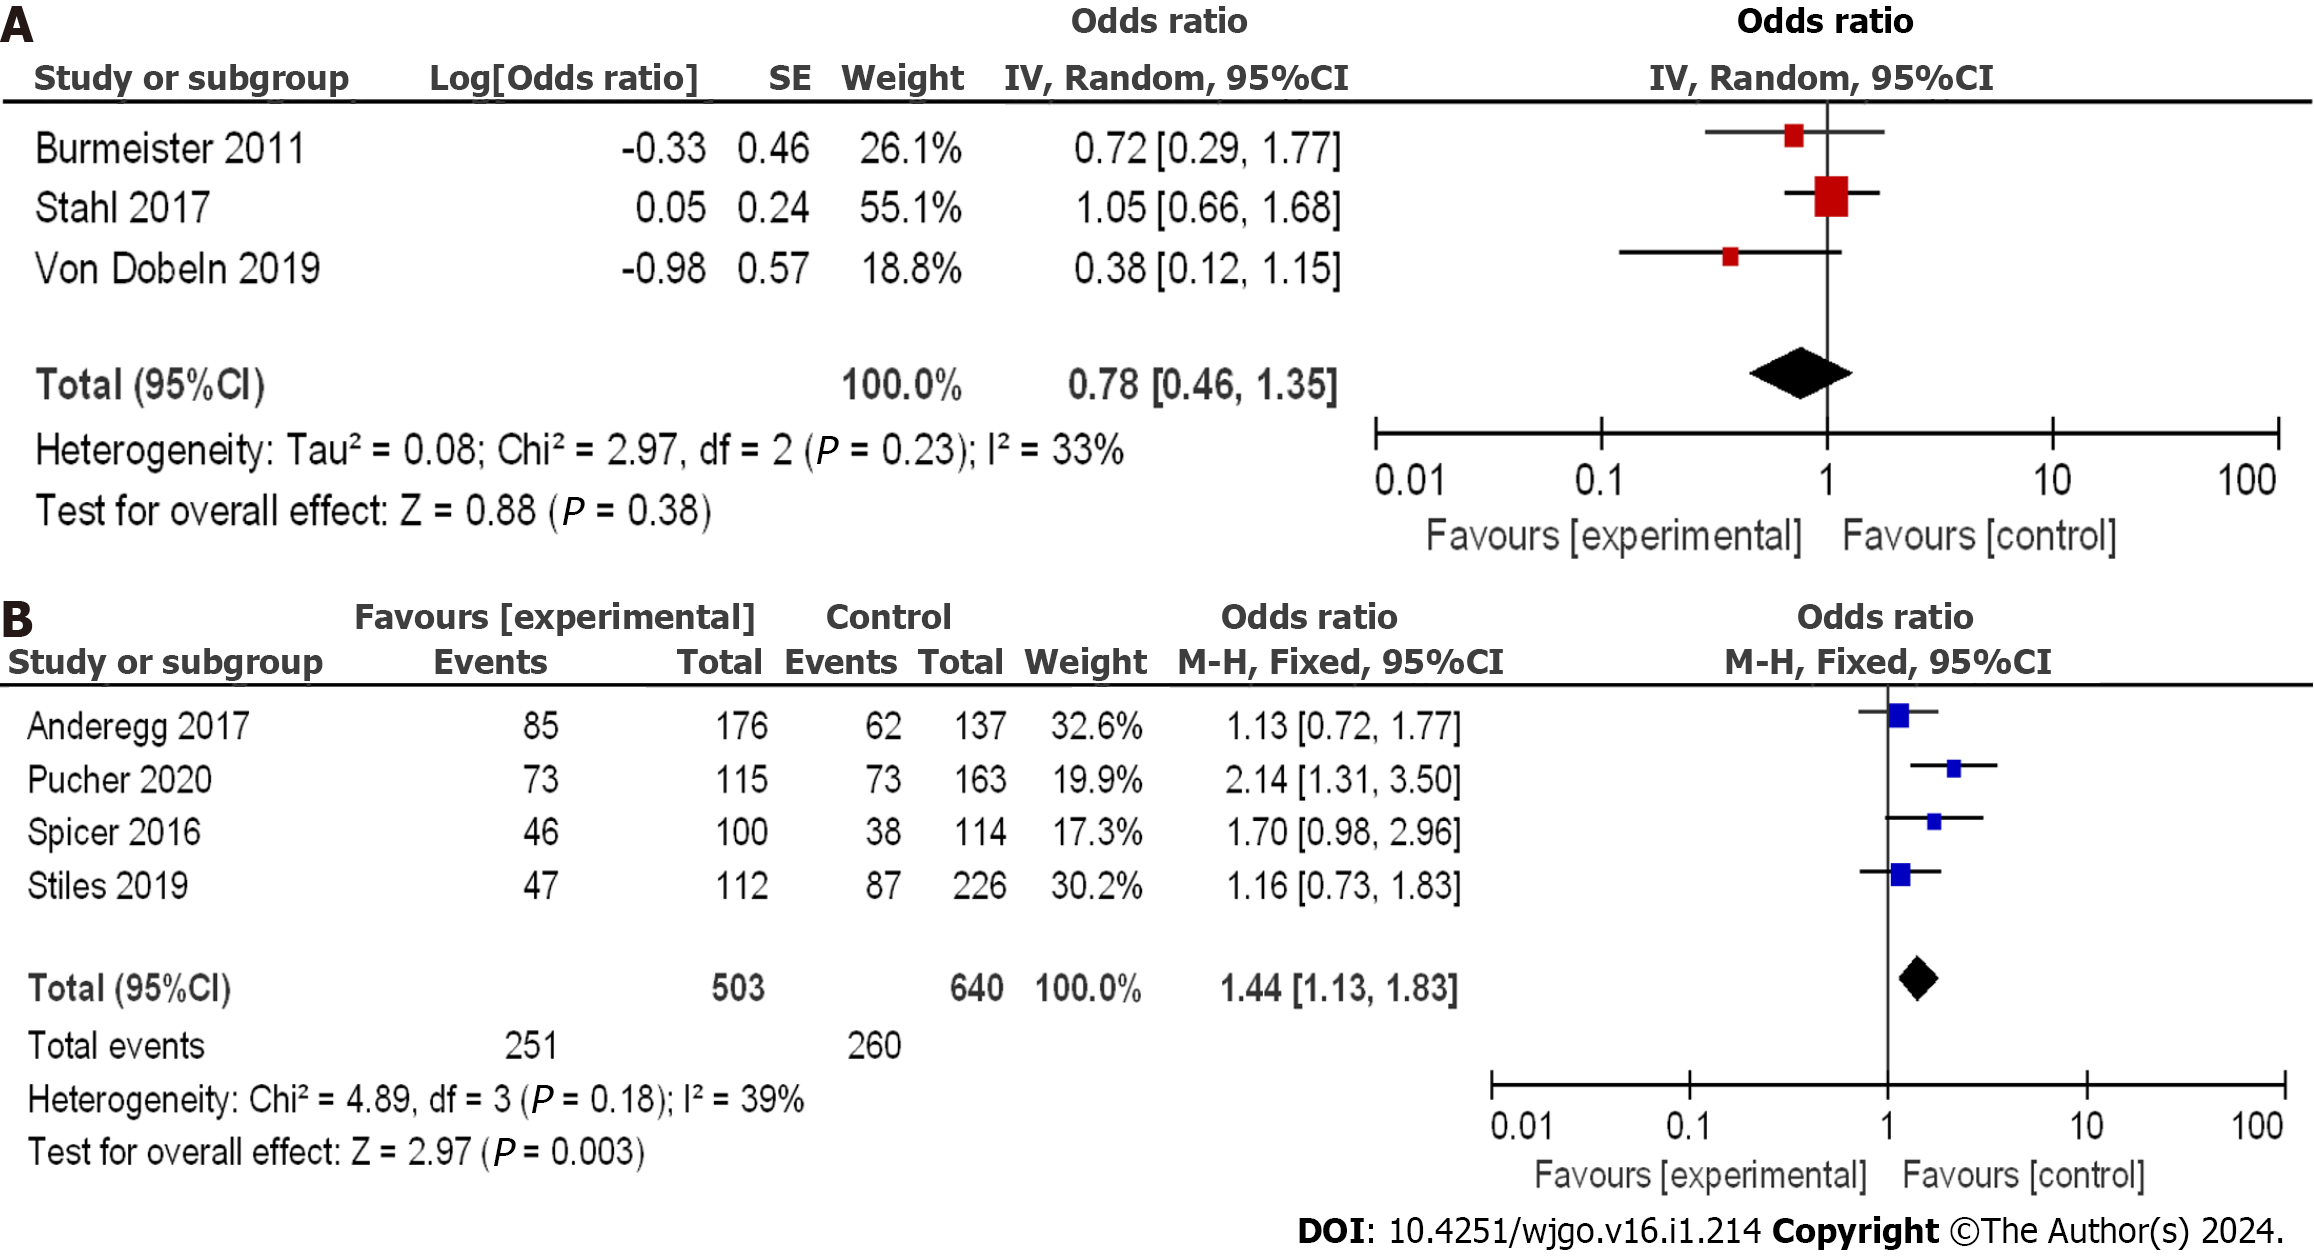
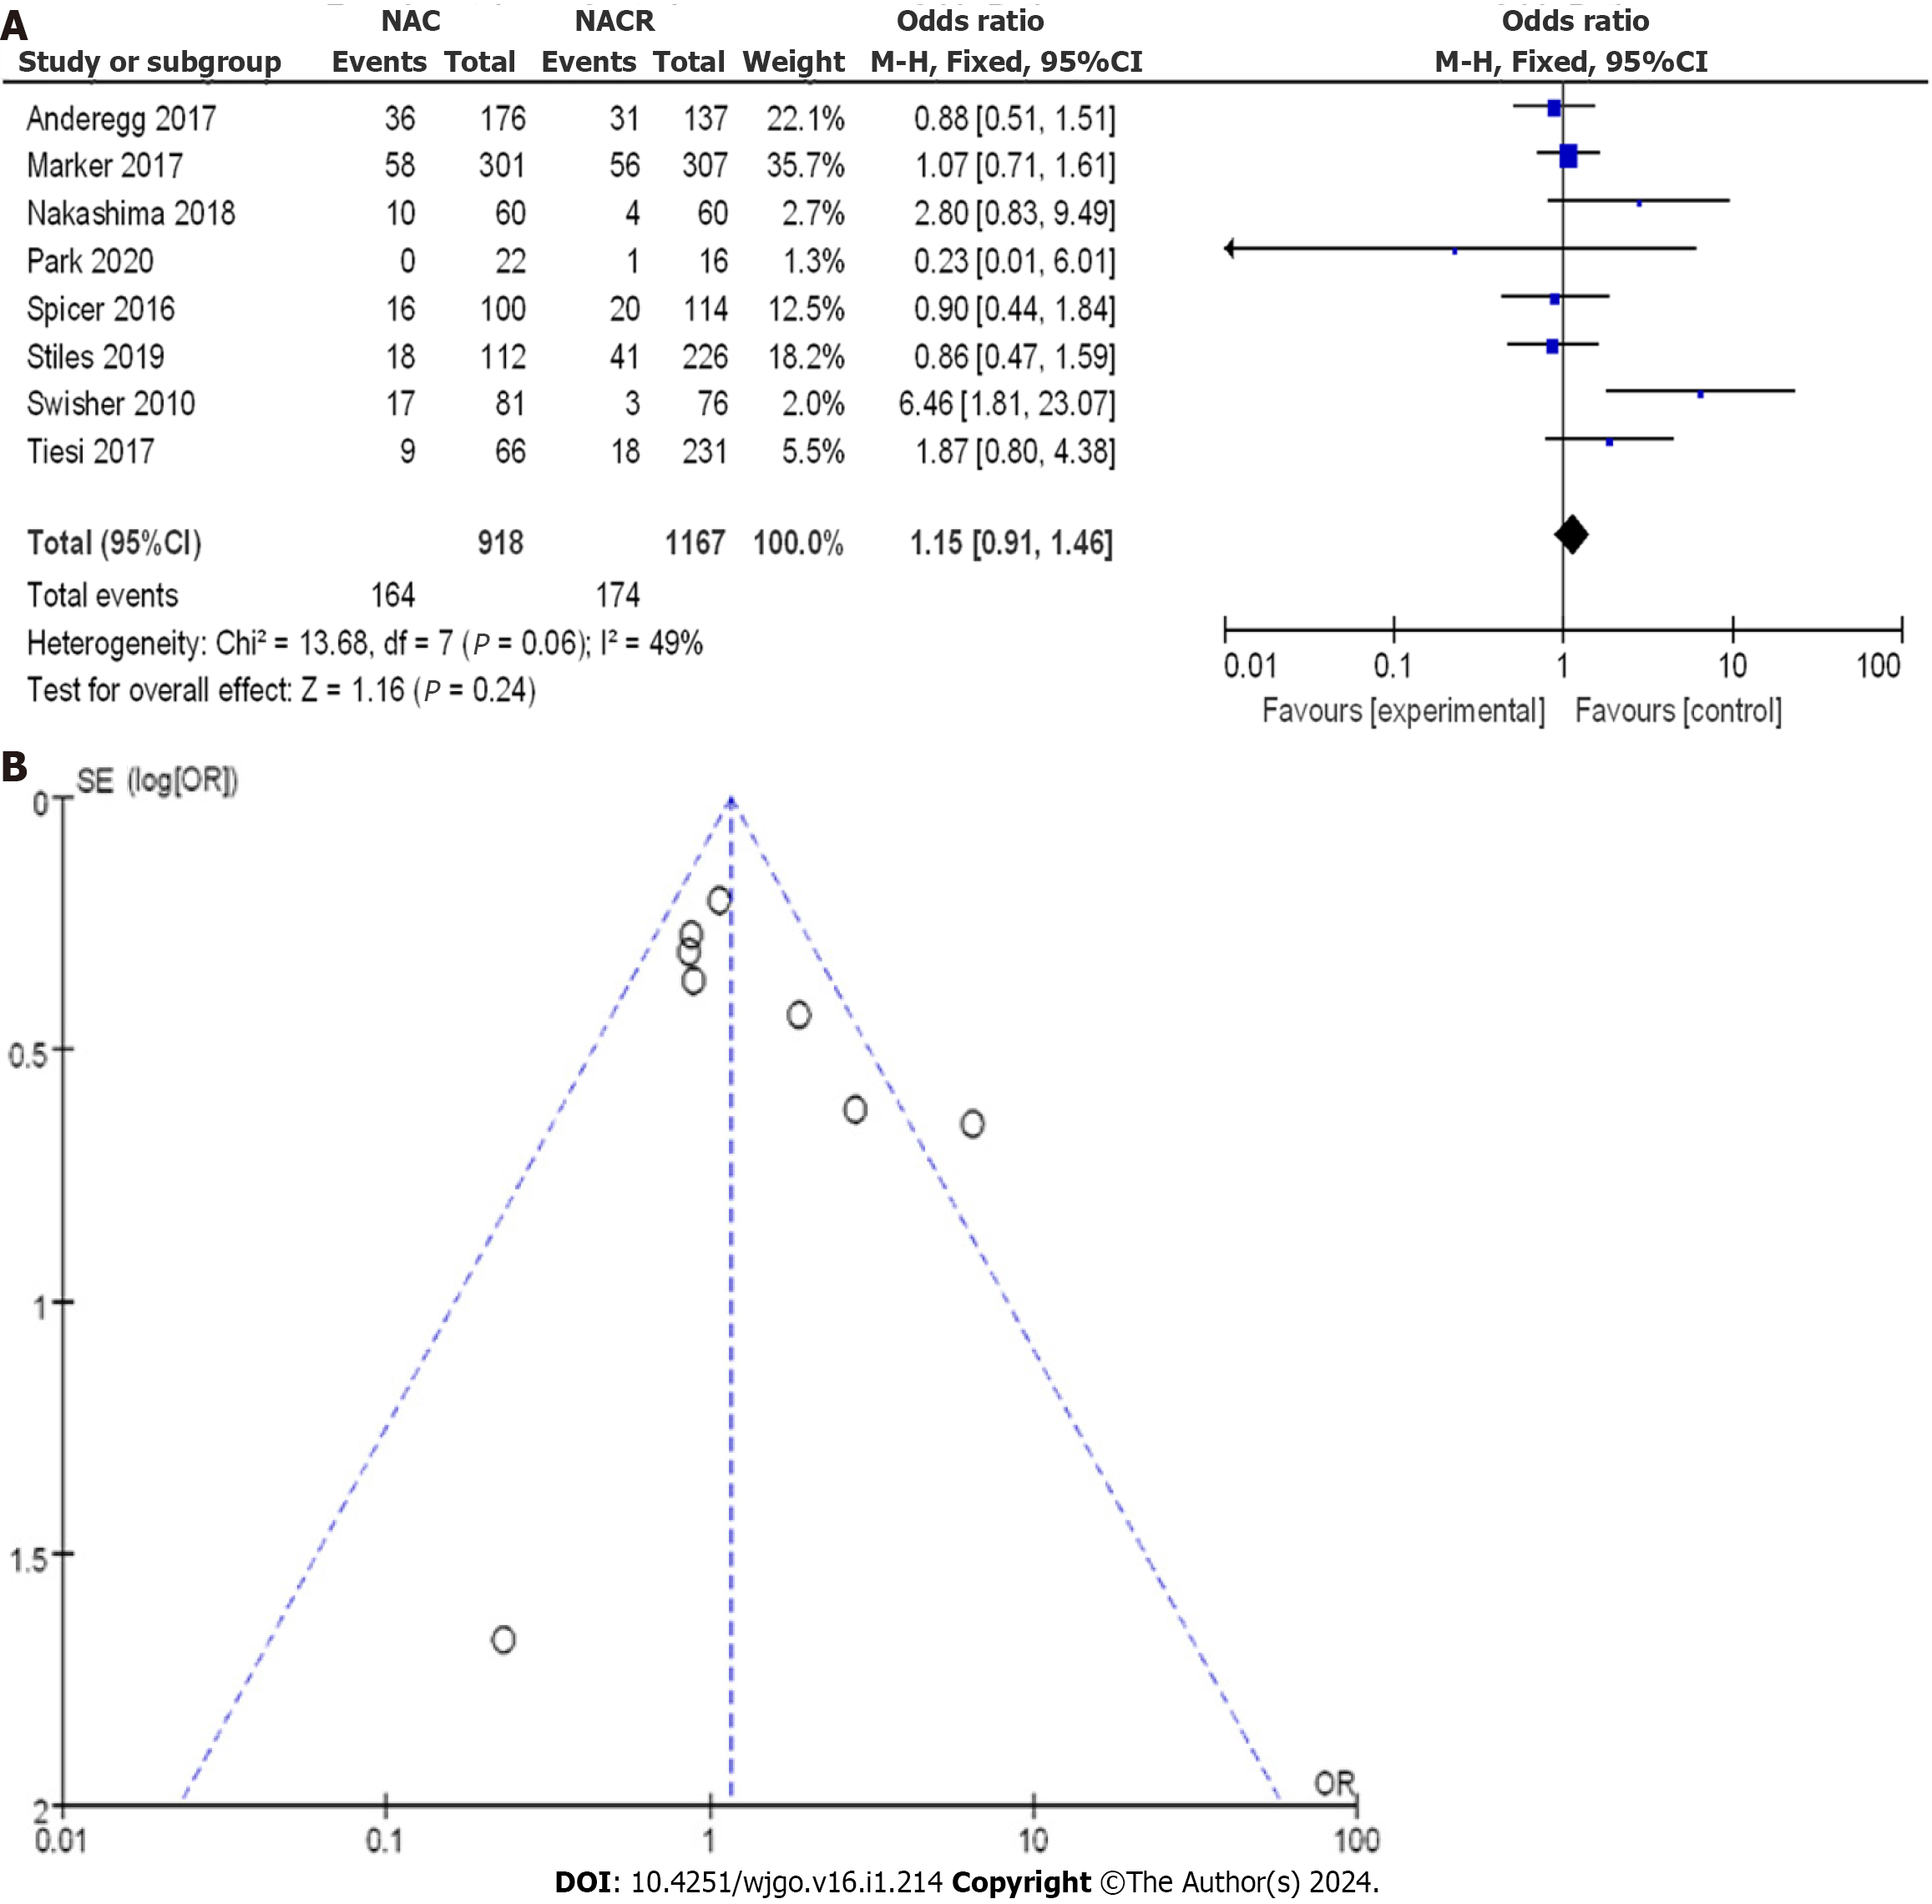
Figure 4 Forest plot of neoadjuvant chemoradiotherapy vs neoadjuvant chemotherapy in 3-year disease-free survival.
A: Randomized controlled trials; B: Case-control studies). 95%CI: 95% confidence interval.
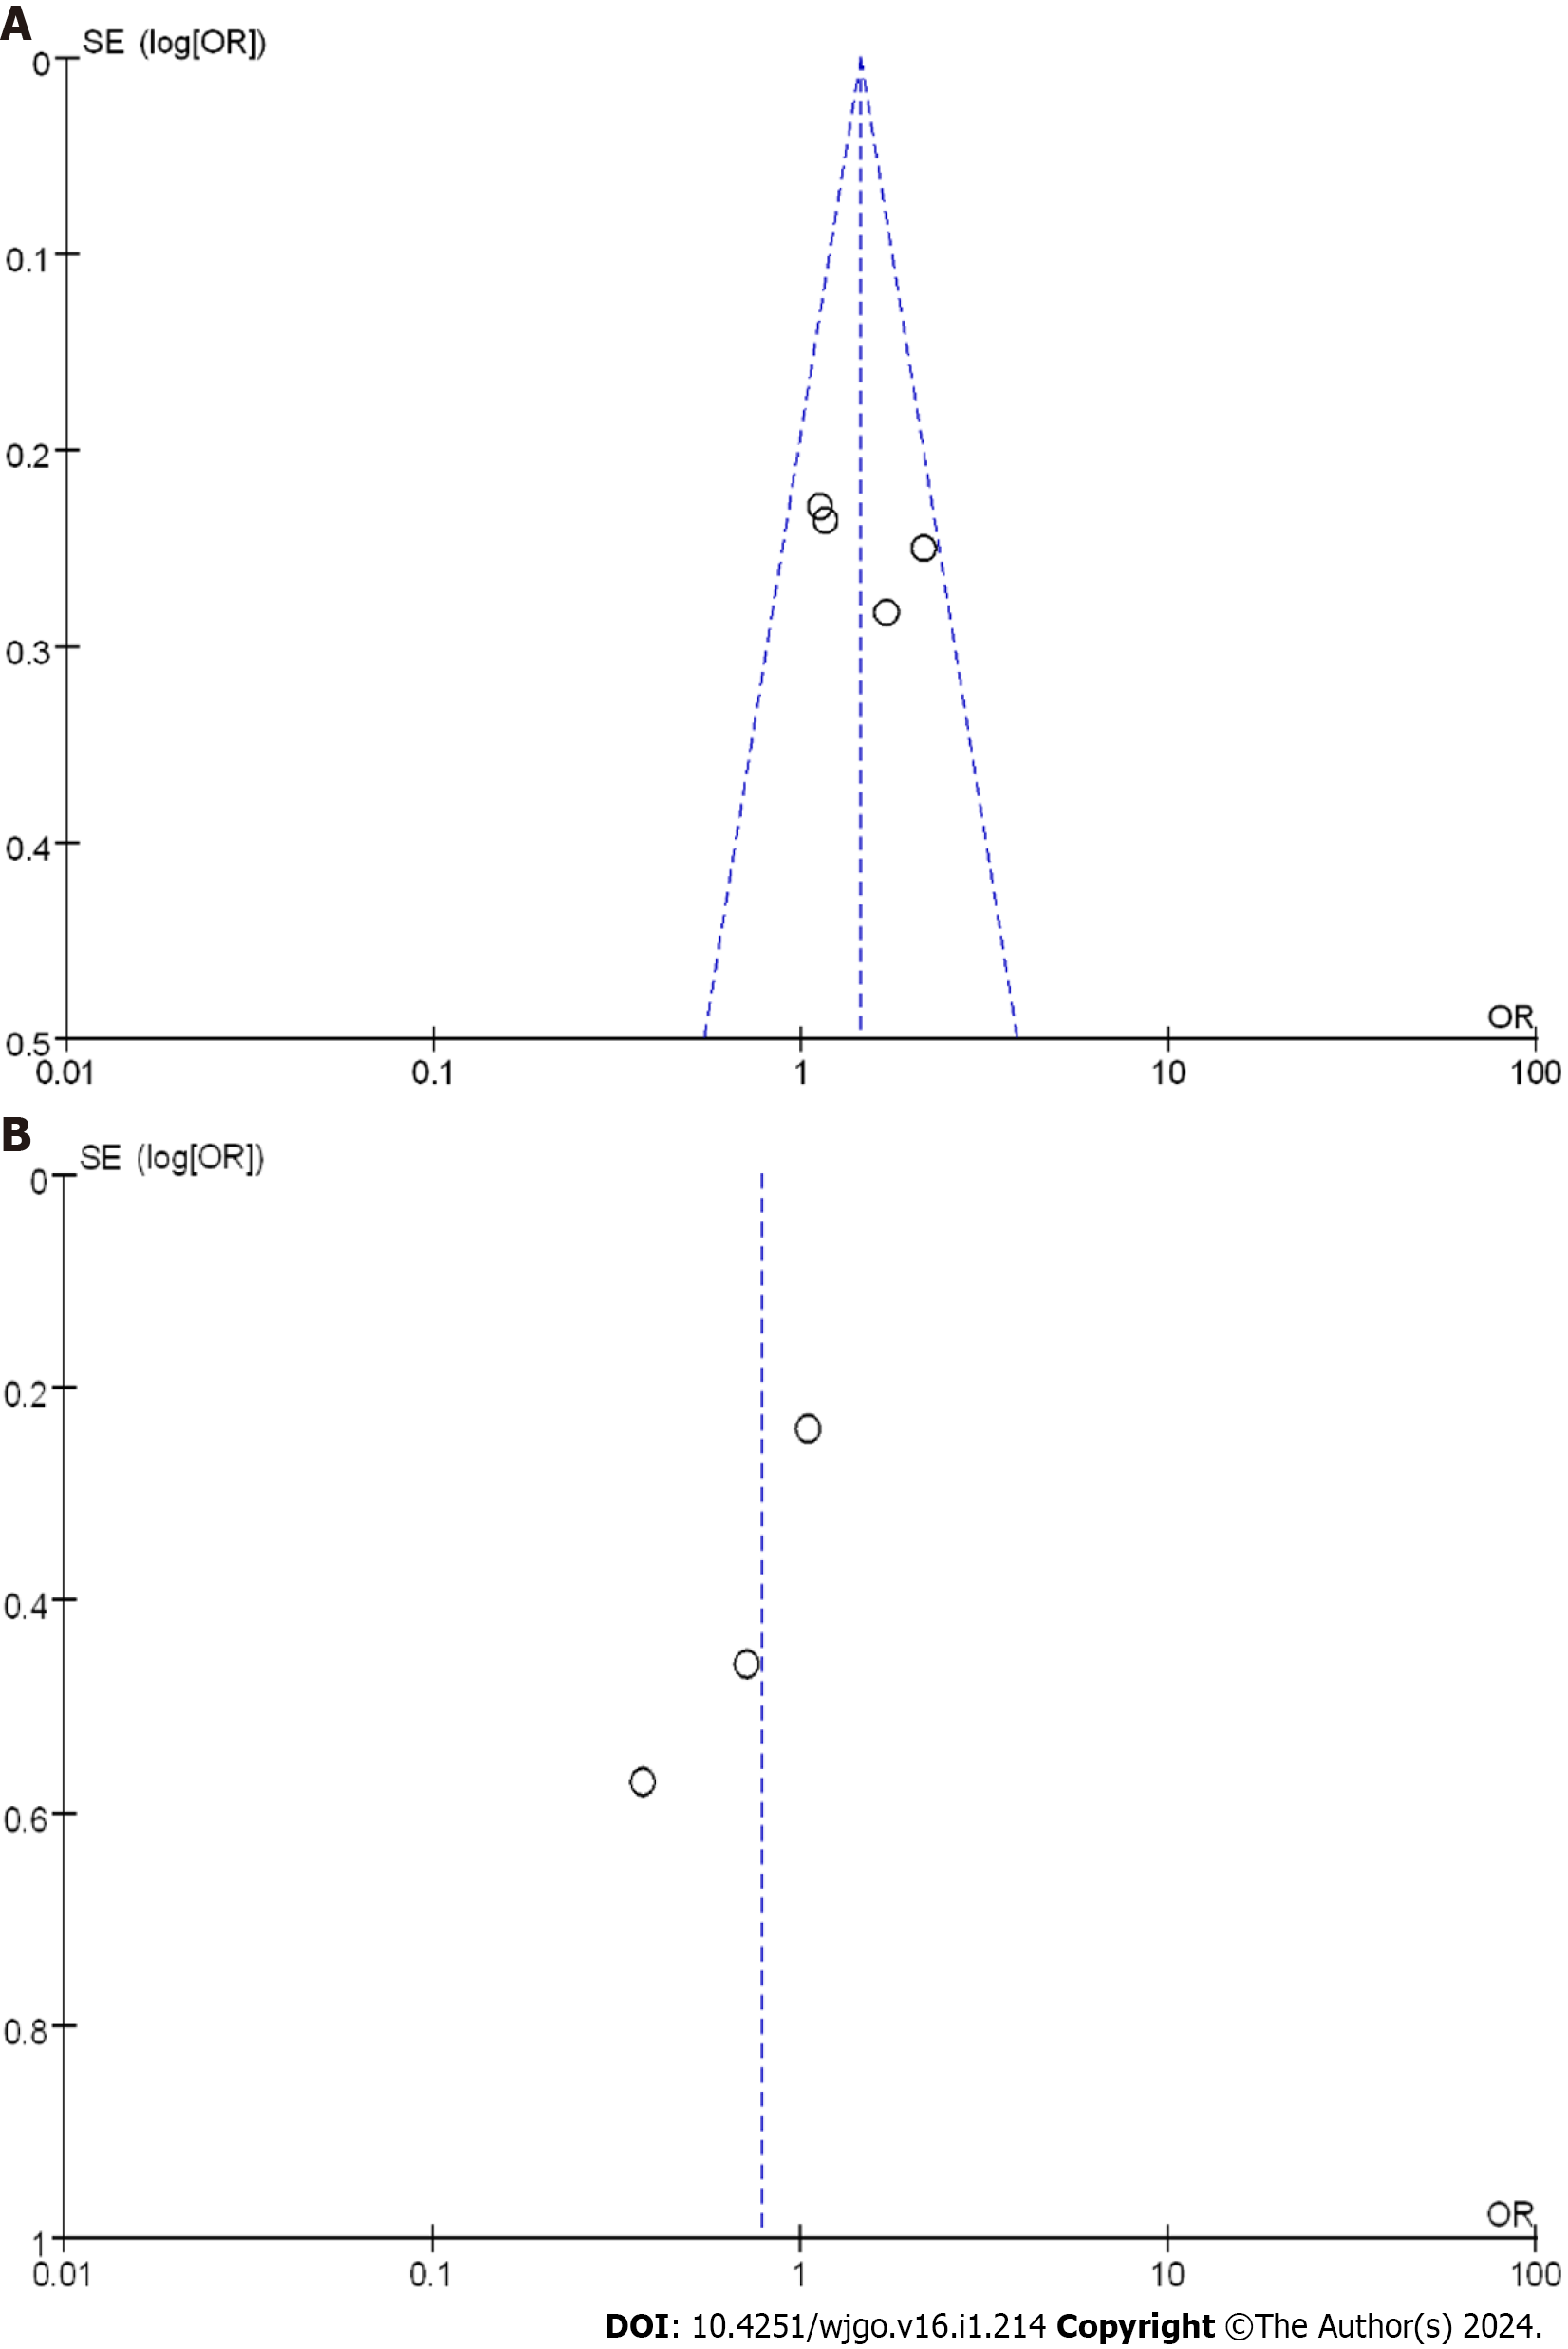
Figure 5 Funnel plot of 3-year disease-free survival.
A: Randomized controlled trials; B: Case-control studies. OR: Odds ratio.
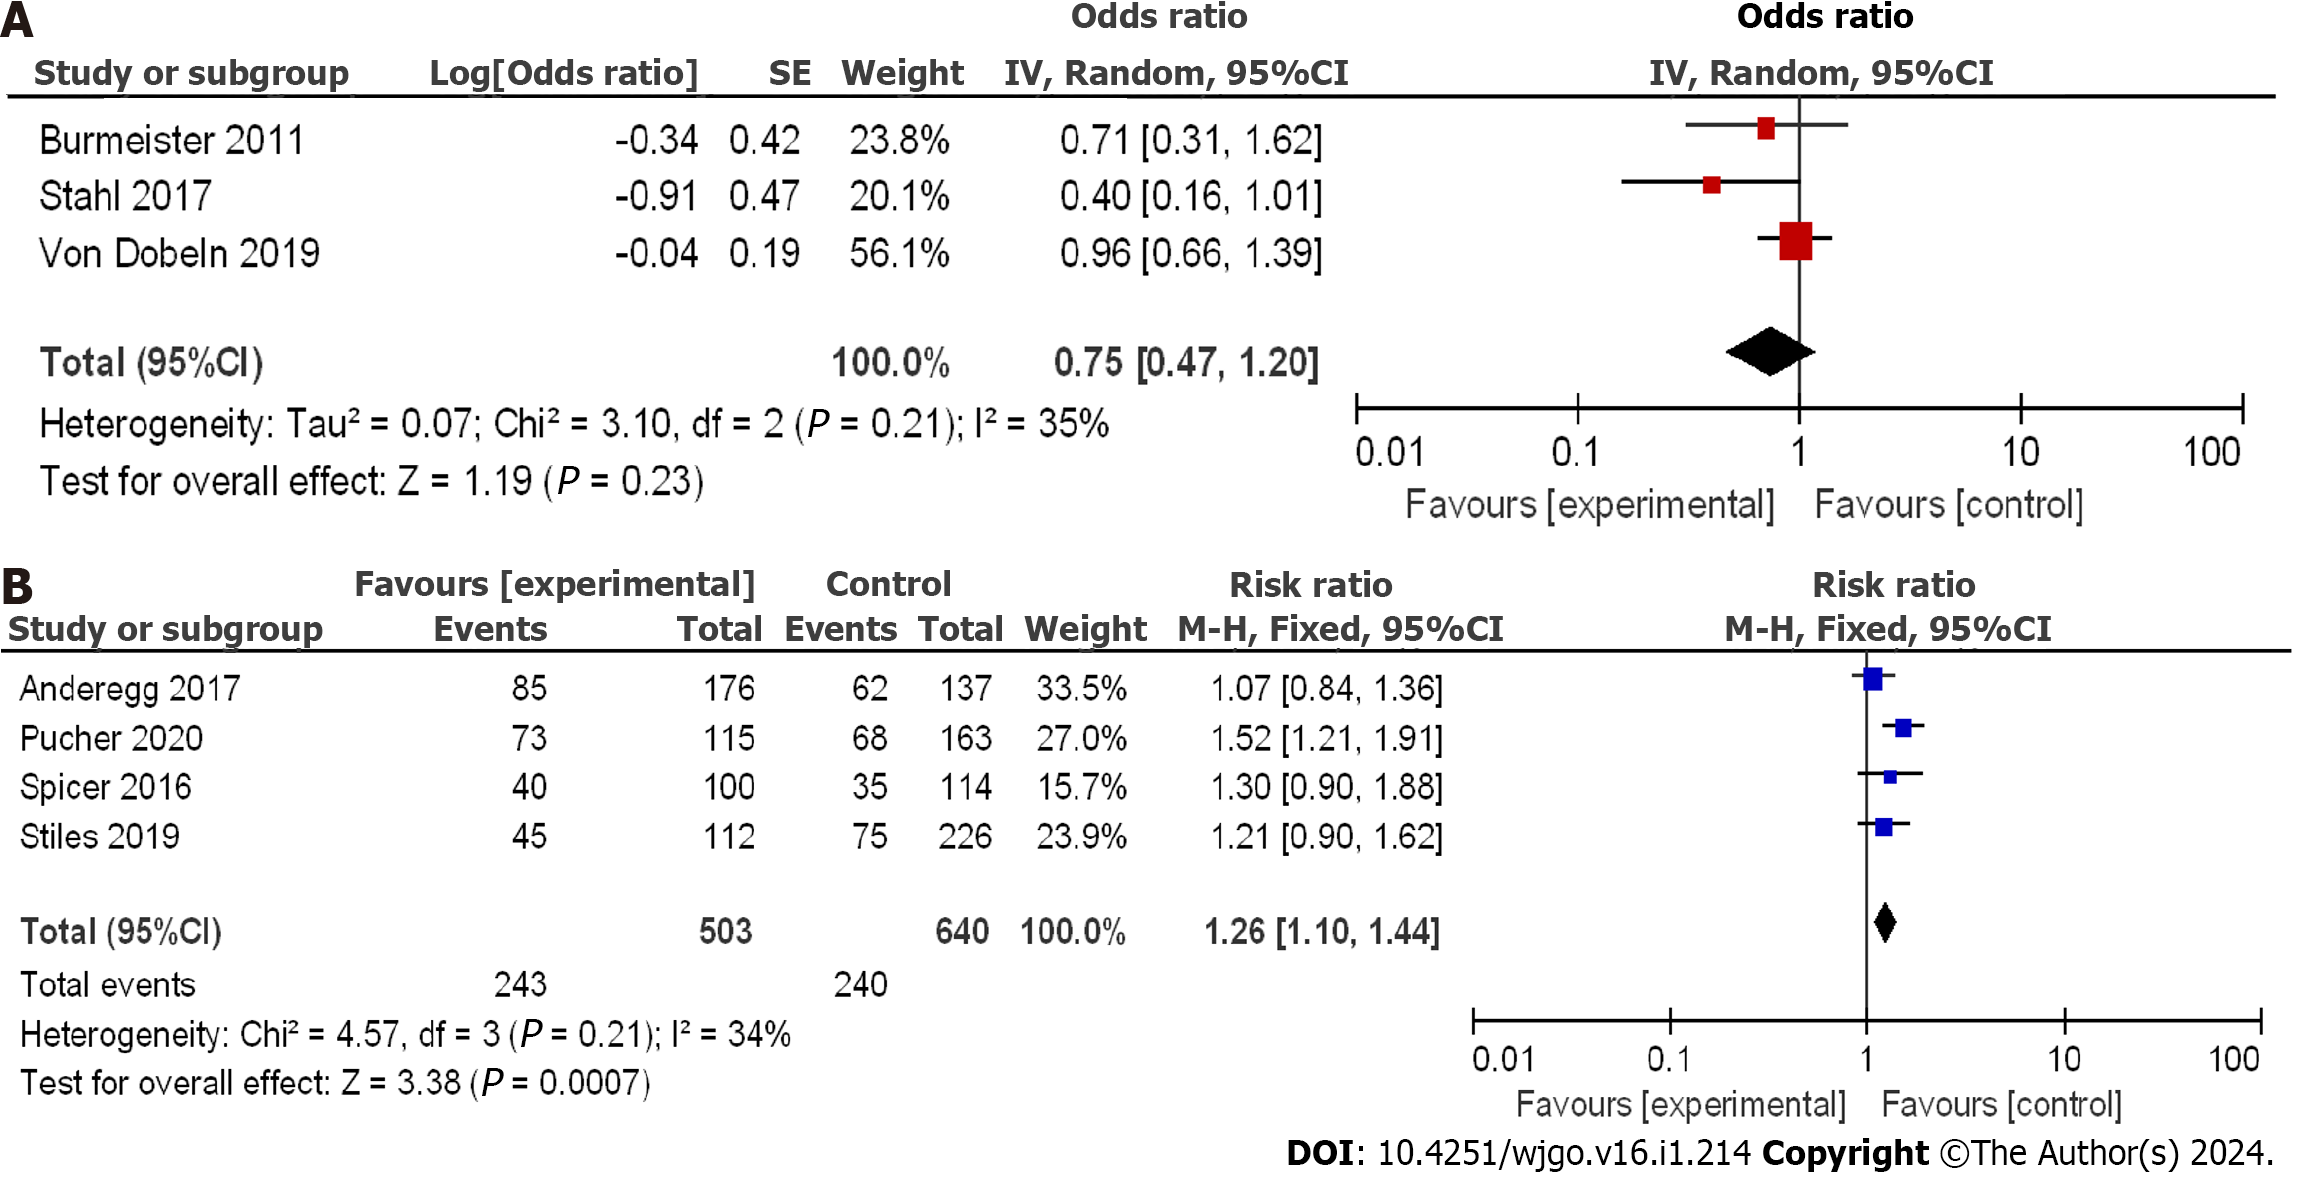
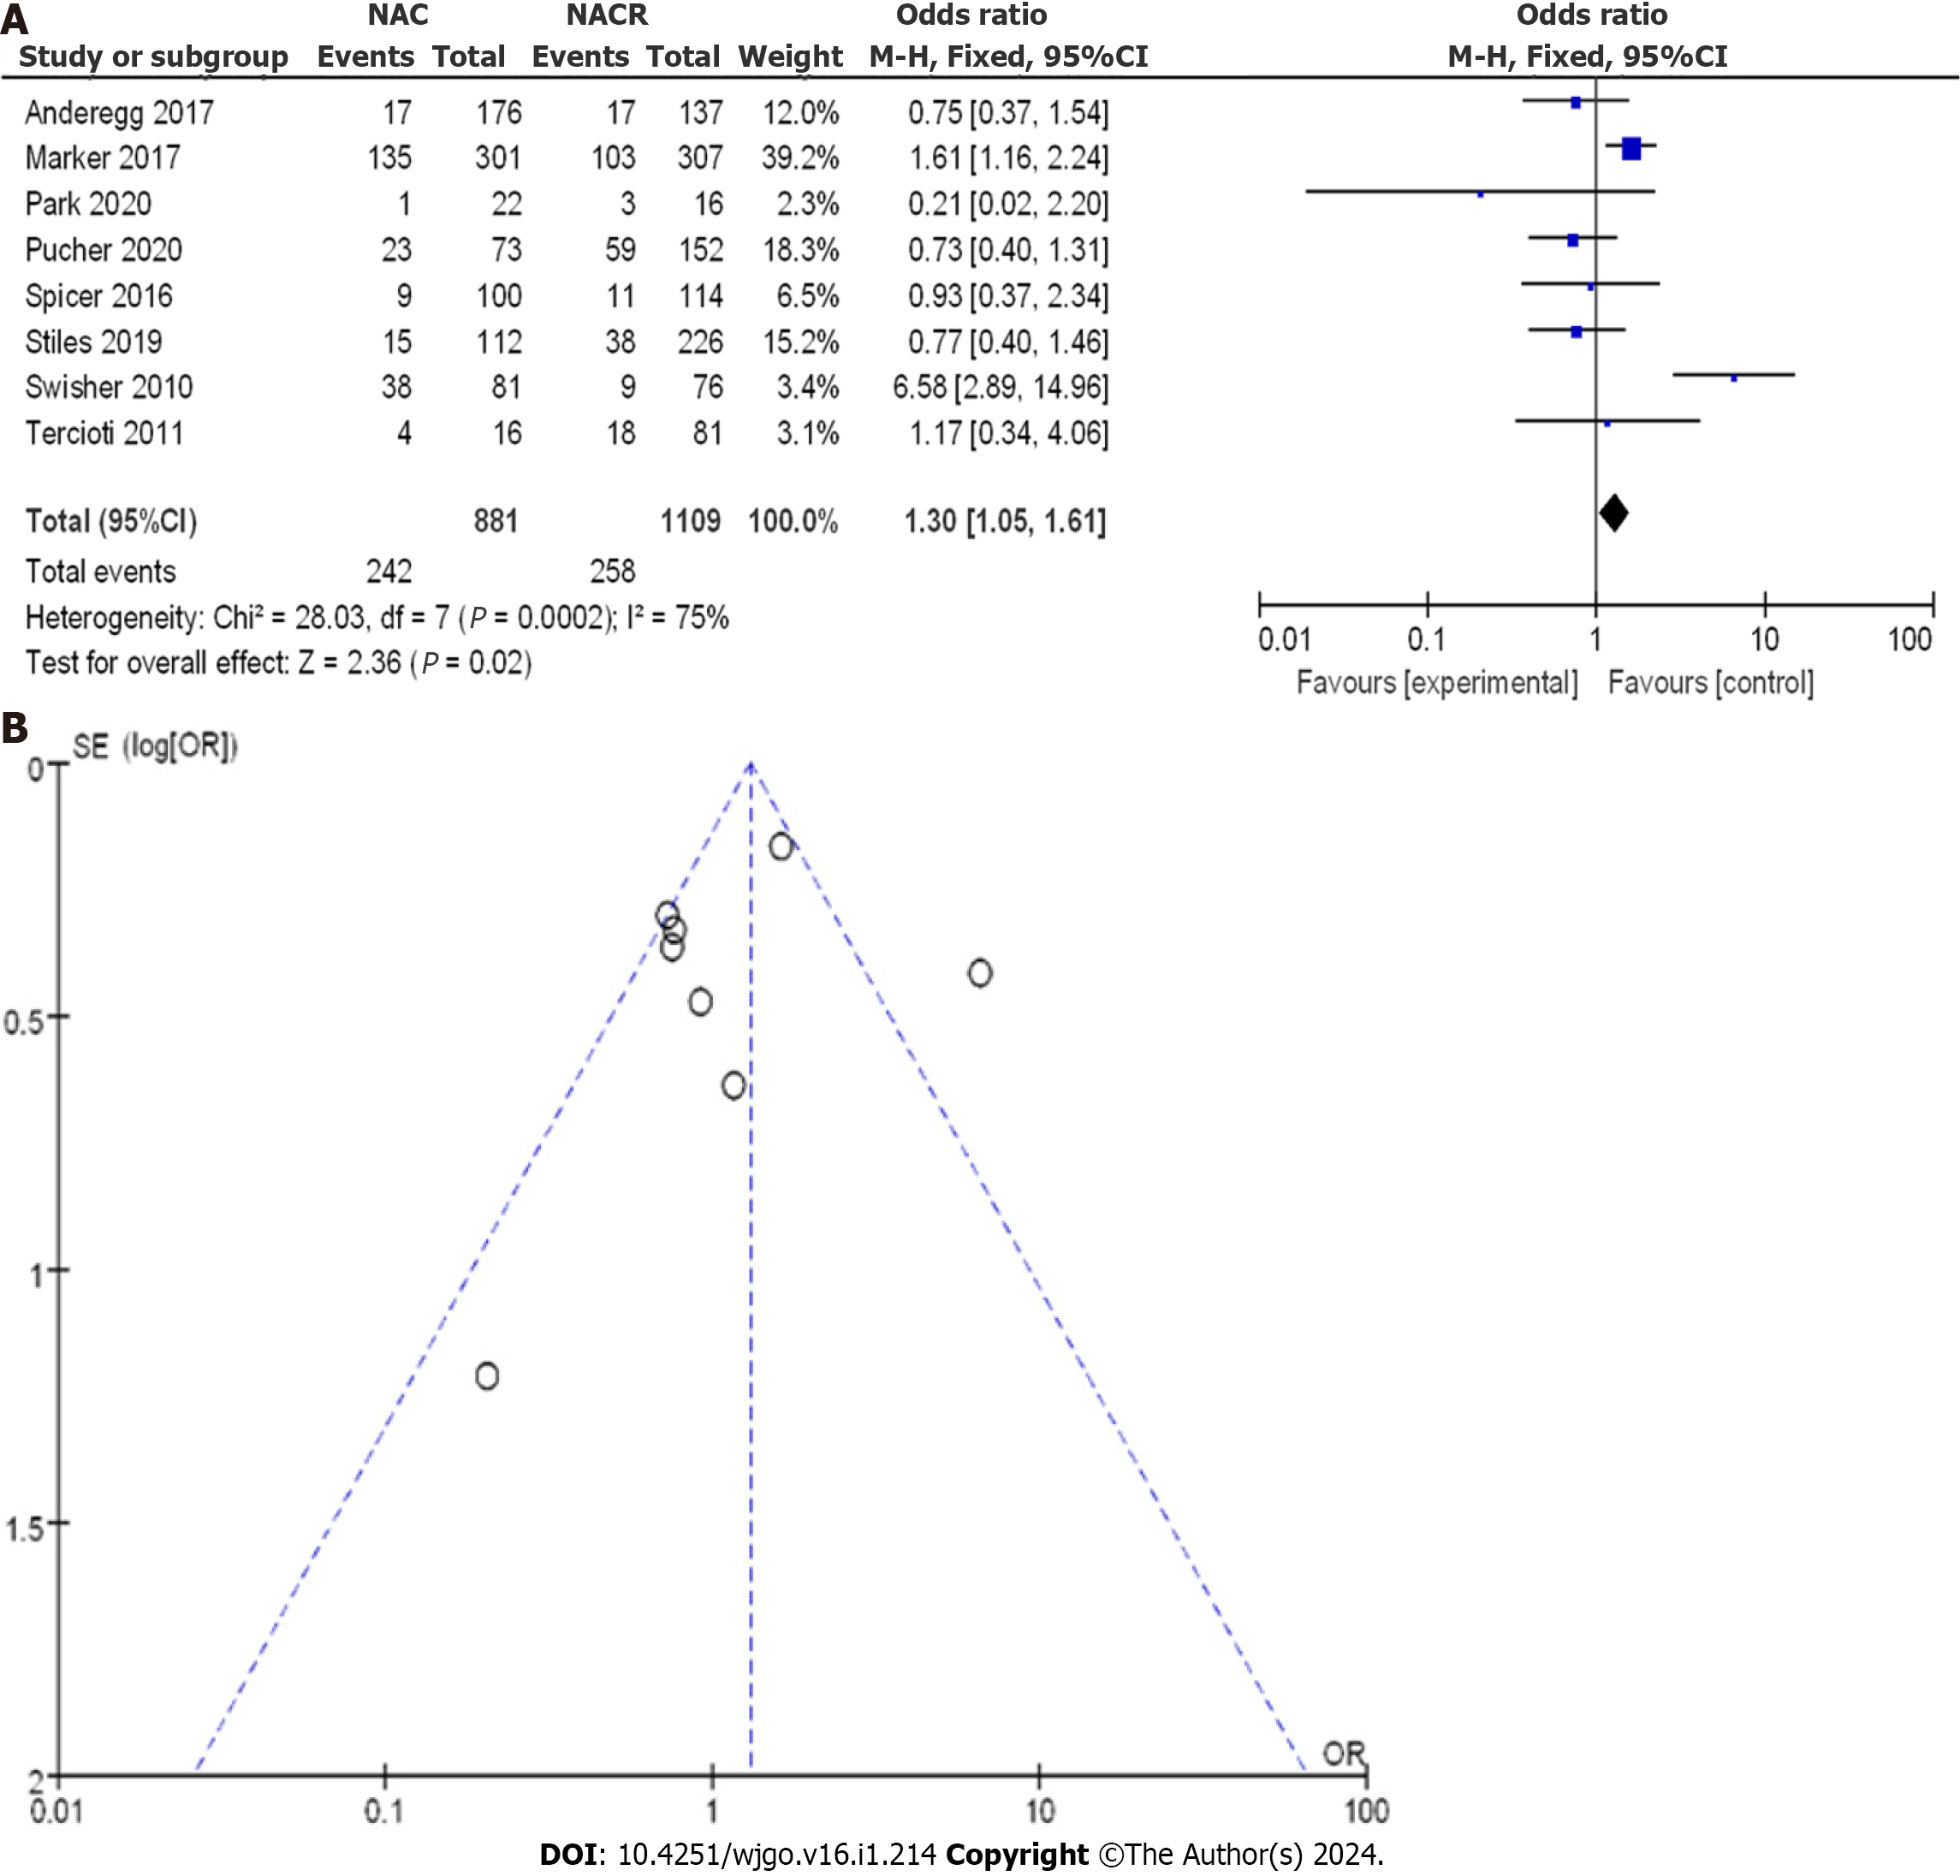
Figure 6 Forest plot of neoadjuvant chemoradiotherapy and neoadjuvant chemotherapy in 5-year disease-free survival.
A: Randomized controlled trials; B: Case-control studies. 95%CI: 95% confidence interval.
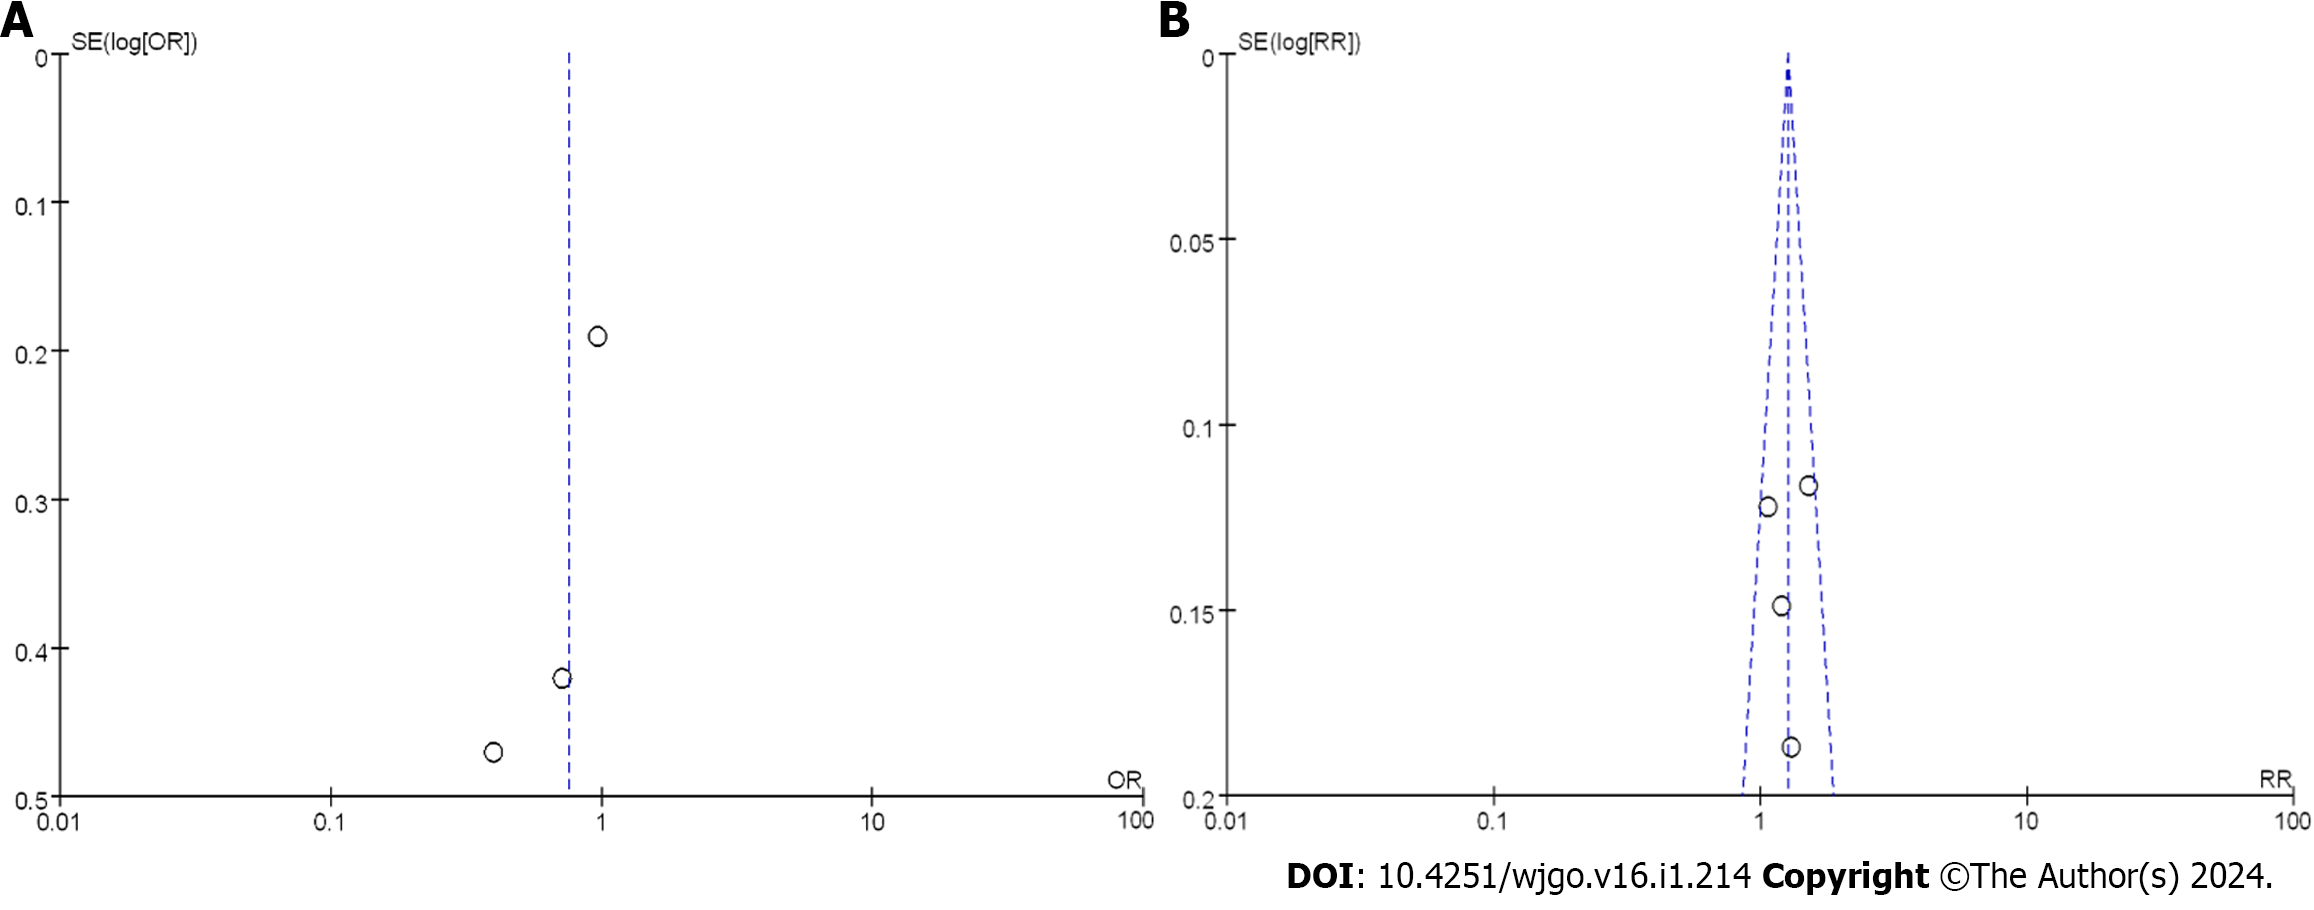
Figure 7 Funnel plot of 5-year disease-free survival.
A: Randomized controlled trials; B: Case-control studies. OR: Odds ratio; RR: Relative risk.
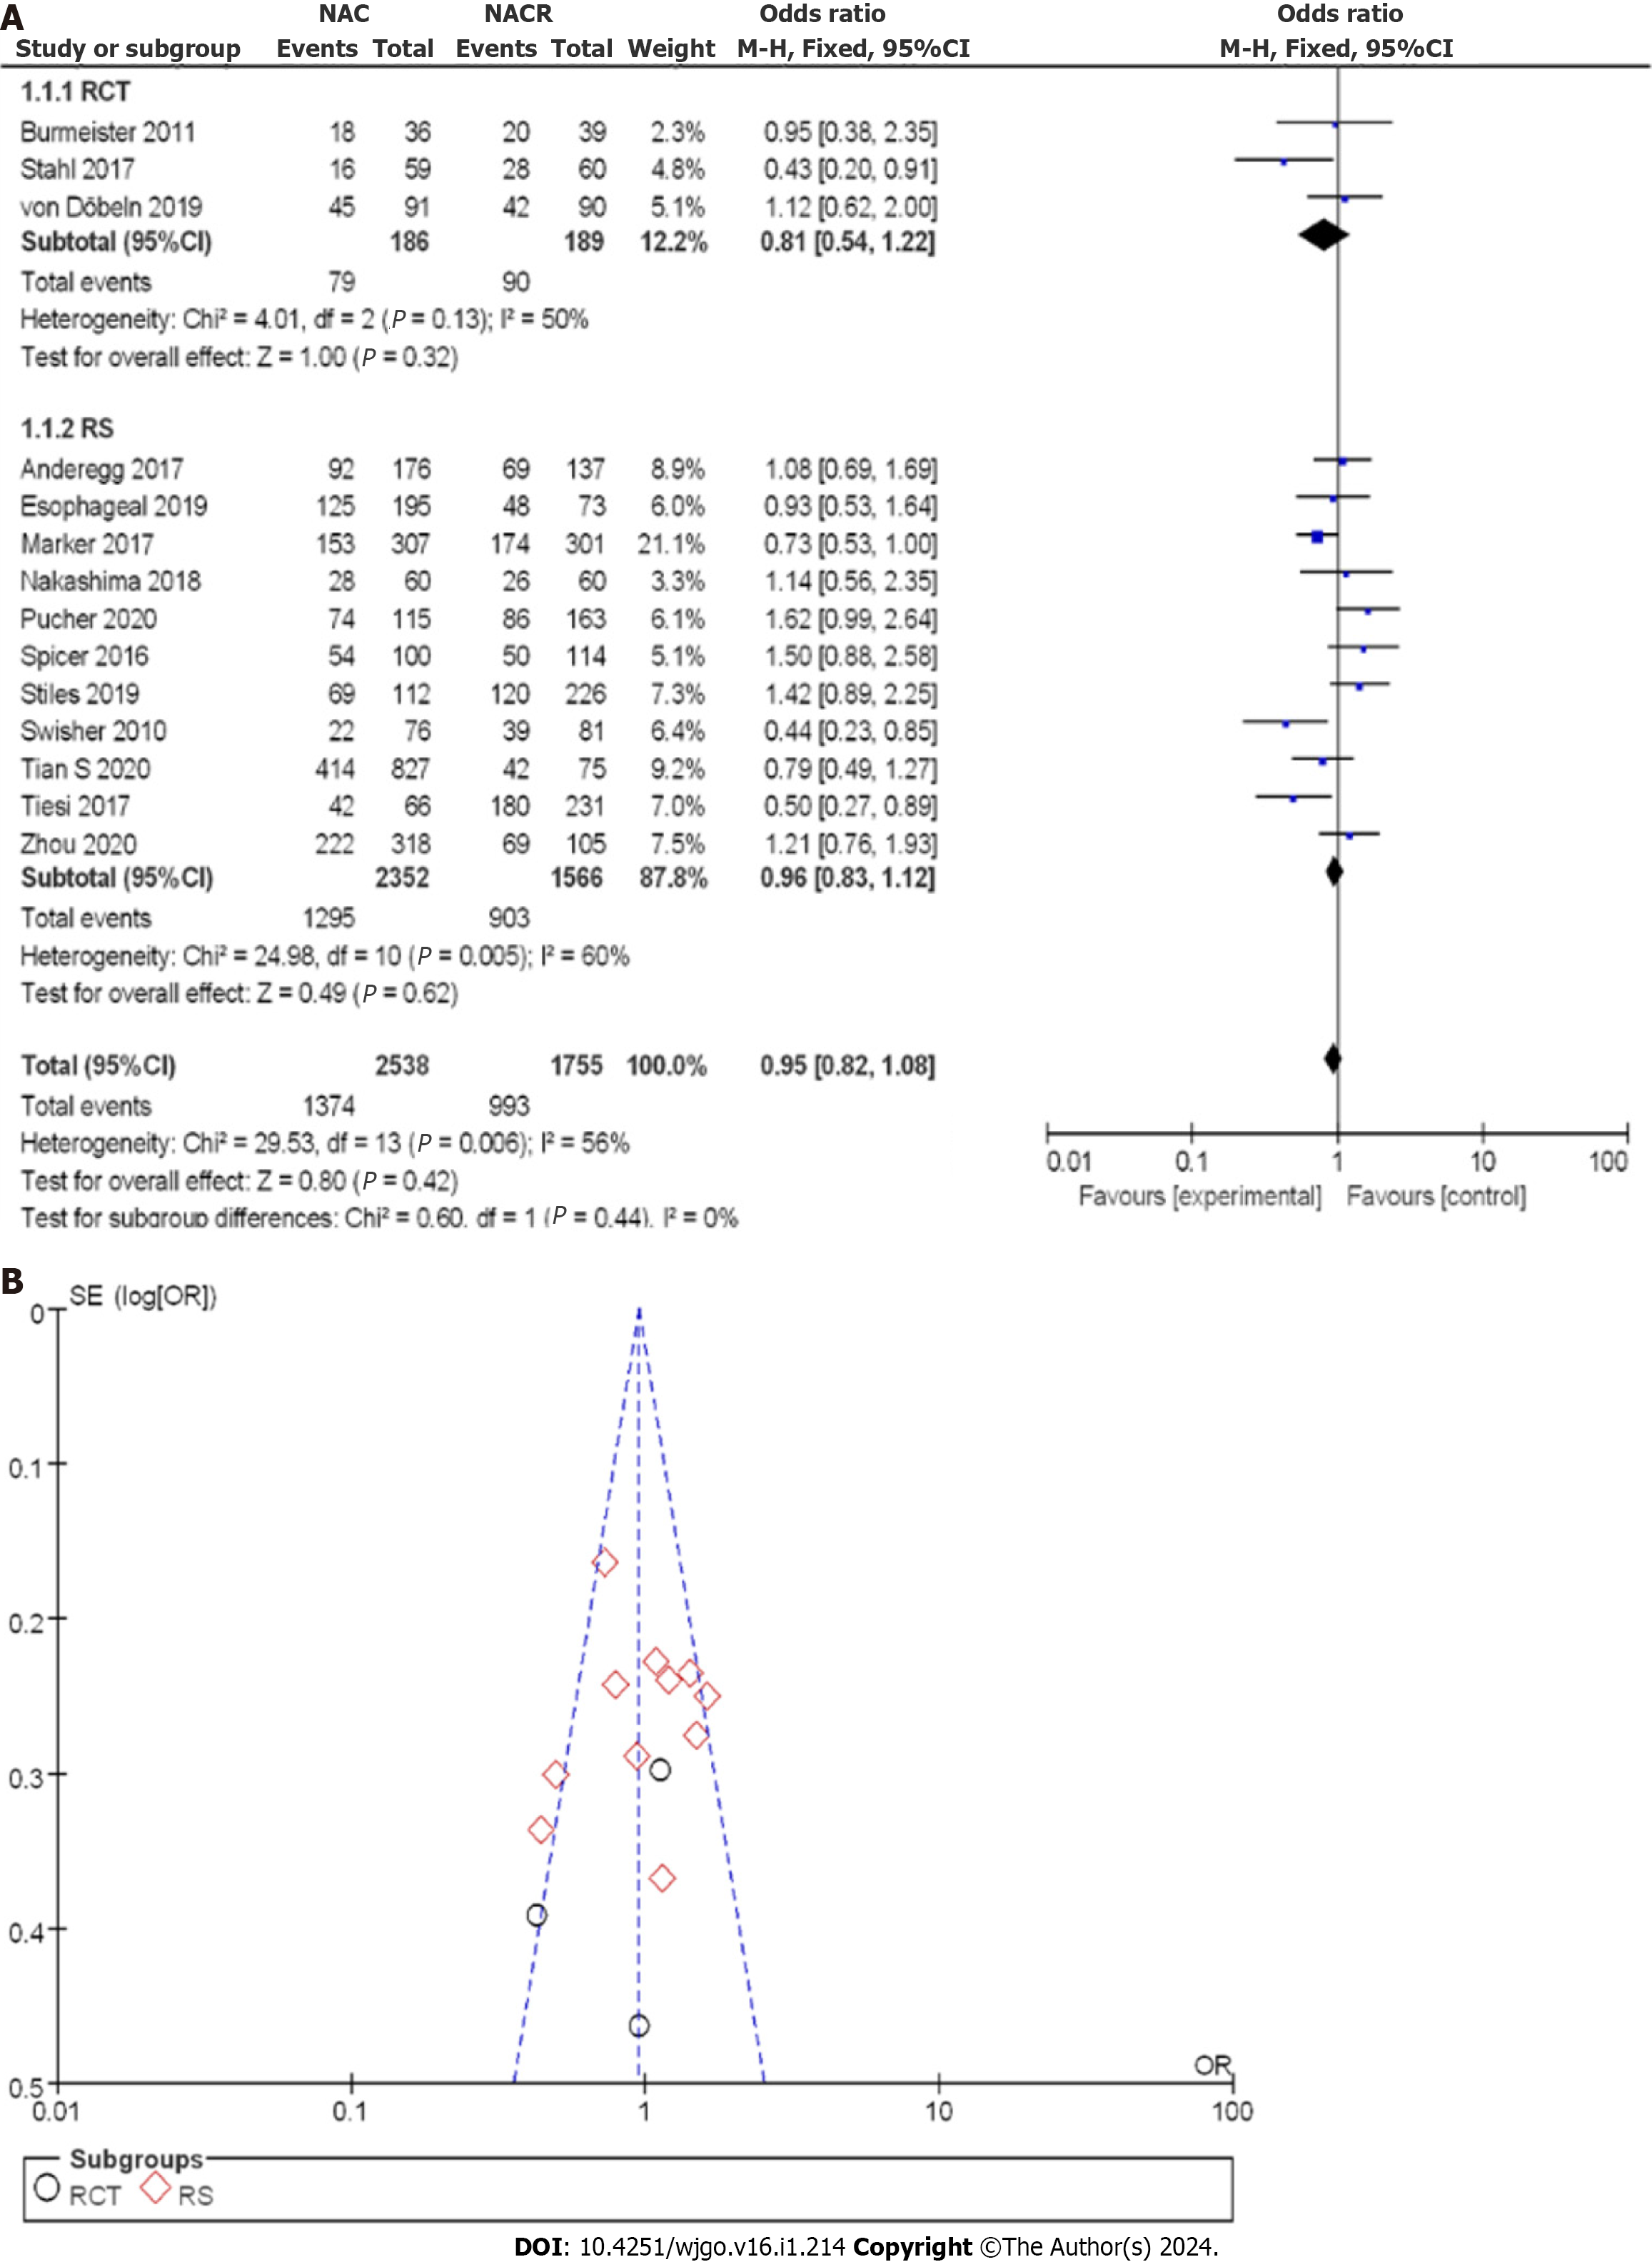
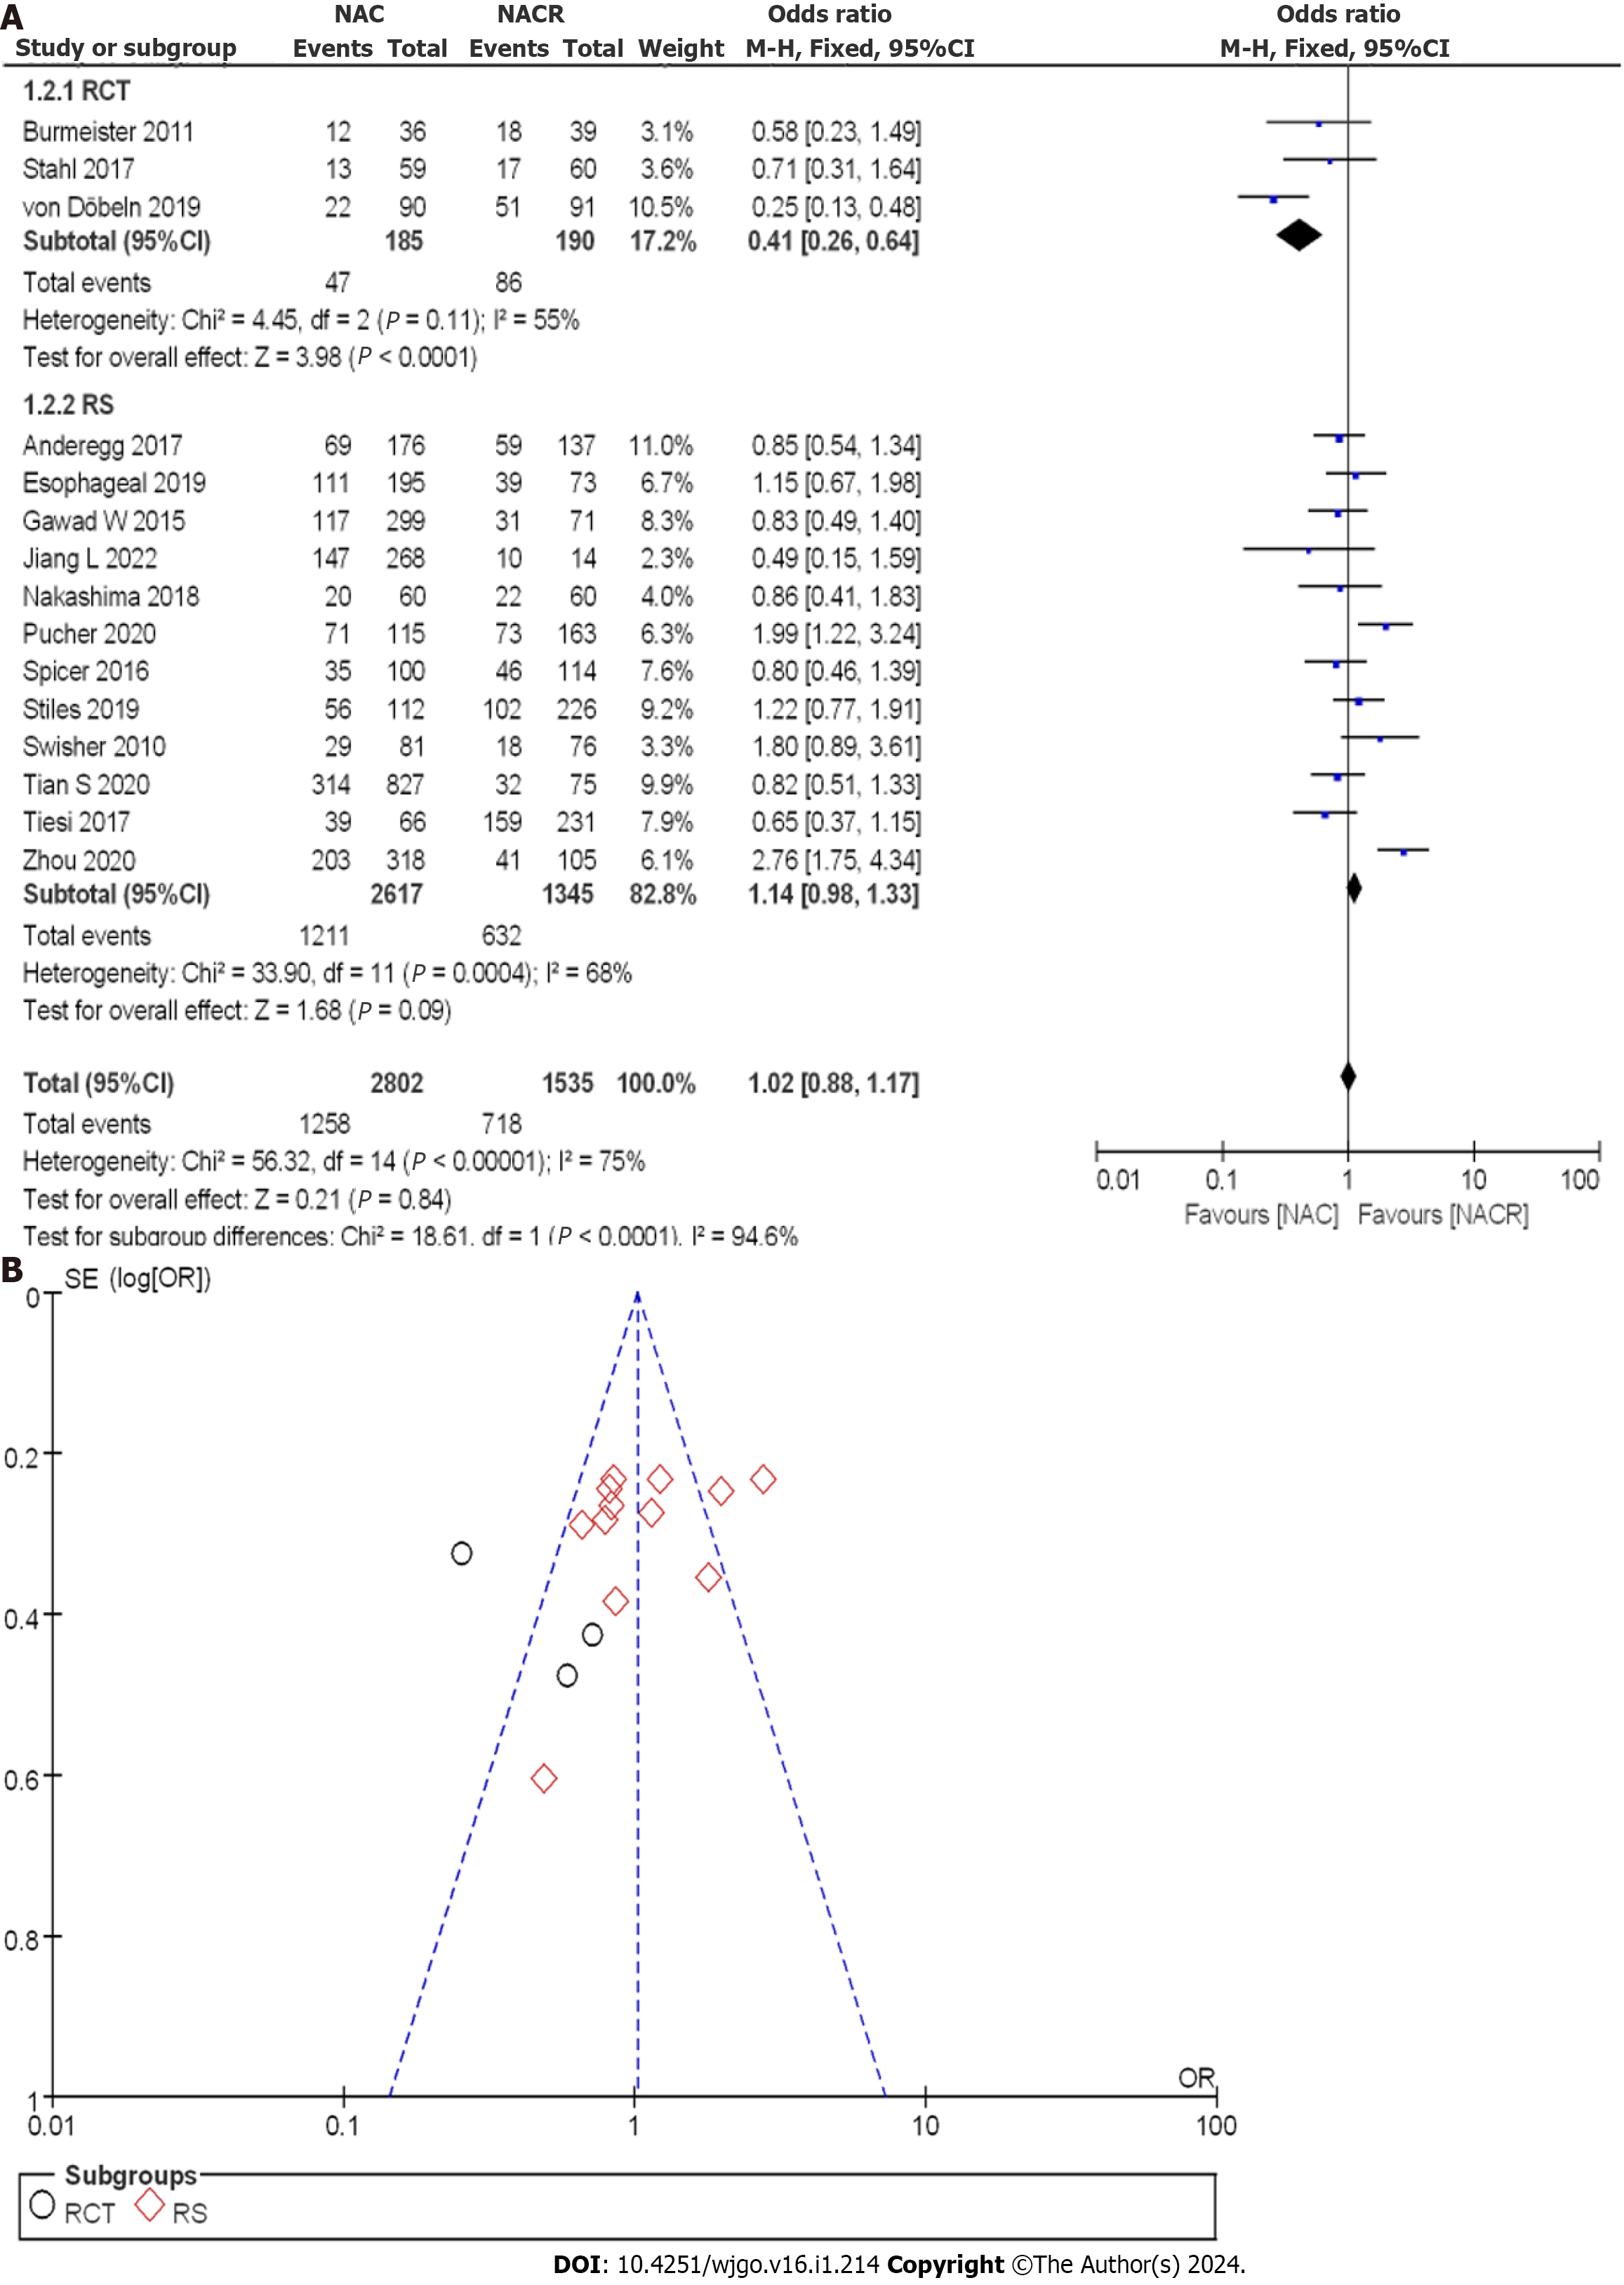
Figure 8 Three-year overall survival rate between neoadjuvant chemotherapy and neoadjuvant chemoradiotherapy.
A: Forest plot; B: Funnel plot. 95%CI: 95% confidence interval; OR: Odds ratio; RCT: Randomized controlled trial; RS: Retrospective study.
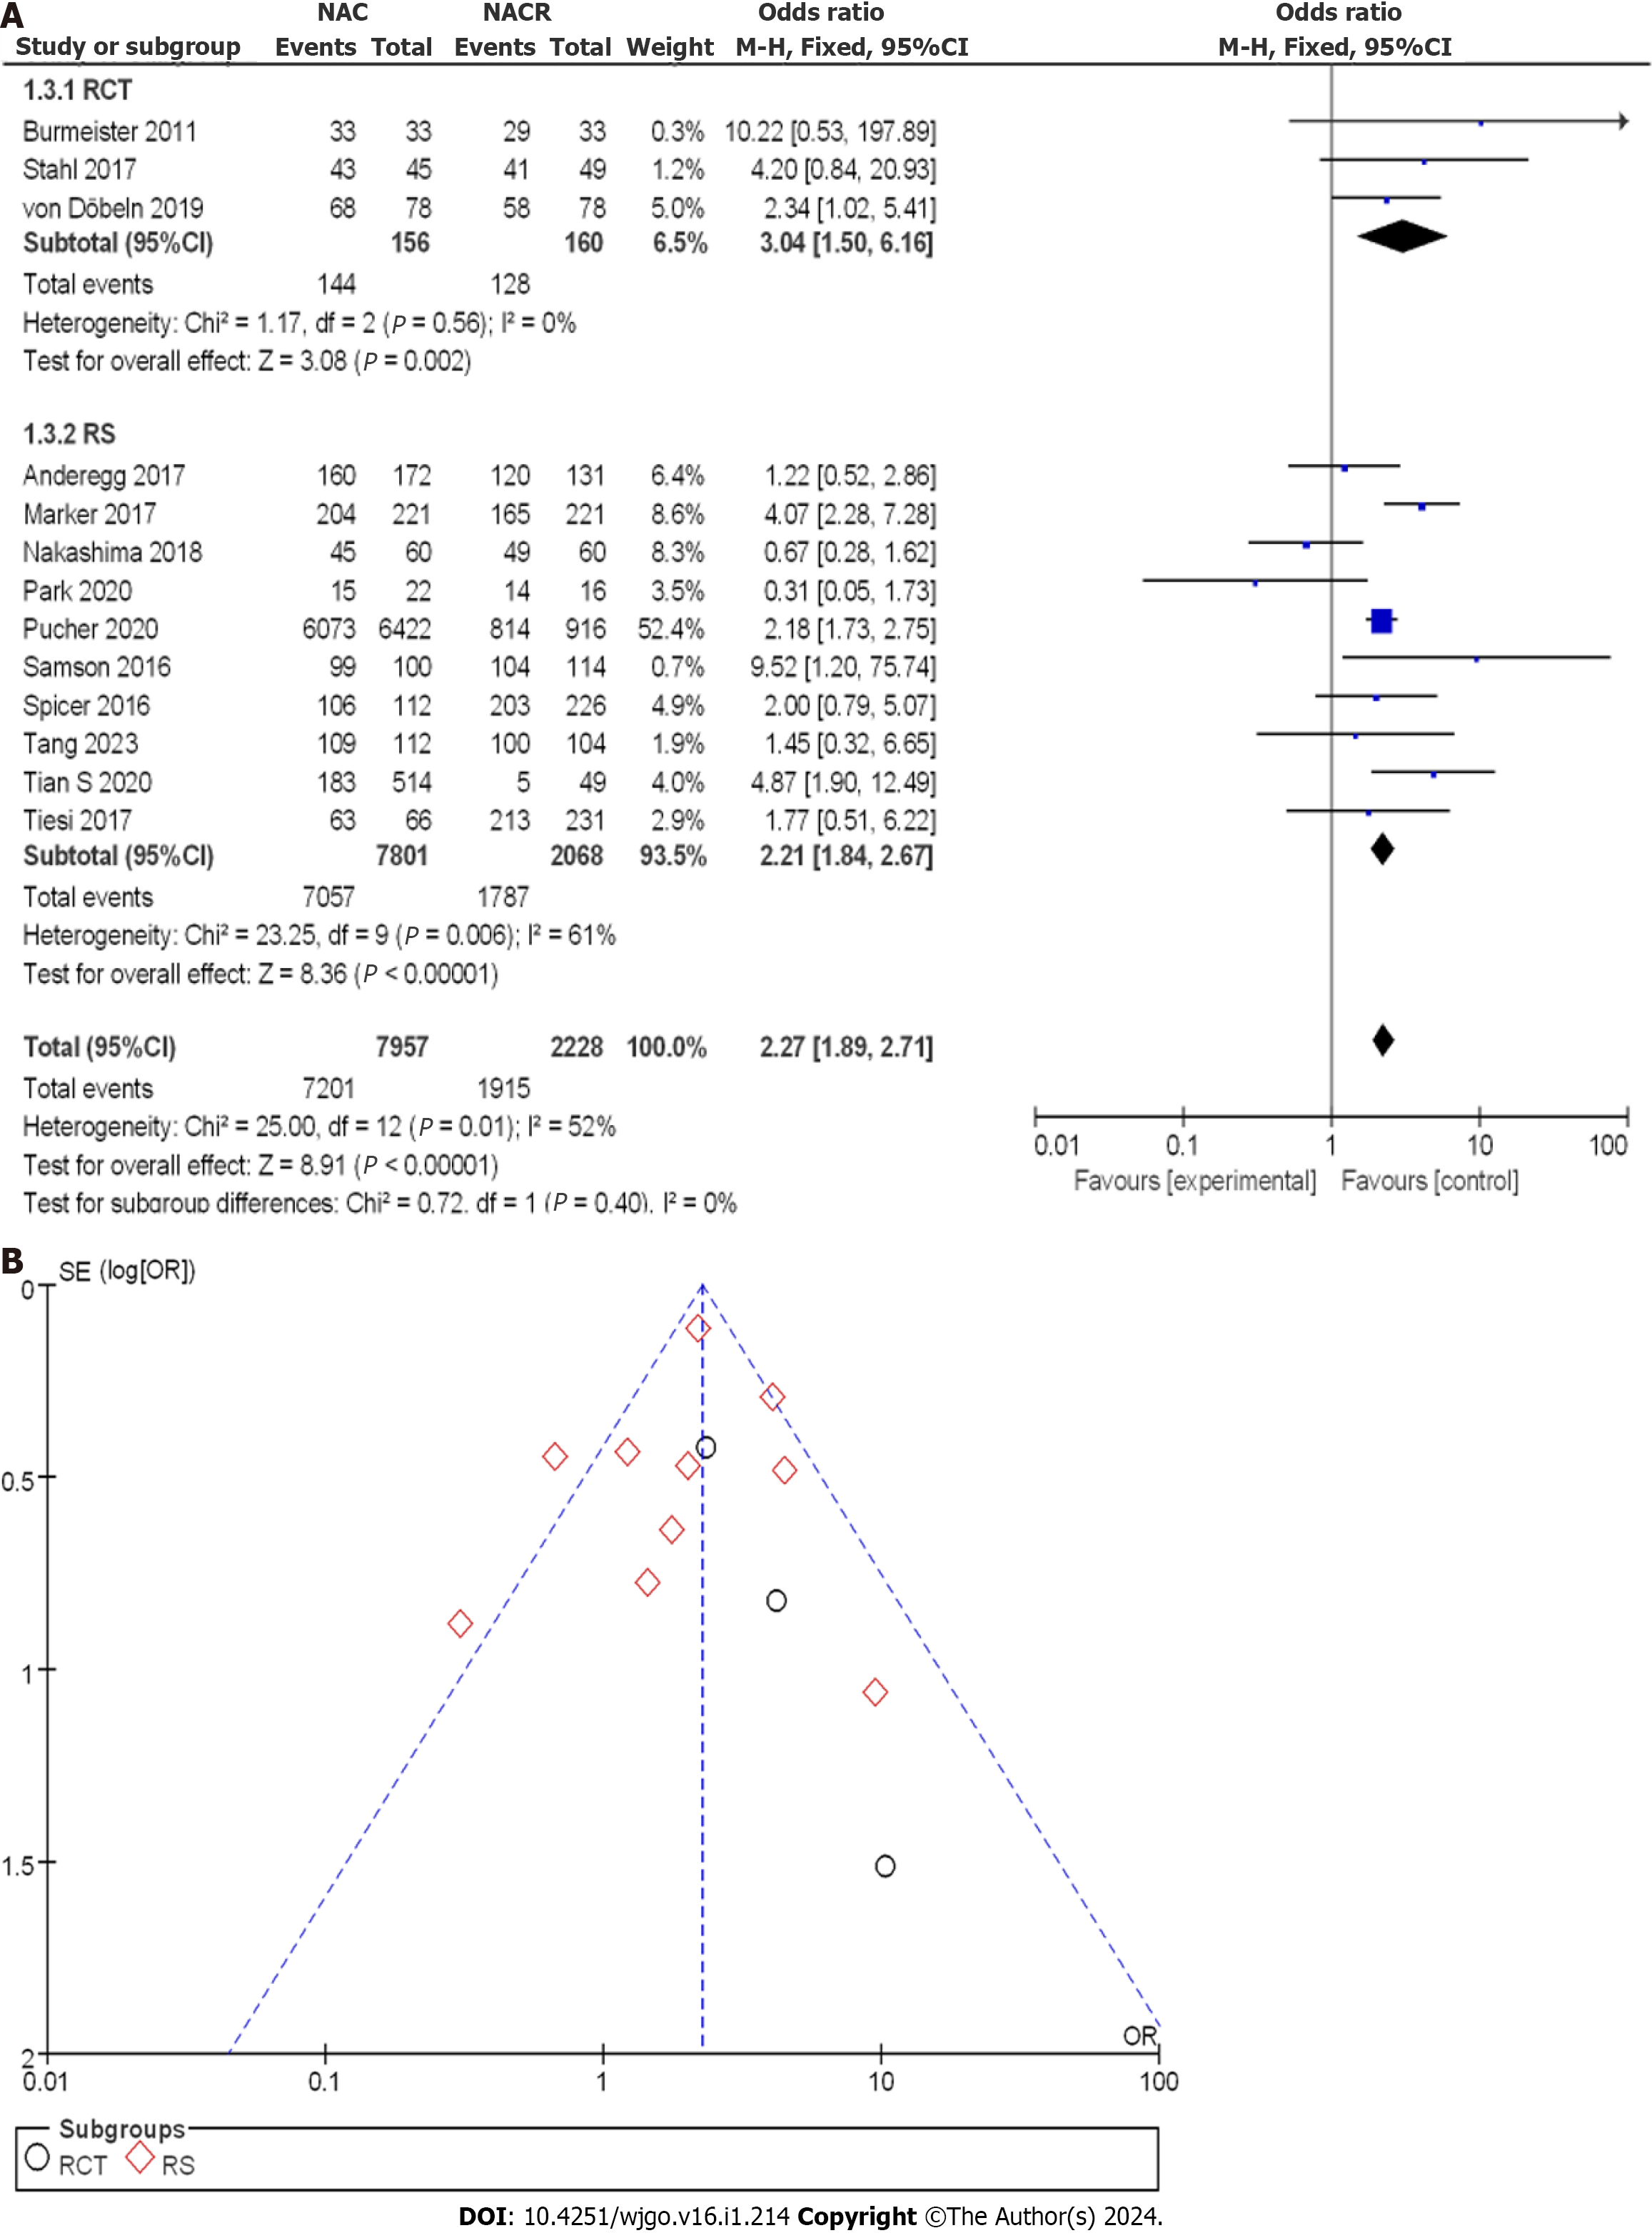
Figure 9 Five-year overall survival rate between neoadjuvant chemotherapy and neoadjuvant chemoradiotherapy.
A: Forest plot; B: Funnel plot. 95%CI: 95% confidence interval; OR: Odds ratio; RCT: Randomized controlled trial; RS: Retrospective study.
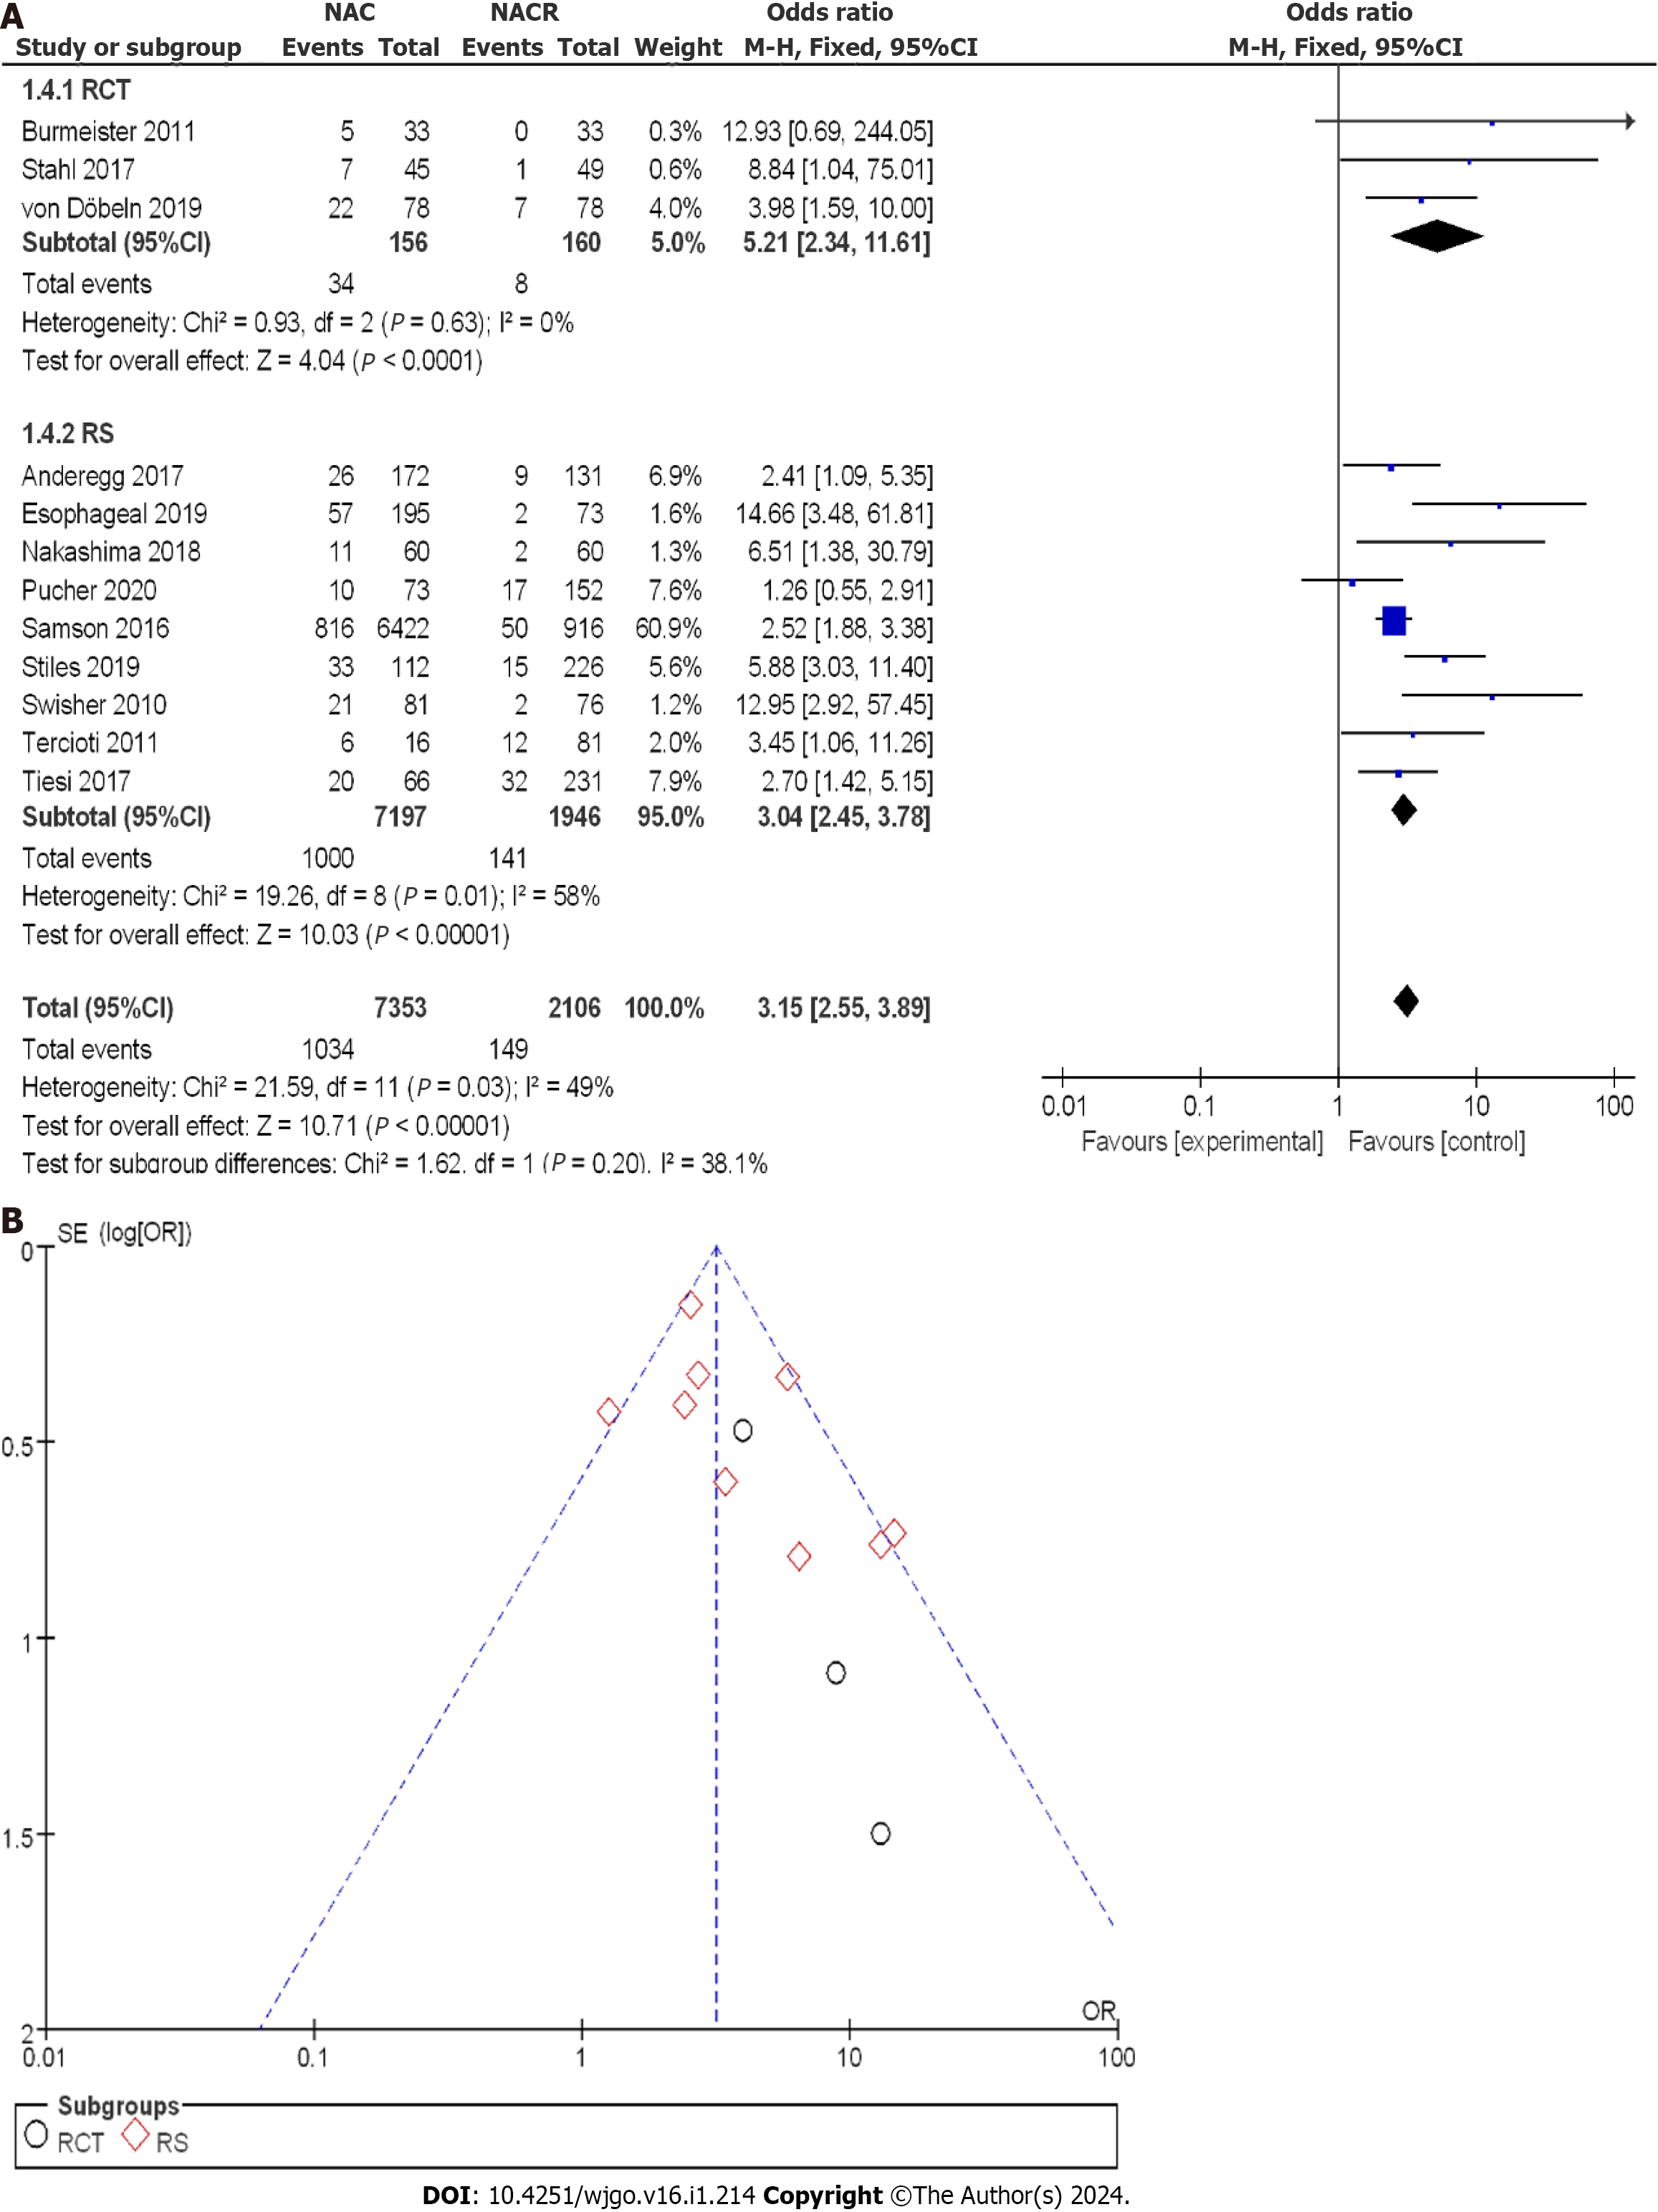
Figure 10 R0 clearance rate between neoadjuvant chemotherapy and neoadjuvant chemoradiotherapy.
A: Forest plot; B: Funnel plot. 95%CI: 95% confidence interval; OR: Odds ratio; RCT: Randomized controlled trial; RS: Retrospective study.
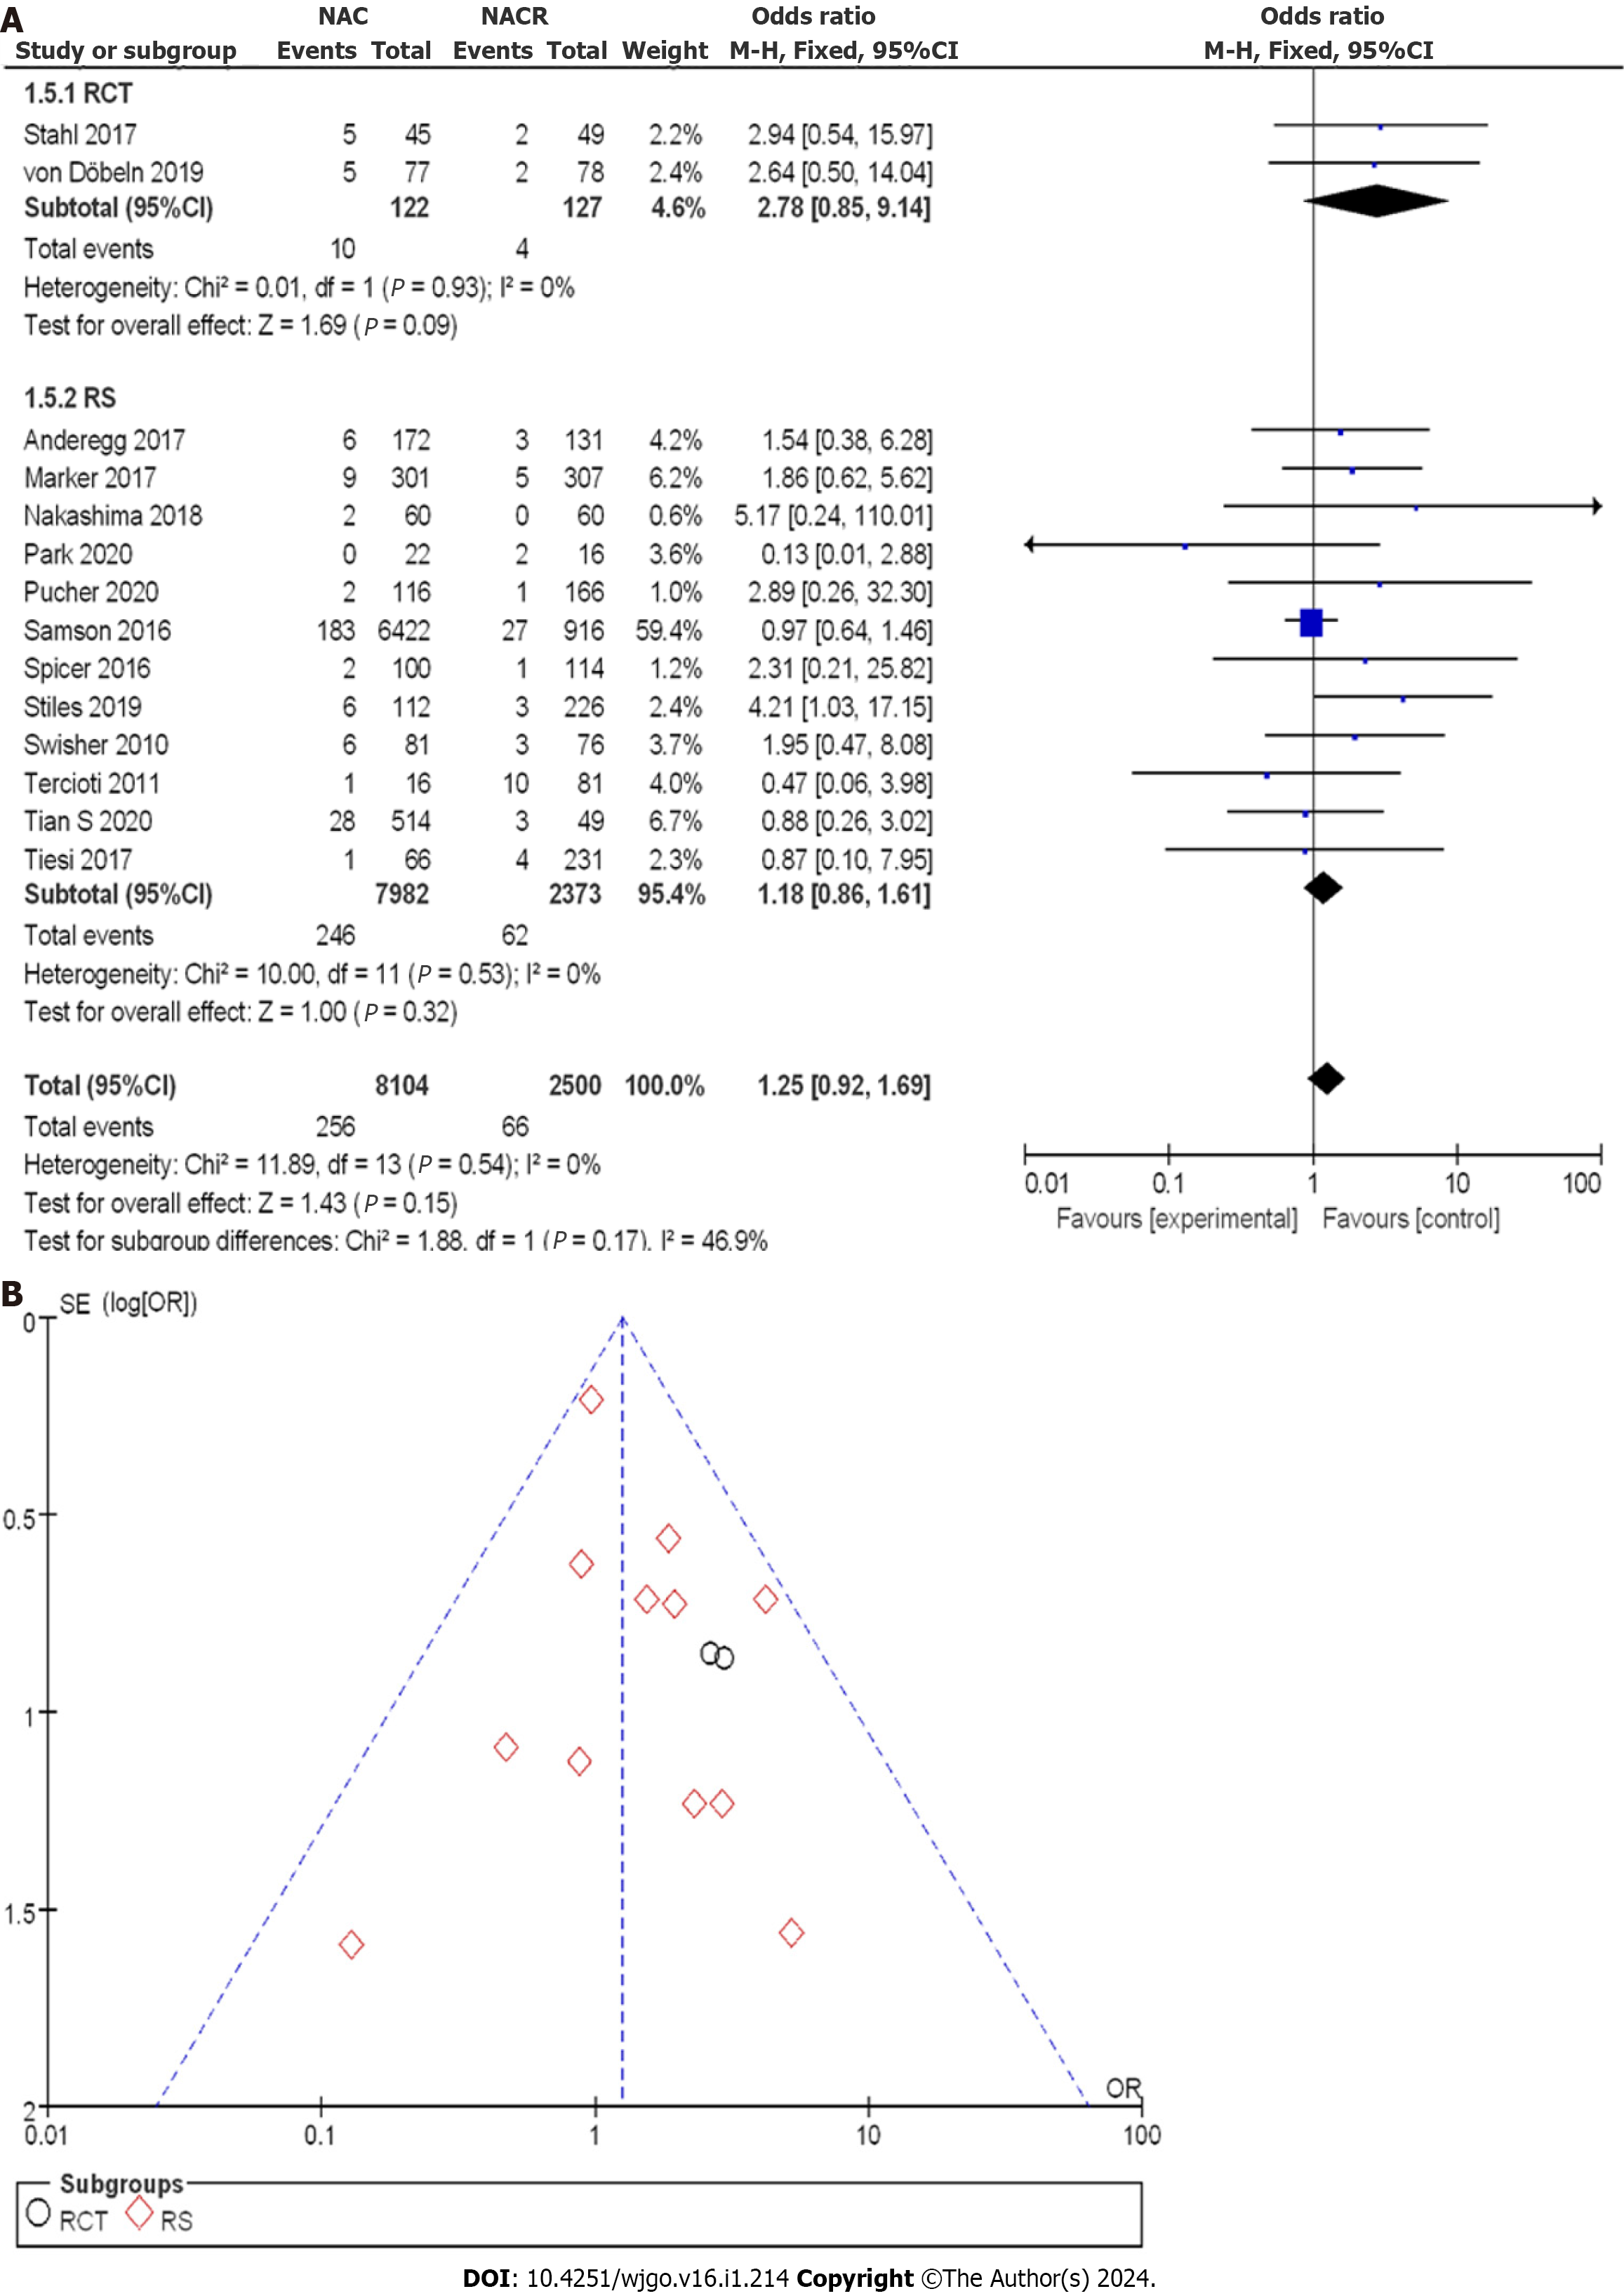
Figure 11 Postoperative complete response rate between neoadjuvant chemotherapy and neoadjuvant chemoradiotherapy.
A: Forest plot; B: Funnel plot. 95%CI: 95% confidence interval; OR: Odds ratio; RCT: Randomized controlled trial; RS: Retrospective study.
Figure 12 Postoperative mortality between neoadjuvant chemotherapy and neoadjuvant chemoradiotherapy.
A: Forest plot; B: Funnel plot. A: Forest plot; B: Funnel plot. 95%CI: 95% confidence interval; OR: Odds ratio; RCT: Randomized controlled trial; RS: Retrospective study.
Figure 13 Cardiac complications.
A: Forest plot; B: Funnel plot. A: Forest plot; B: Funnel plot. 95%CI: 95% confidence interval; OR: Odds ratio; RCT: Randomized controlled trial; RS: Retrospective study.
Figure 14 Lung complications.
A: Forest plot; B: Funnel plot. A: Forest plot; B: Funnel plot. 95%CI: 95% confidence interval; OR: Odds ratio; RCT: Randomized controlled trial; RS: Retrospective study.
- Citation: Yuan MX, Cai QG, Zhang ZY, Zhou JZ, Lan CY, Lin JB. Application of neoadjuvant chemoradiotherapy and neoadjuvant chemotherapy in curative surgery for esophageal cancer: A meta-analysis. World J Gastrointest Oncol 2024; 16(1): 214-233
- URL: https://www.wjgnet.com/1948-5204/full/v16/i1/214.htm
- DOI: https://dx.doi.org/10.4251/wjgo.v16.i1.214


