Copyright
©The Author(s) 2024.
World J Gastrointest Oncol. Jan 15, 2024; 16(1): 118-132
Published online Jan 15, 2024. doi: 10.4251/wjgo.v16.i1.118
Published online Jan 15, 2024. doi: 10.4251/wjgo.v16.i1.118
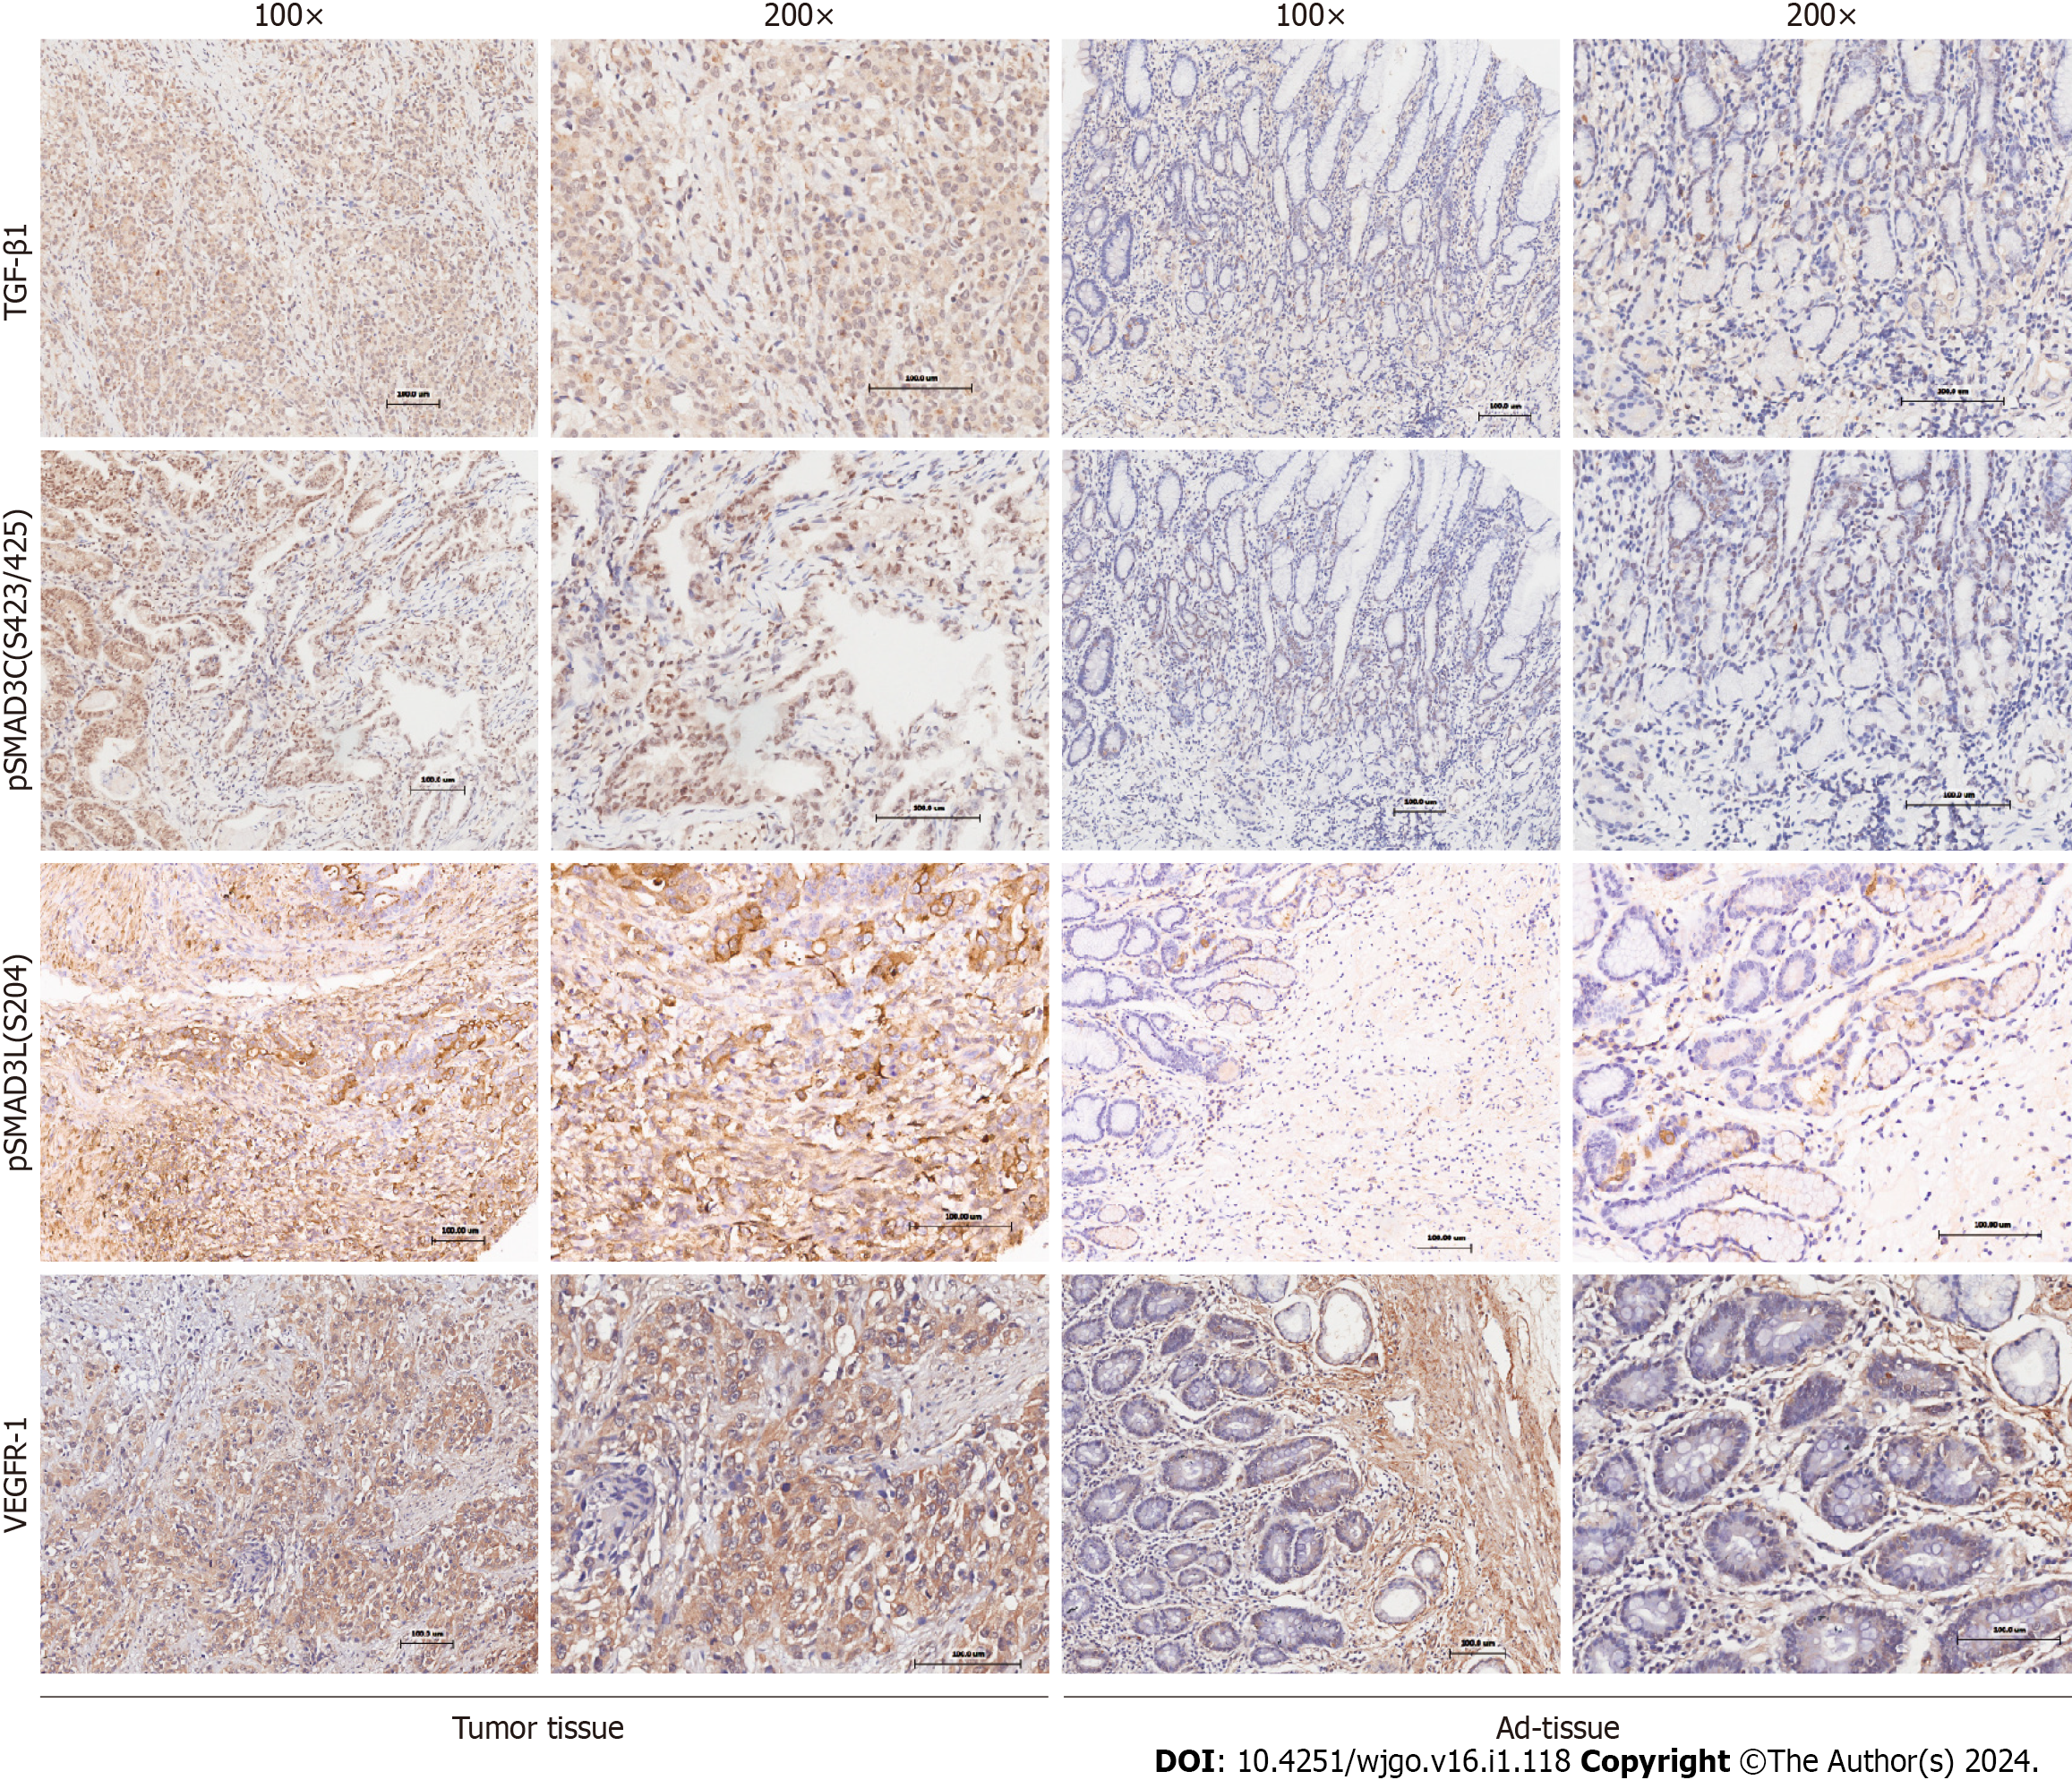
Figure 1 The expression of TGF-β1, pSMAD3C, pSMAD3L, and VEGFR-1 in gastric cancer.
Representative immunohistochemical images showing the expression of TGF-β1, pSMAD3C, pSMAD3L, and VEGFR-1 in cancerous (tumor tissue) and normal (Ad-tissue) gastric tissue. The right panel provides an enlarged view of the specific features highlighted in the rectangular image presented in the left panel. (Scale bar, 100 μm).
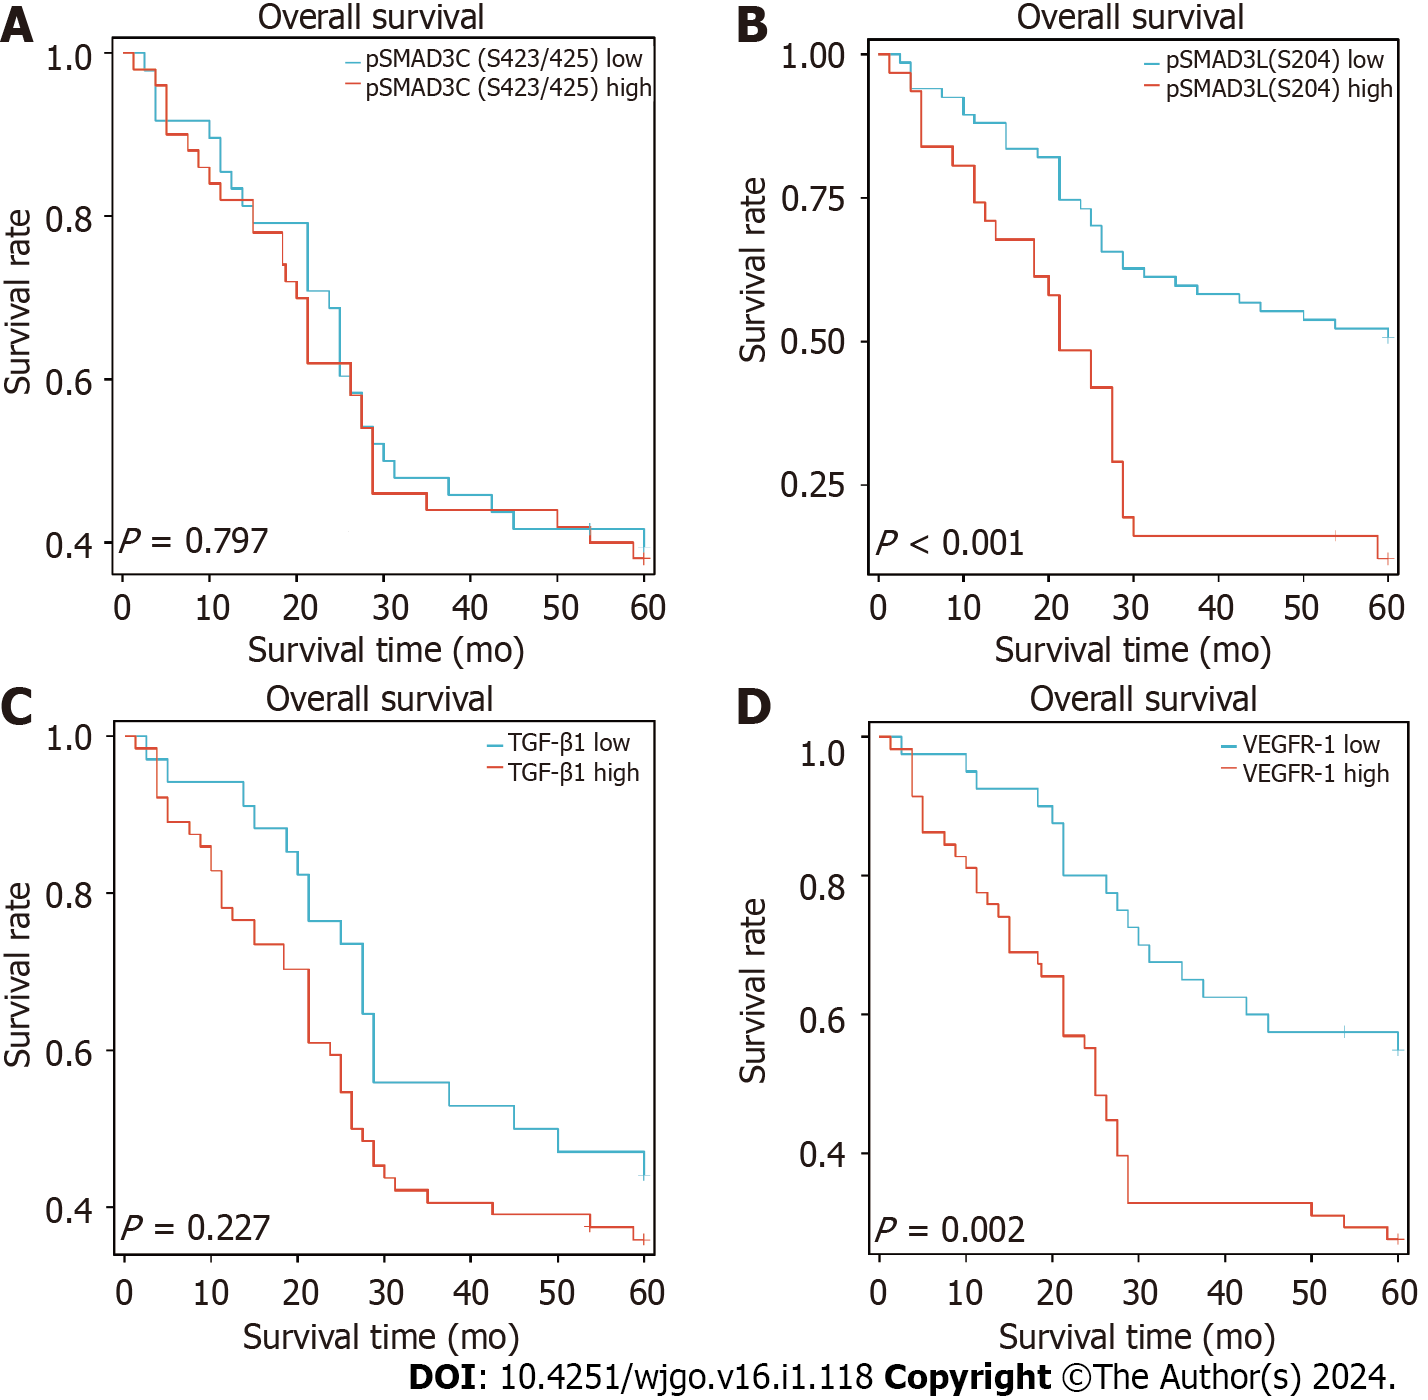
Figure 2 The prognostic value of TGF-β1, pSMAD3C, pSMAD3L, and VEGFR-1 in gastric cancer.
A-D: The correlation between the expression of (A) pSMAD3C (S423/425), (B) pSMAD3L(S204), (C) TGF-β1, and (D) VEGFR-1 and the overall survval of gastric cancer patients was analyzed using Kaplan-Meier analysis.
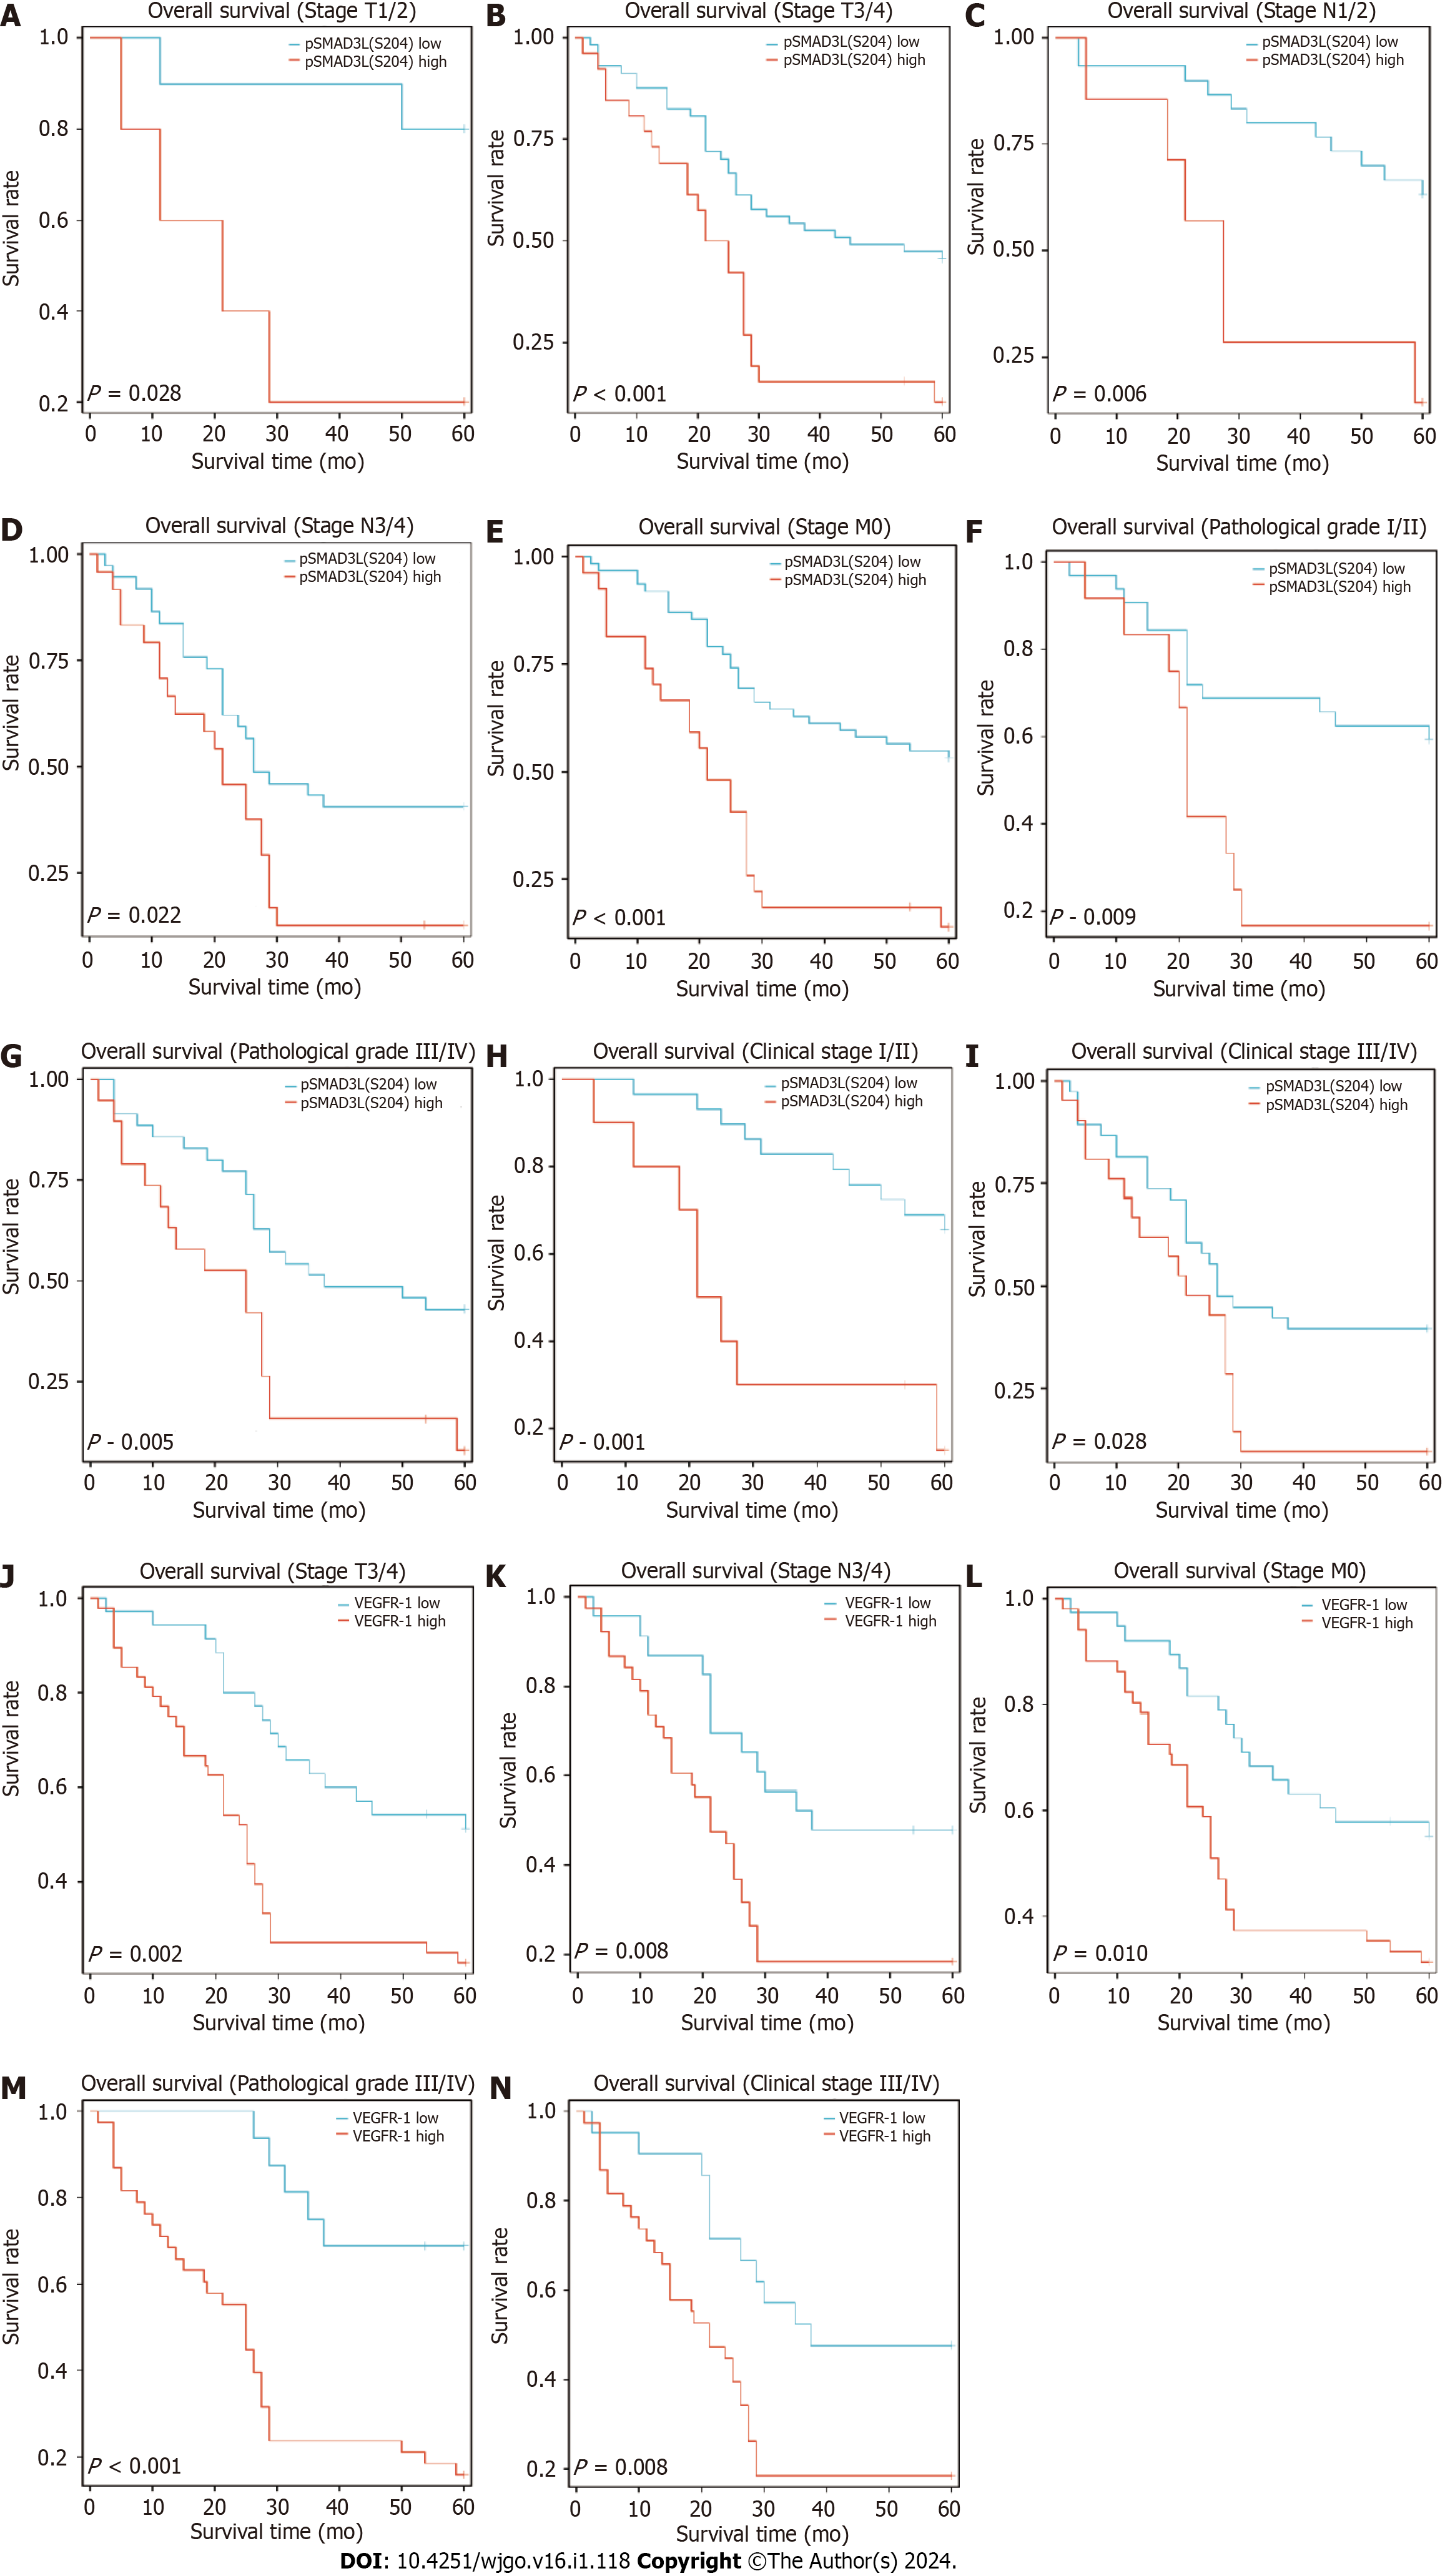
Figure 3 Evaluating the prognostic significance of pSMAD3L(S204) and VEGFR-1 expression in gastric cancer subgroups.
A-I: Kaplan-Meier analysis revealed that higher pSMAD3L(S204) expression was associated with shorter overall survival (OS) in several subgroups of gastric cancer (GC) patients, including T1/T2 (A), T3/T4 (B), N1/2 (C), N3/4 (D), M0 (E), Grade I/II (F), Grade III/IV (G), Clinical stage I/II (H), and Clinical stage III/IV (I); J-N: Moreover, higher VEGFR-1 expression was associated with shorter OS in subgroups of GC patients with T3/T4 (J), N3/4 (K), M0 (L), Grade III/IV (M), and Clinical stage III/IV (N).
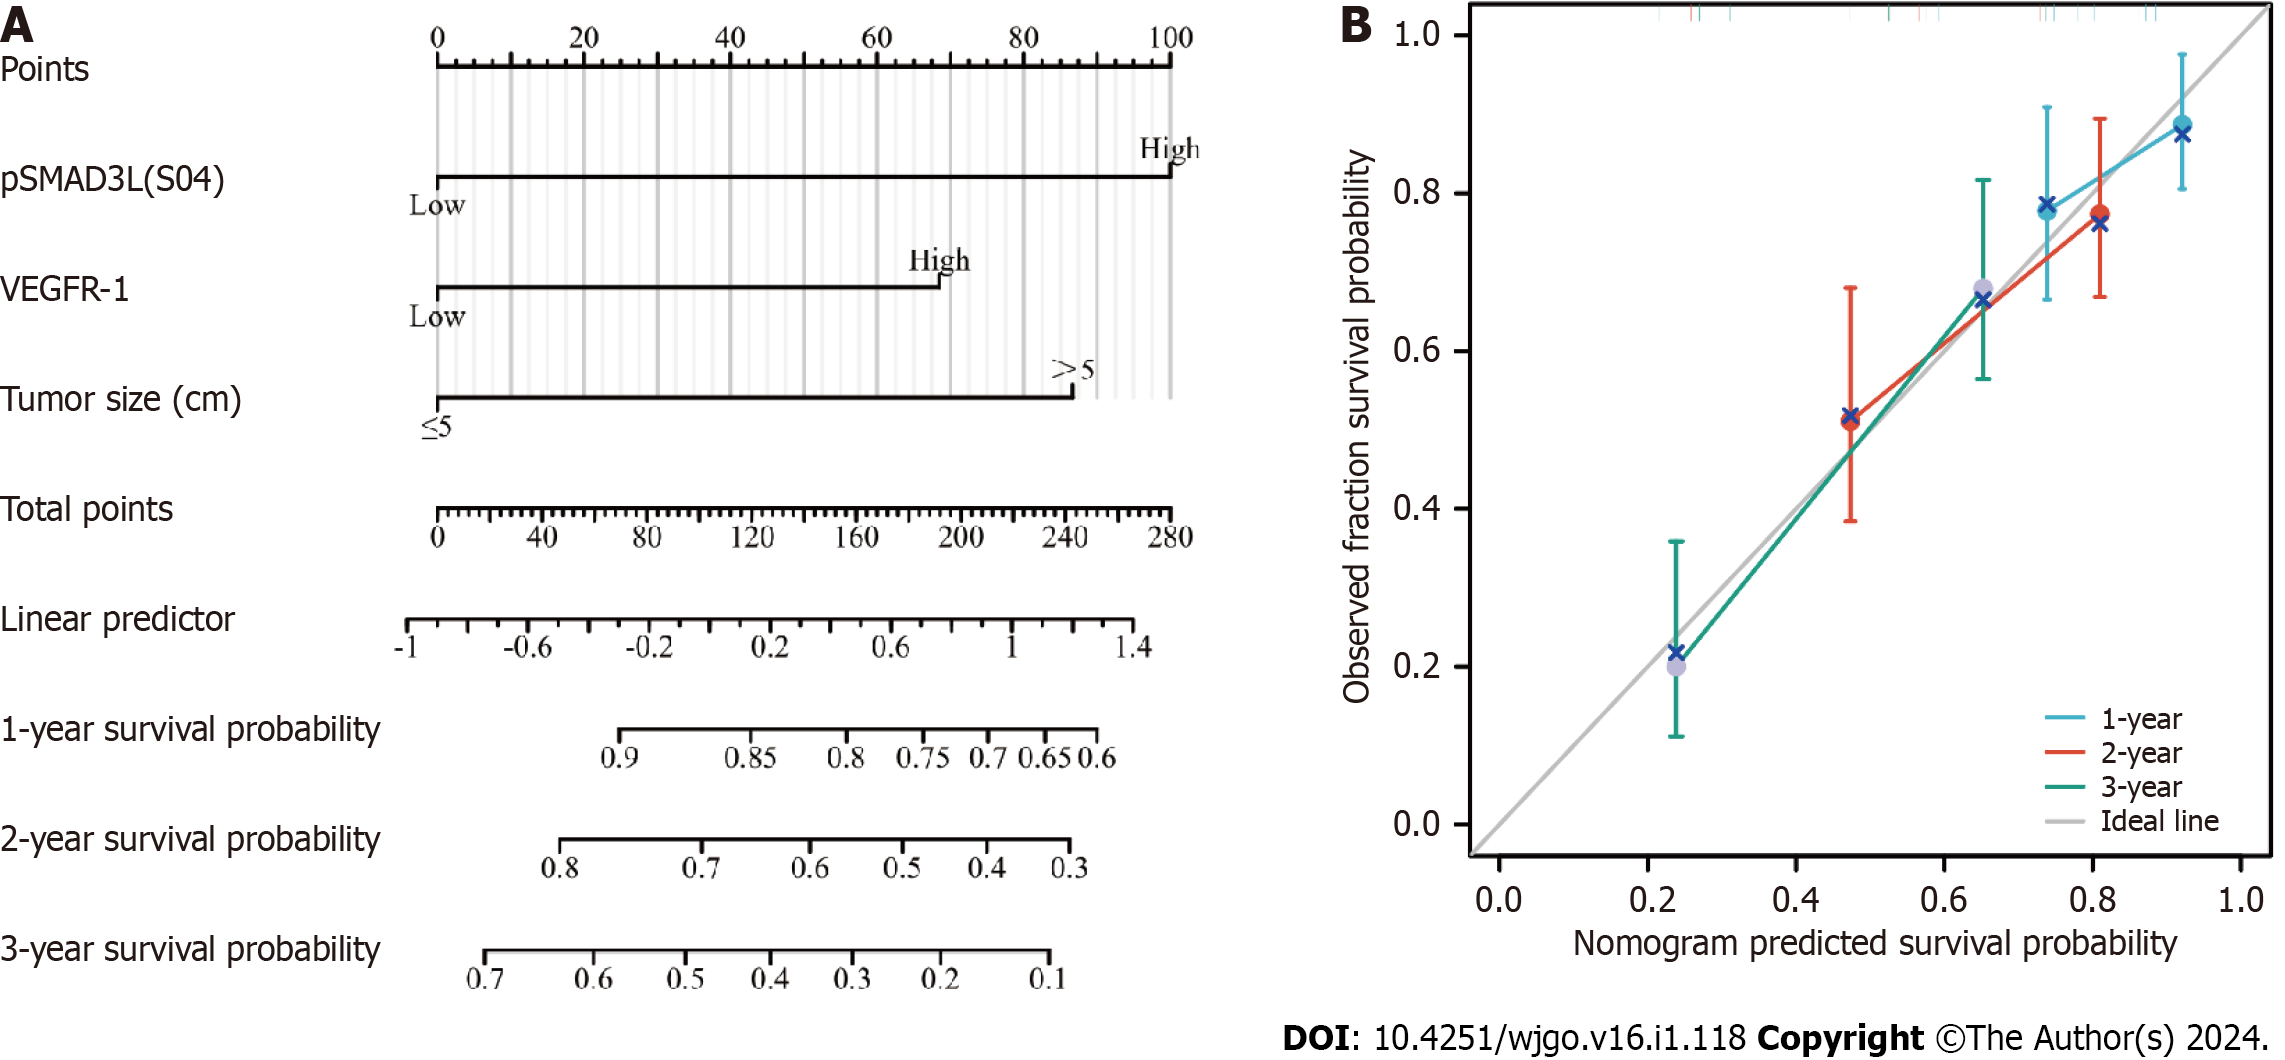
Figure 4 Construction and validation of the nomogram based on pSMAD3L(S204) and VEGFR-1 expression for predicting 1-year, 2-year, and 3-year overall survival in gastric cancer patients.
A: Nomogram; B: Calibration curve.
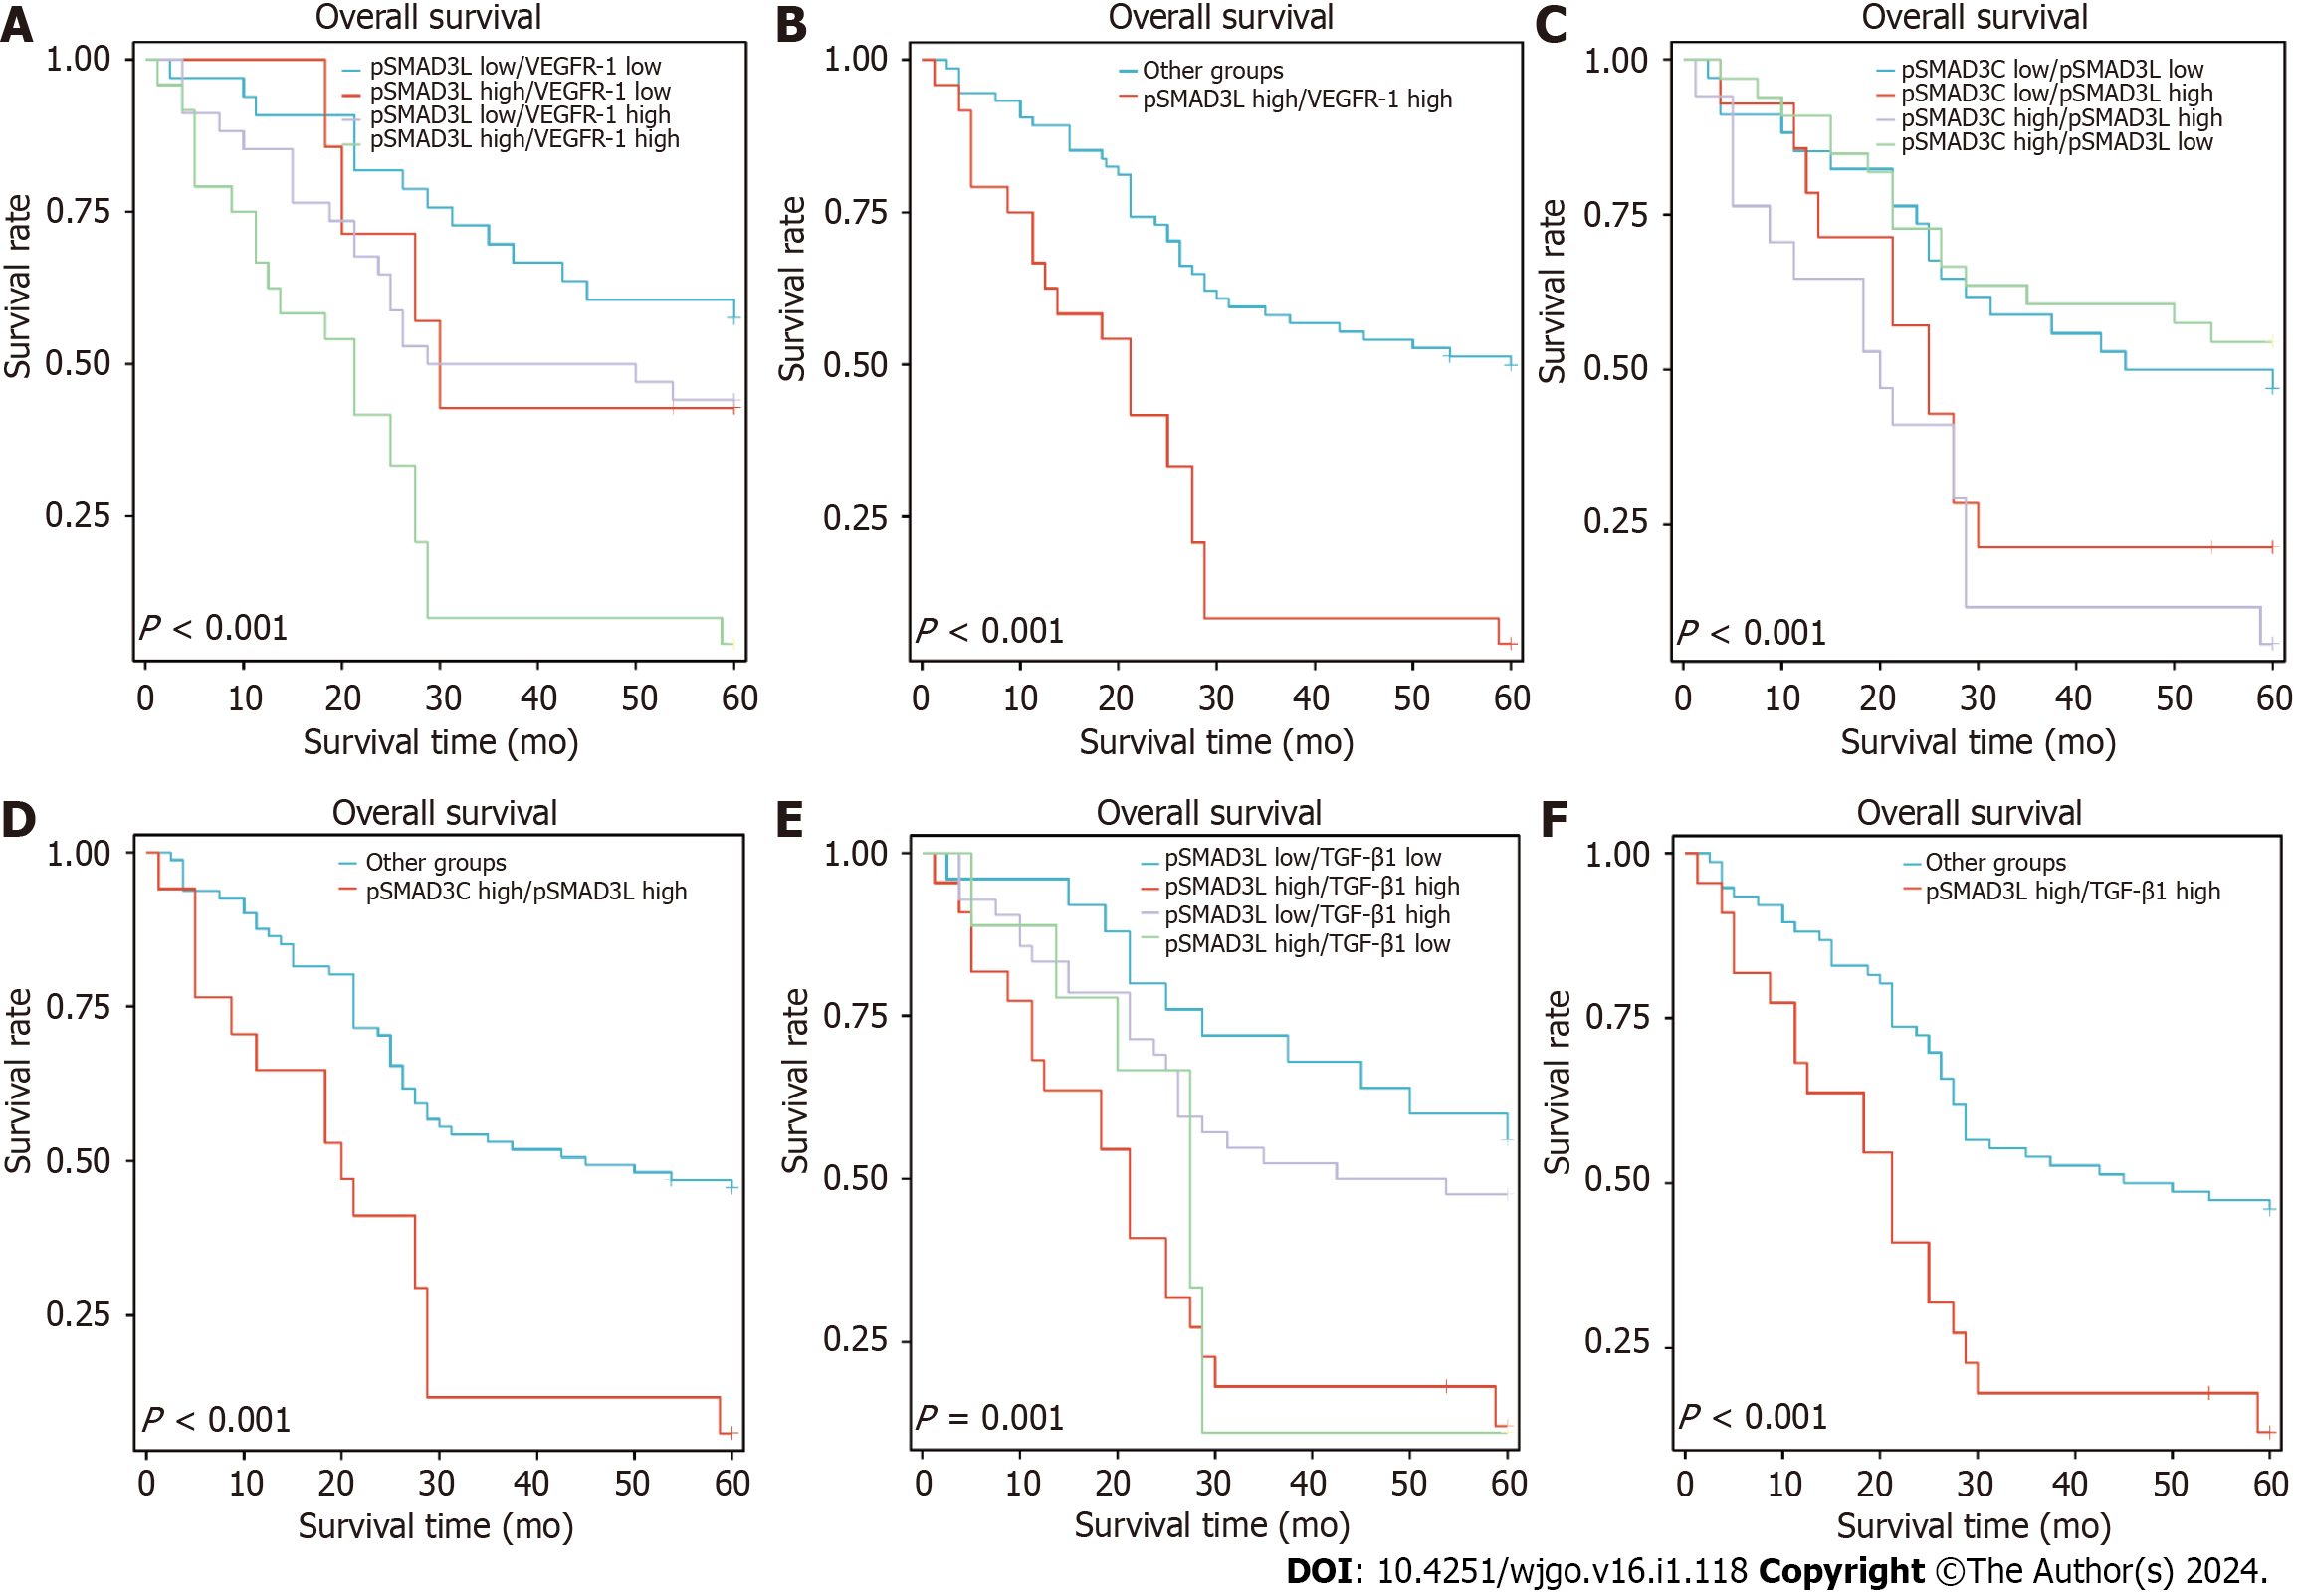
Figure 5 Co-expression of high pSMAD3L(204) and VEGFR-1, TGF-β1, or pSMAD3C(S423/425) are associated with reduced overall survival in patients with gastric cancer.
Kaplan-Meier survival curves of gastric cancer patients were generated based on the expression levels of pSMAD3L(S204) combined with expressions of VEGFR-1, TGF-β1, and pSMAD3C(S423/425). A: Patients with high pSMAD3L(S204) and high VEGFR-1 exhibited the worst overall survival (OS) compared with other patients in the cohort; B: Patients with simultaneously high levels of pSMAD3L(S204) and VEGFR-1 had shorter OS than other patients; C and D: Patients with concurrent high expression of pSMAD3L(S204) and pSMAD3C(S423/425) had reduced OS compared to other patients; E and F: Patients with simultaneously high expression of pSMAD3L(S204) and TGF-β1 had shorter OS compared to other patients.
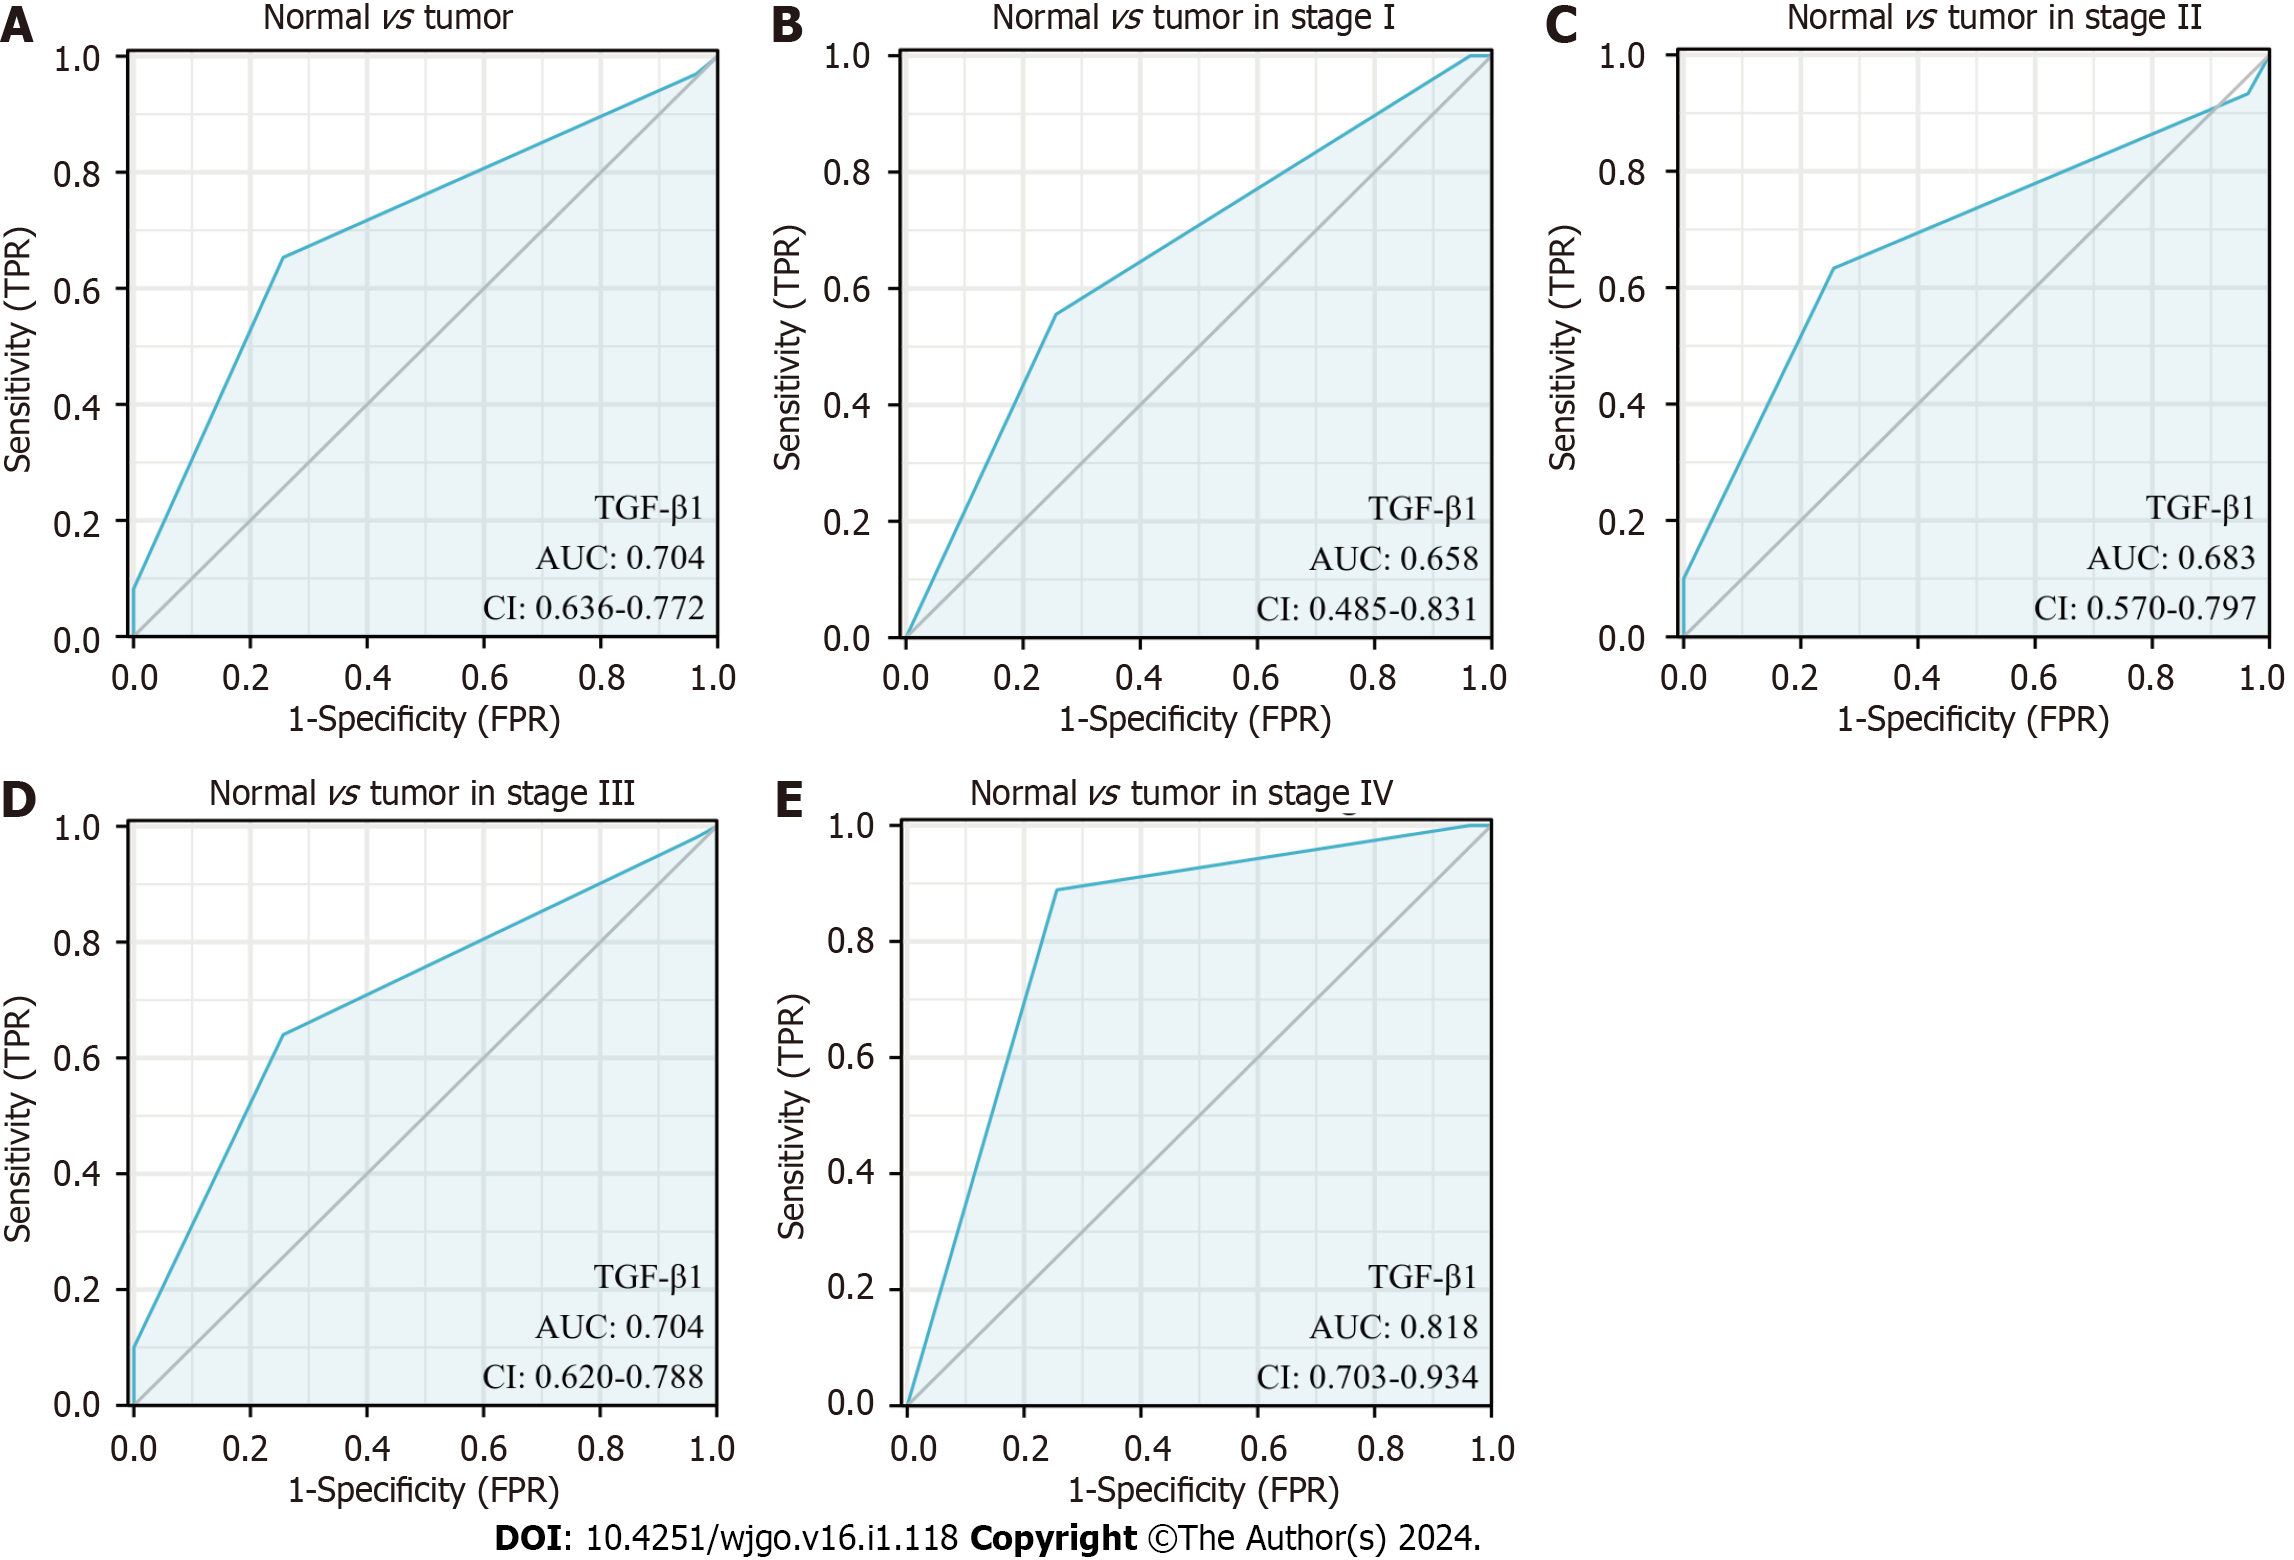
Figure 6 Diagnostic value of TGF-β1 expression in gastric cancer patients.
Receiver operating characteristic (ROC) curves were generated based on TGF-β1 protein expression levels in patient samples. A: ROC curve for TGF-β1 expression in normal and tumor tissues; B-E: Subgroup analysis for stages I, II, III, and IV, respectively.
- Citation: Lv SL, Guo P, Zou JR, Chen RS, Luo LY, Huang DQ. Prognostic significance and relationship of SMAD3 phospho-isoforms and VEGFR-1 in gastric cancer: A clinicopathological study. World J Gastrointest Oncol 2024; 16(1): 118-132
- URL: https://www.wjgnet.com/1948-5204/full/v16/i1/118.htm
- DOI: https://dx.doi.org/10.4251/wjgo.v16.i1.118


