Copyright
©The Author(s) 2023.
World J Gastrointest Oncol. Sep 15, 2023; 15(9): 1662-1672
Published online Sep 15, 2023. doi: 10.4251/wjgo.v15.i9.1662
Published online Sep 15, 2023. doi: 10.4251/wjgo.v15.i9.1662
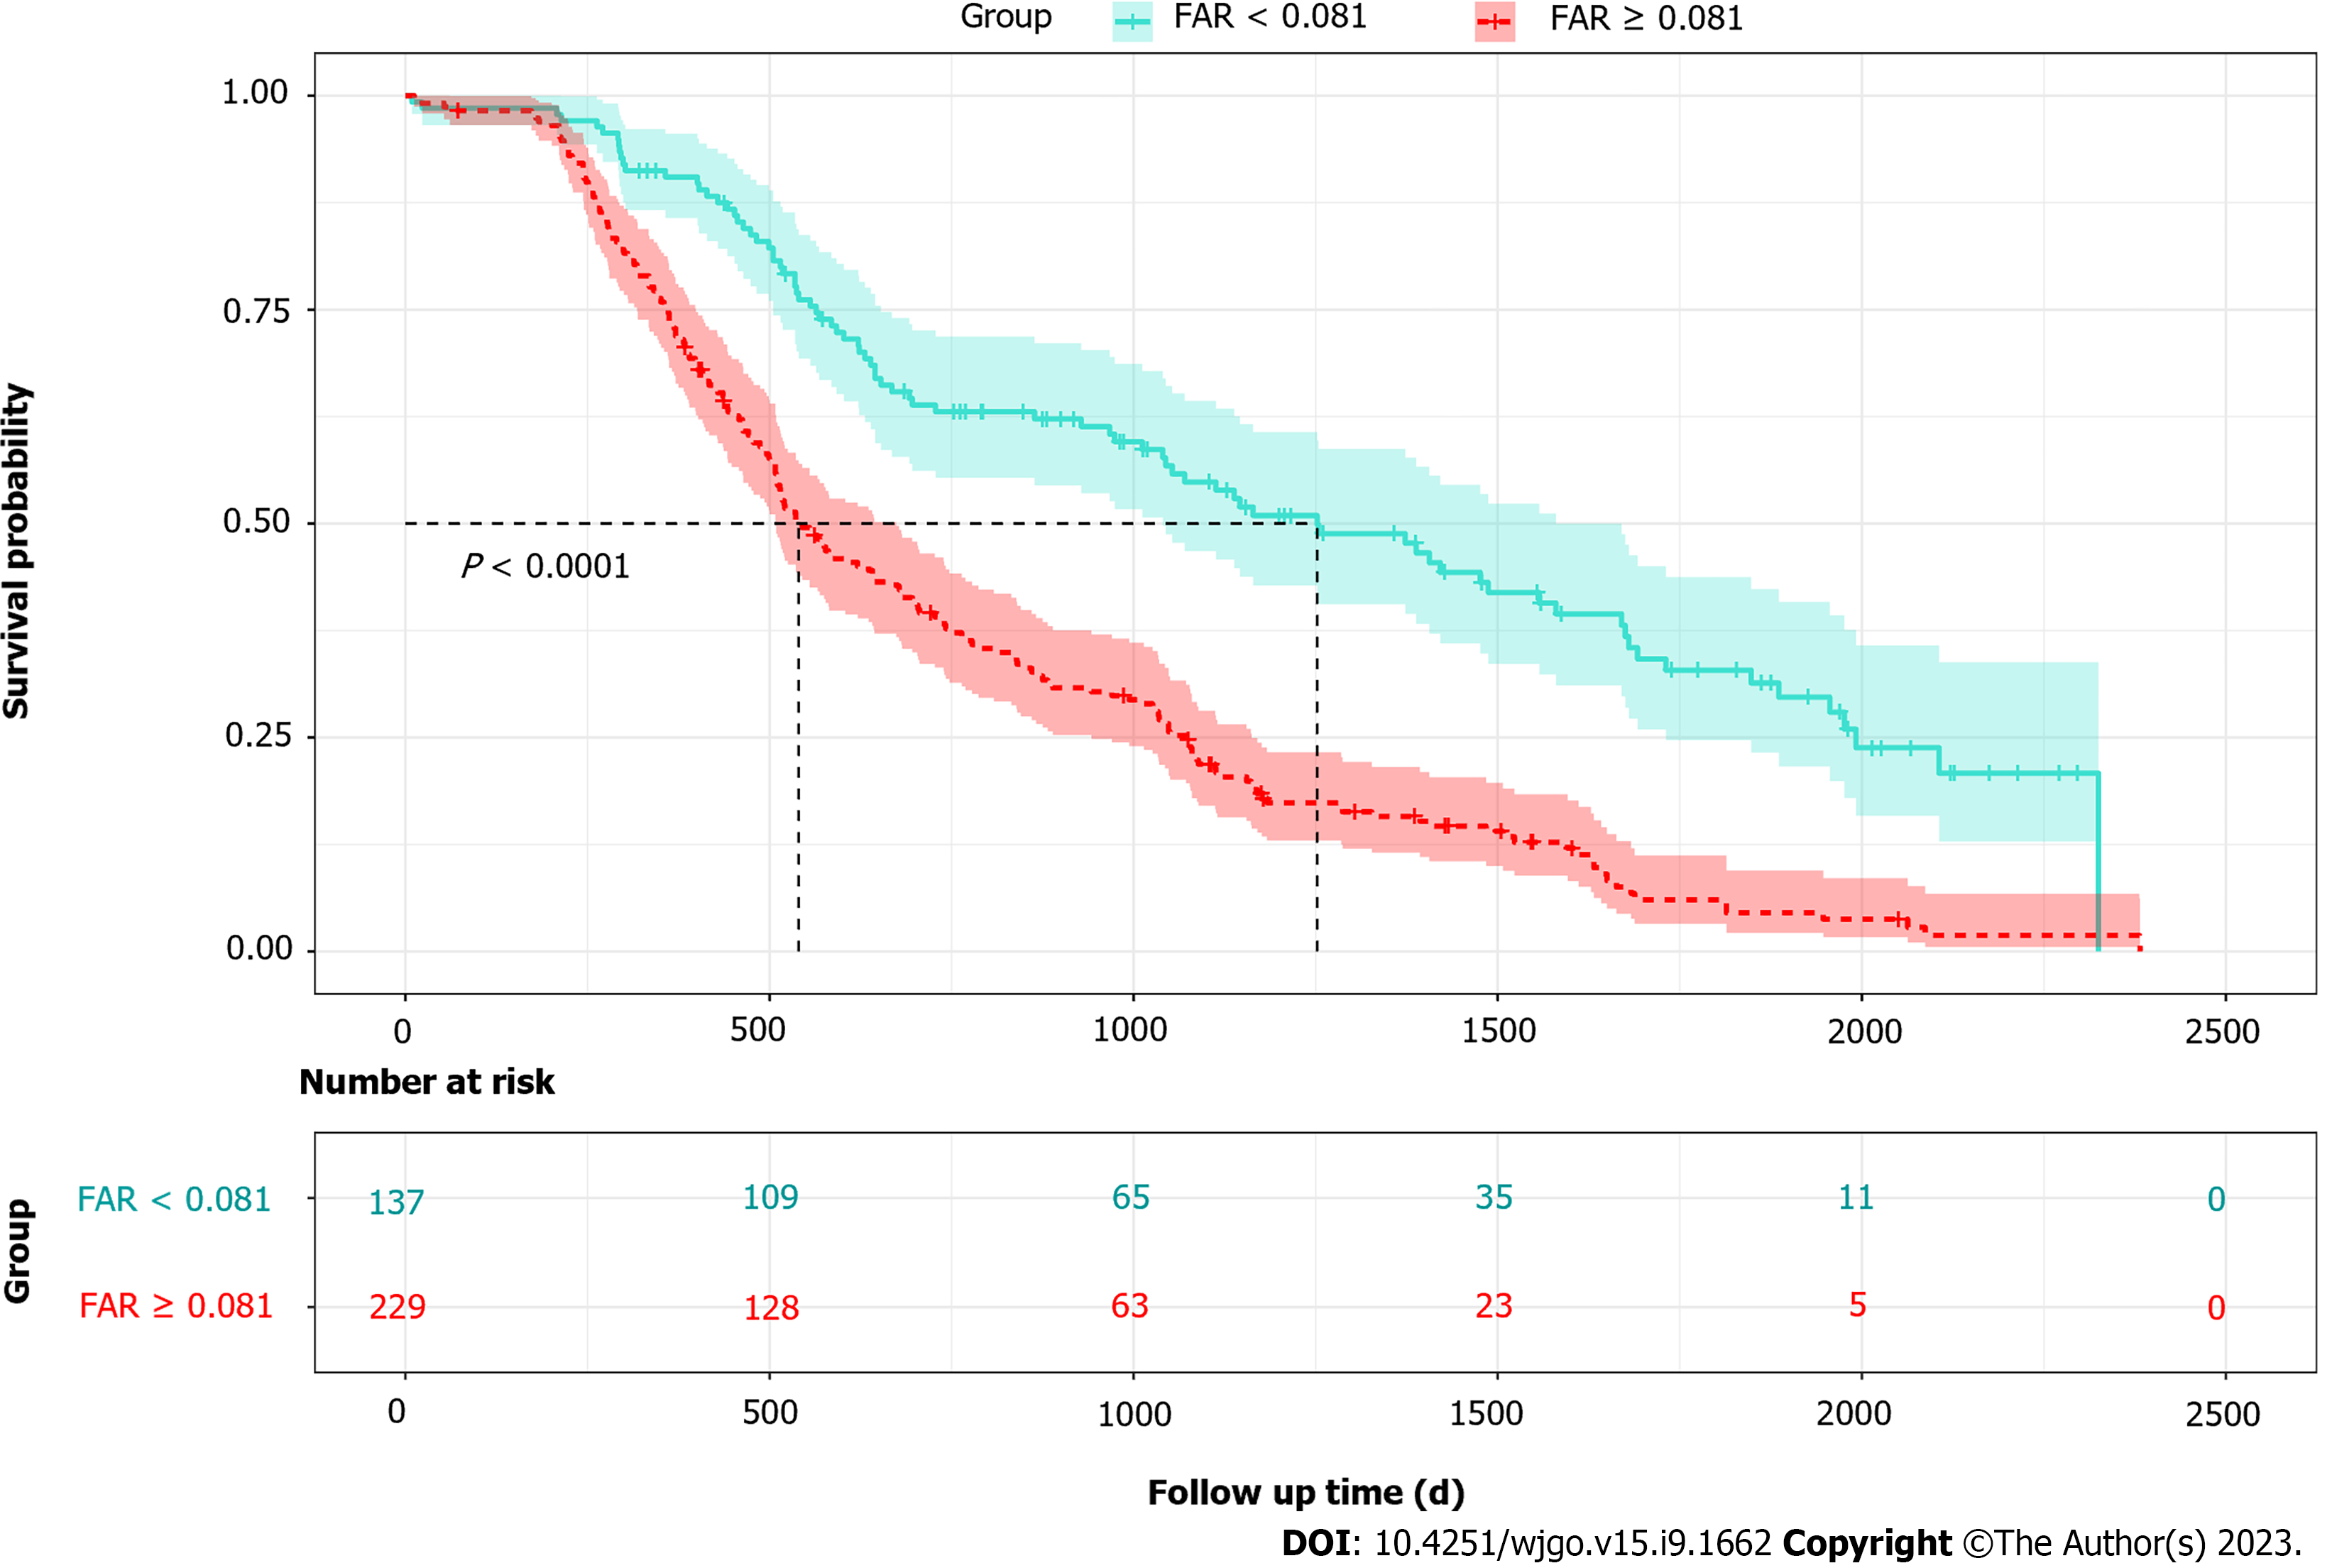
Figure 1 Kaplan-Meier survival curves for hepatocellular carcinoma patients with different baseline fibrinogen-to-albumin ratio levels.
FAR: Fibrinogen-to-albumin ratio.
Figure 2 Dose-response association between baseline fibrinogen-to-albumin ratio and the overall survival of hepatocellular carcinoma by using the quartiles.
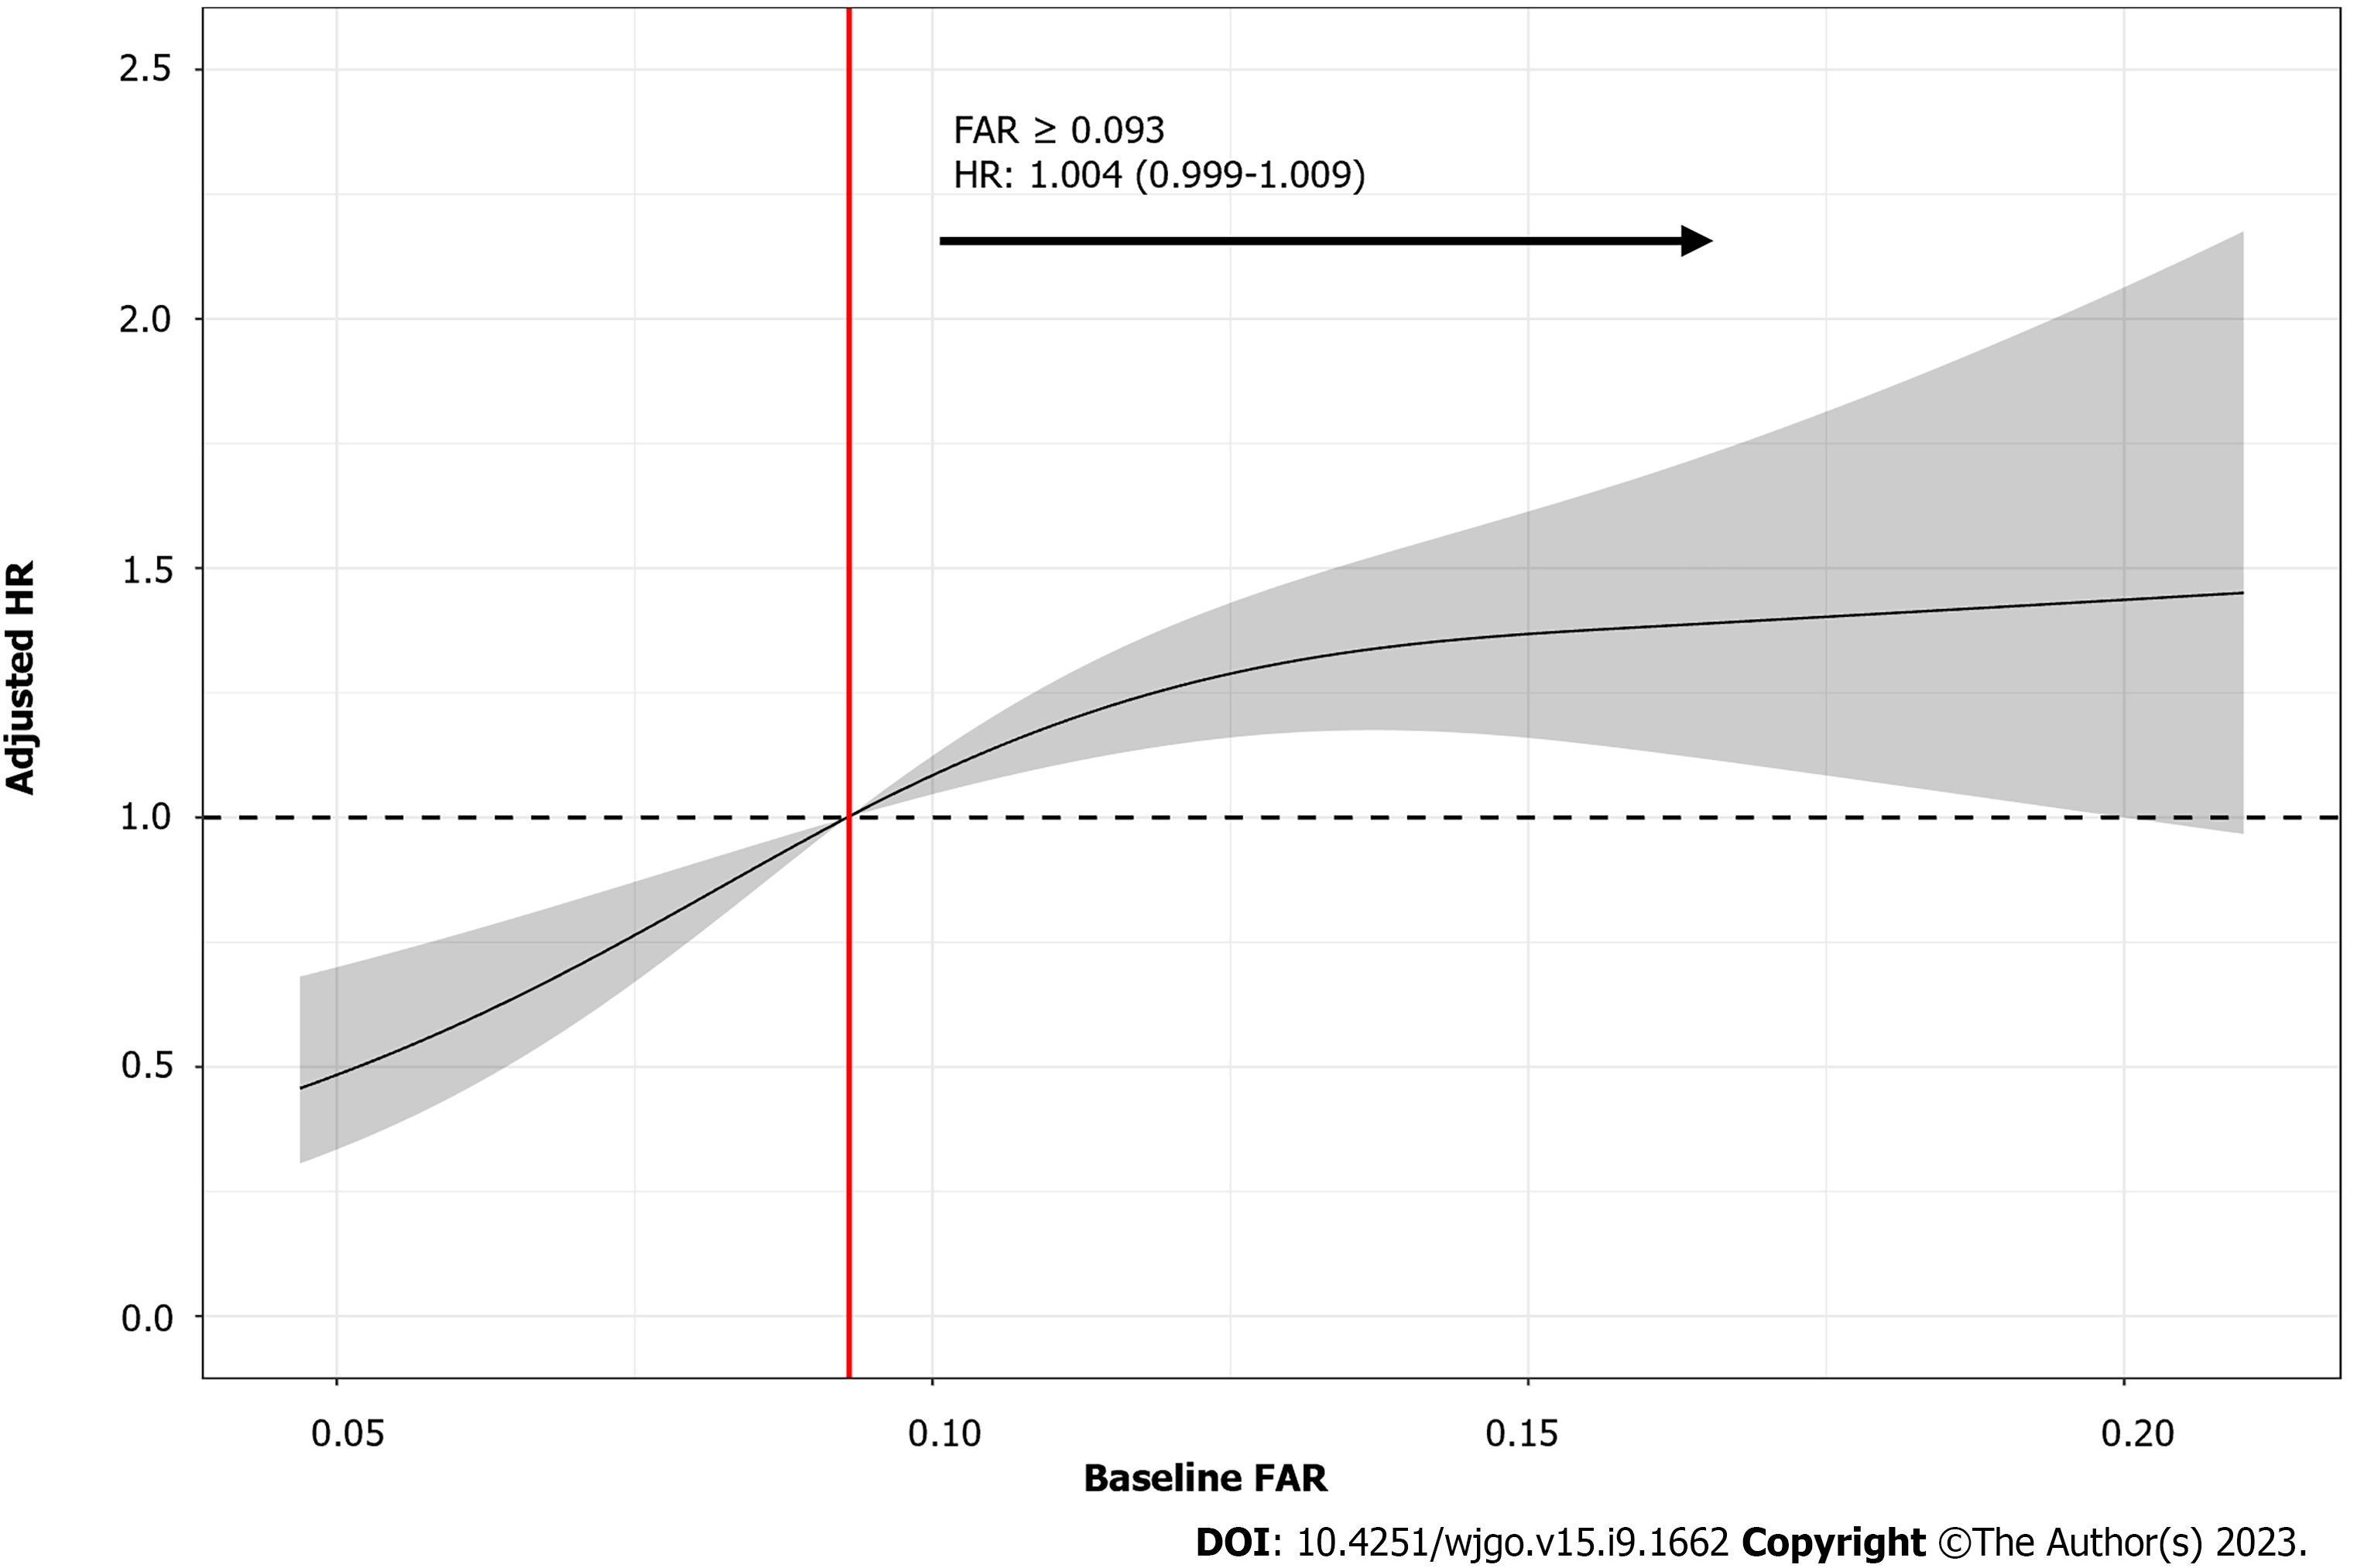
Figure 3 Dose-response relationship between quantitative baseline fibrinogen-to-albumin ratio and the overall survival of hepatocellular carcinoma patients by using the restricted cubic spline.
FAR: Fibrinogen-to-albumin ratio; HR: Hazard ratio.
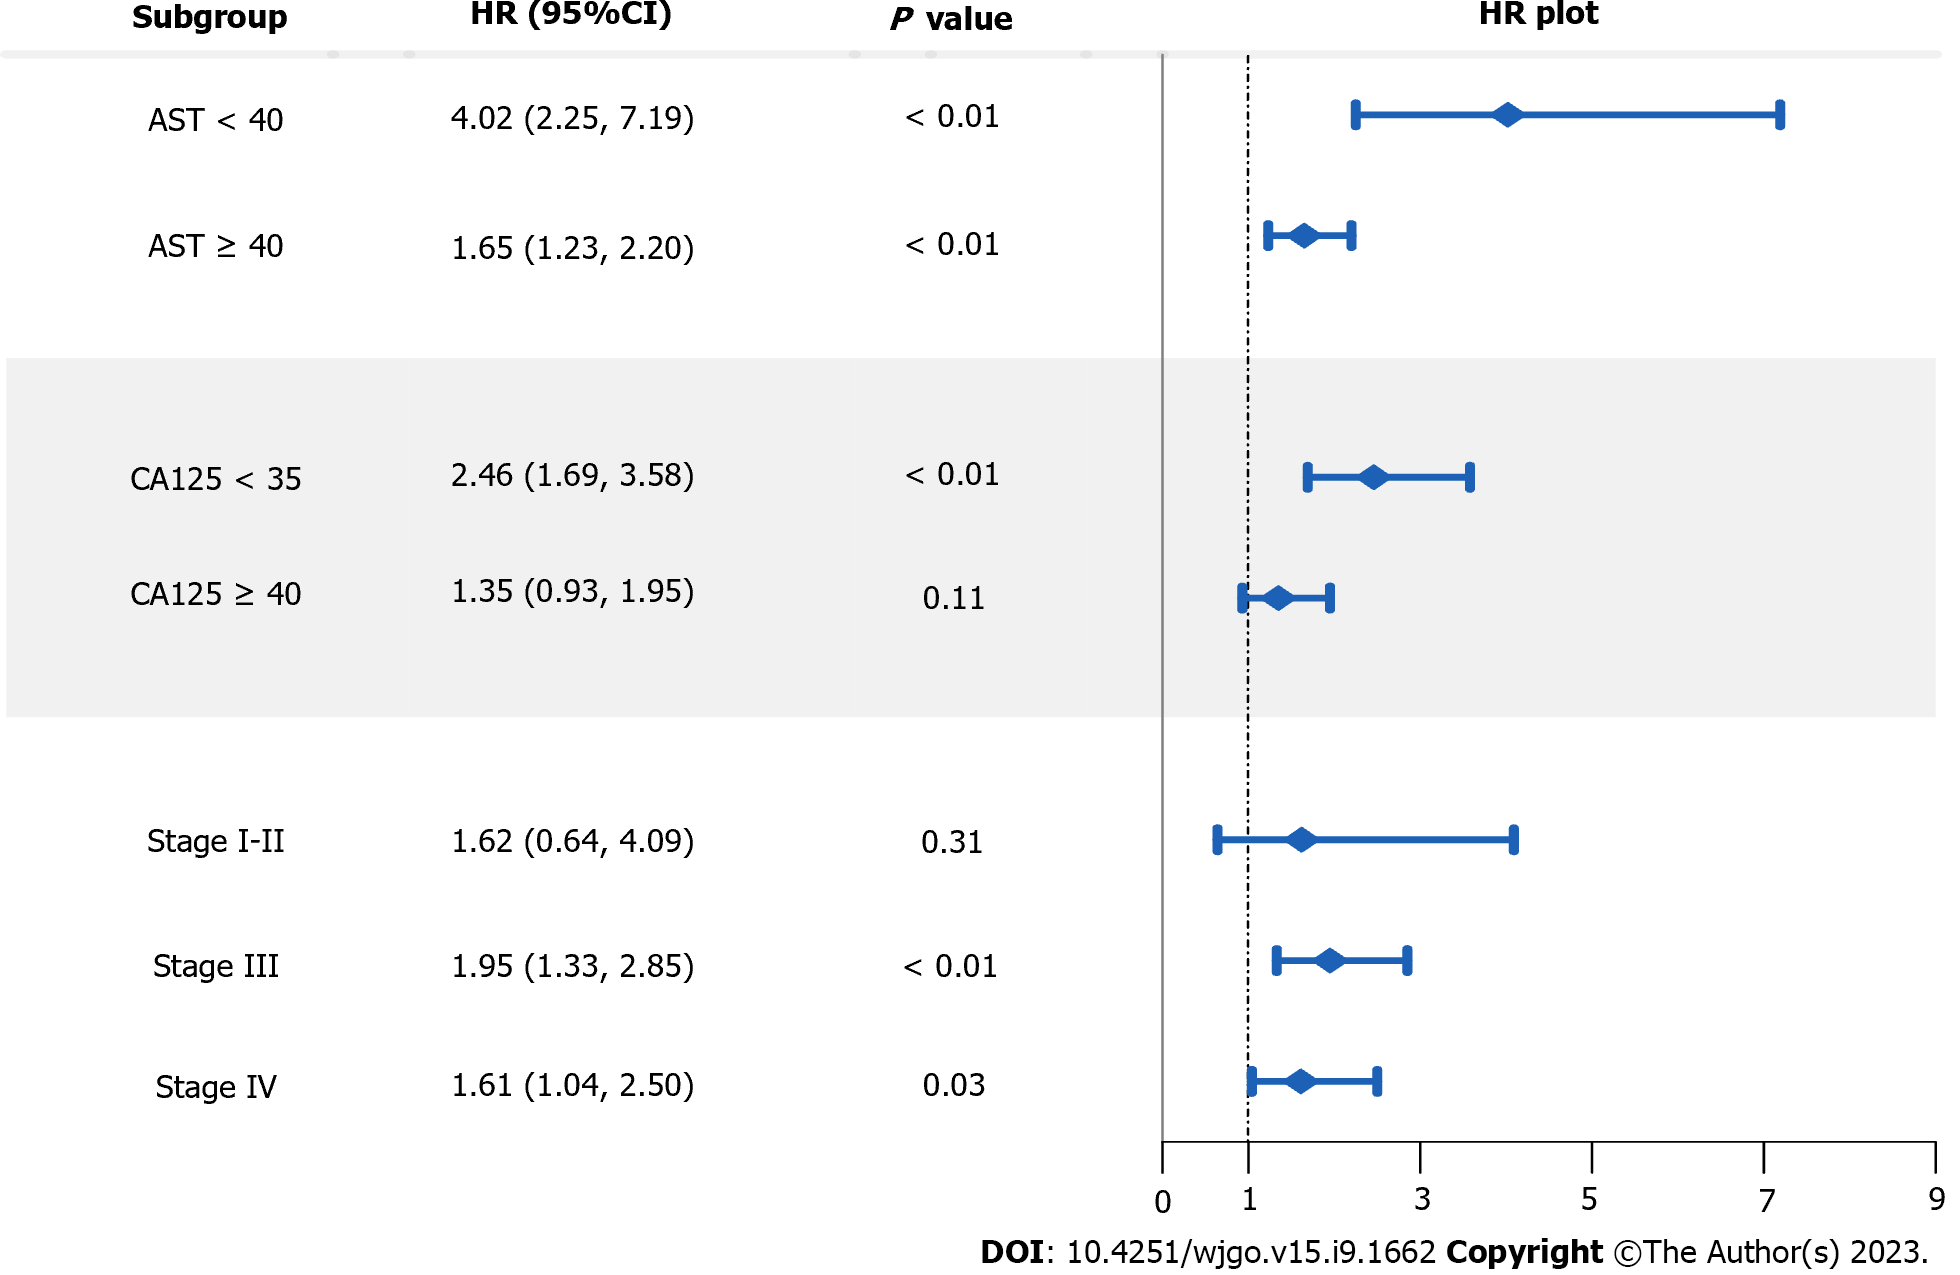
Figure 4 Subgroup analysis stratified by aspartate aminotransferase, carbohydrate antigen 125 and clinical stage.
95%CI: 95% confidence interval; AST: Aspartate aminotransferase; CA125: Carbohydrate antigen 125; HR: Hazard ratio.
- Citation: Sun H, Ma J, Lu J, Yao ZH, Ran HL, Zhou H, Yuan ZQ, Huang YC, Xiao YY. Fibrinogen-to-albumin ratio predicts overall survival of hepatocellular carcinoma. World J Gastrointest Oncol 2023; 15(9): 1662-1672
- URL: https://www.wjgnet.com/1948-5204/full/v15/i9/1662.htm
- DOI: https://dx.doi.org/10.4251/wjgo.v15.i9.1662


