Copyright
©The Author(s) 2023.
World J Gastrointest Oncol. Sep 15, 2023; 15(9): 1595-1604
Published online Sep 15, 2023. doi: 10.4251/wjgo.v15.i9.1595
Published online Sep 15, 2023. doi: 10.4251/wjgo.v15.i9.1595
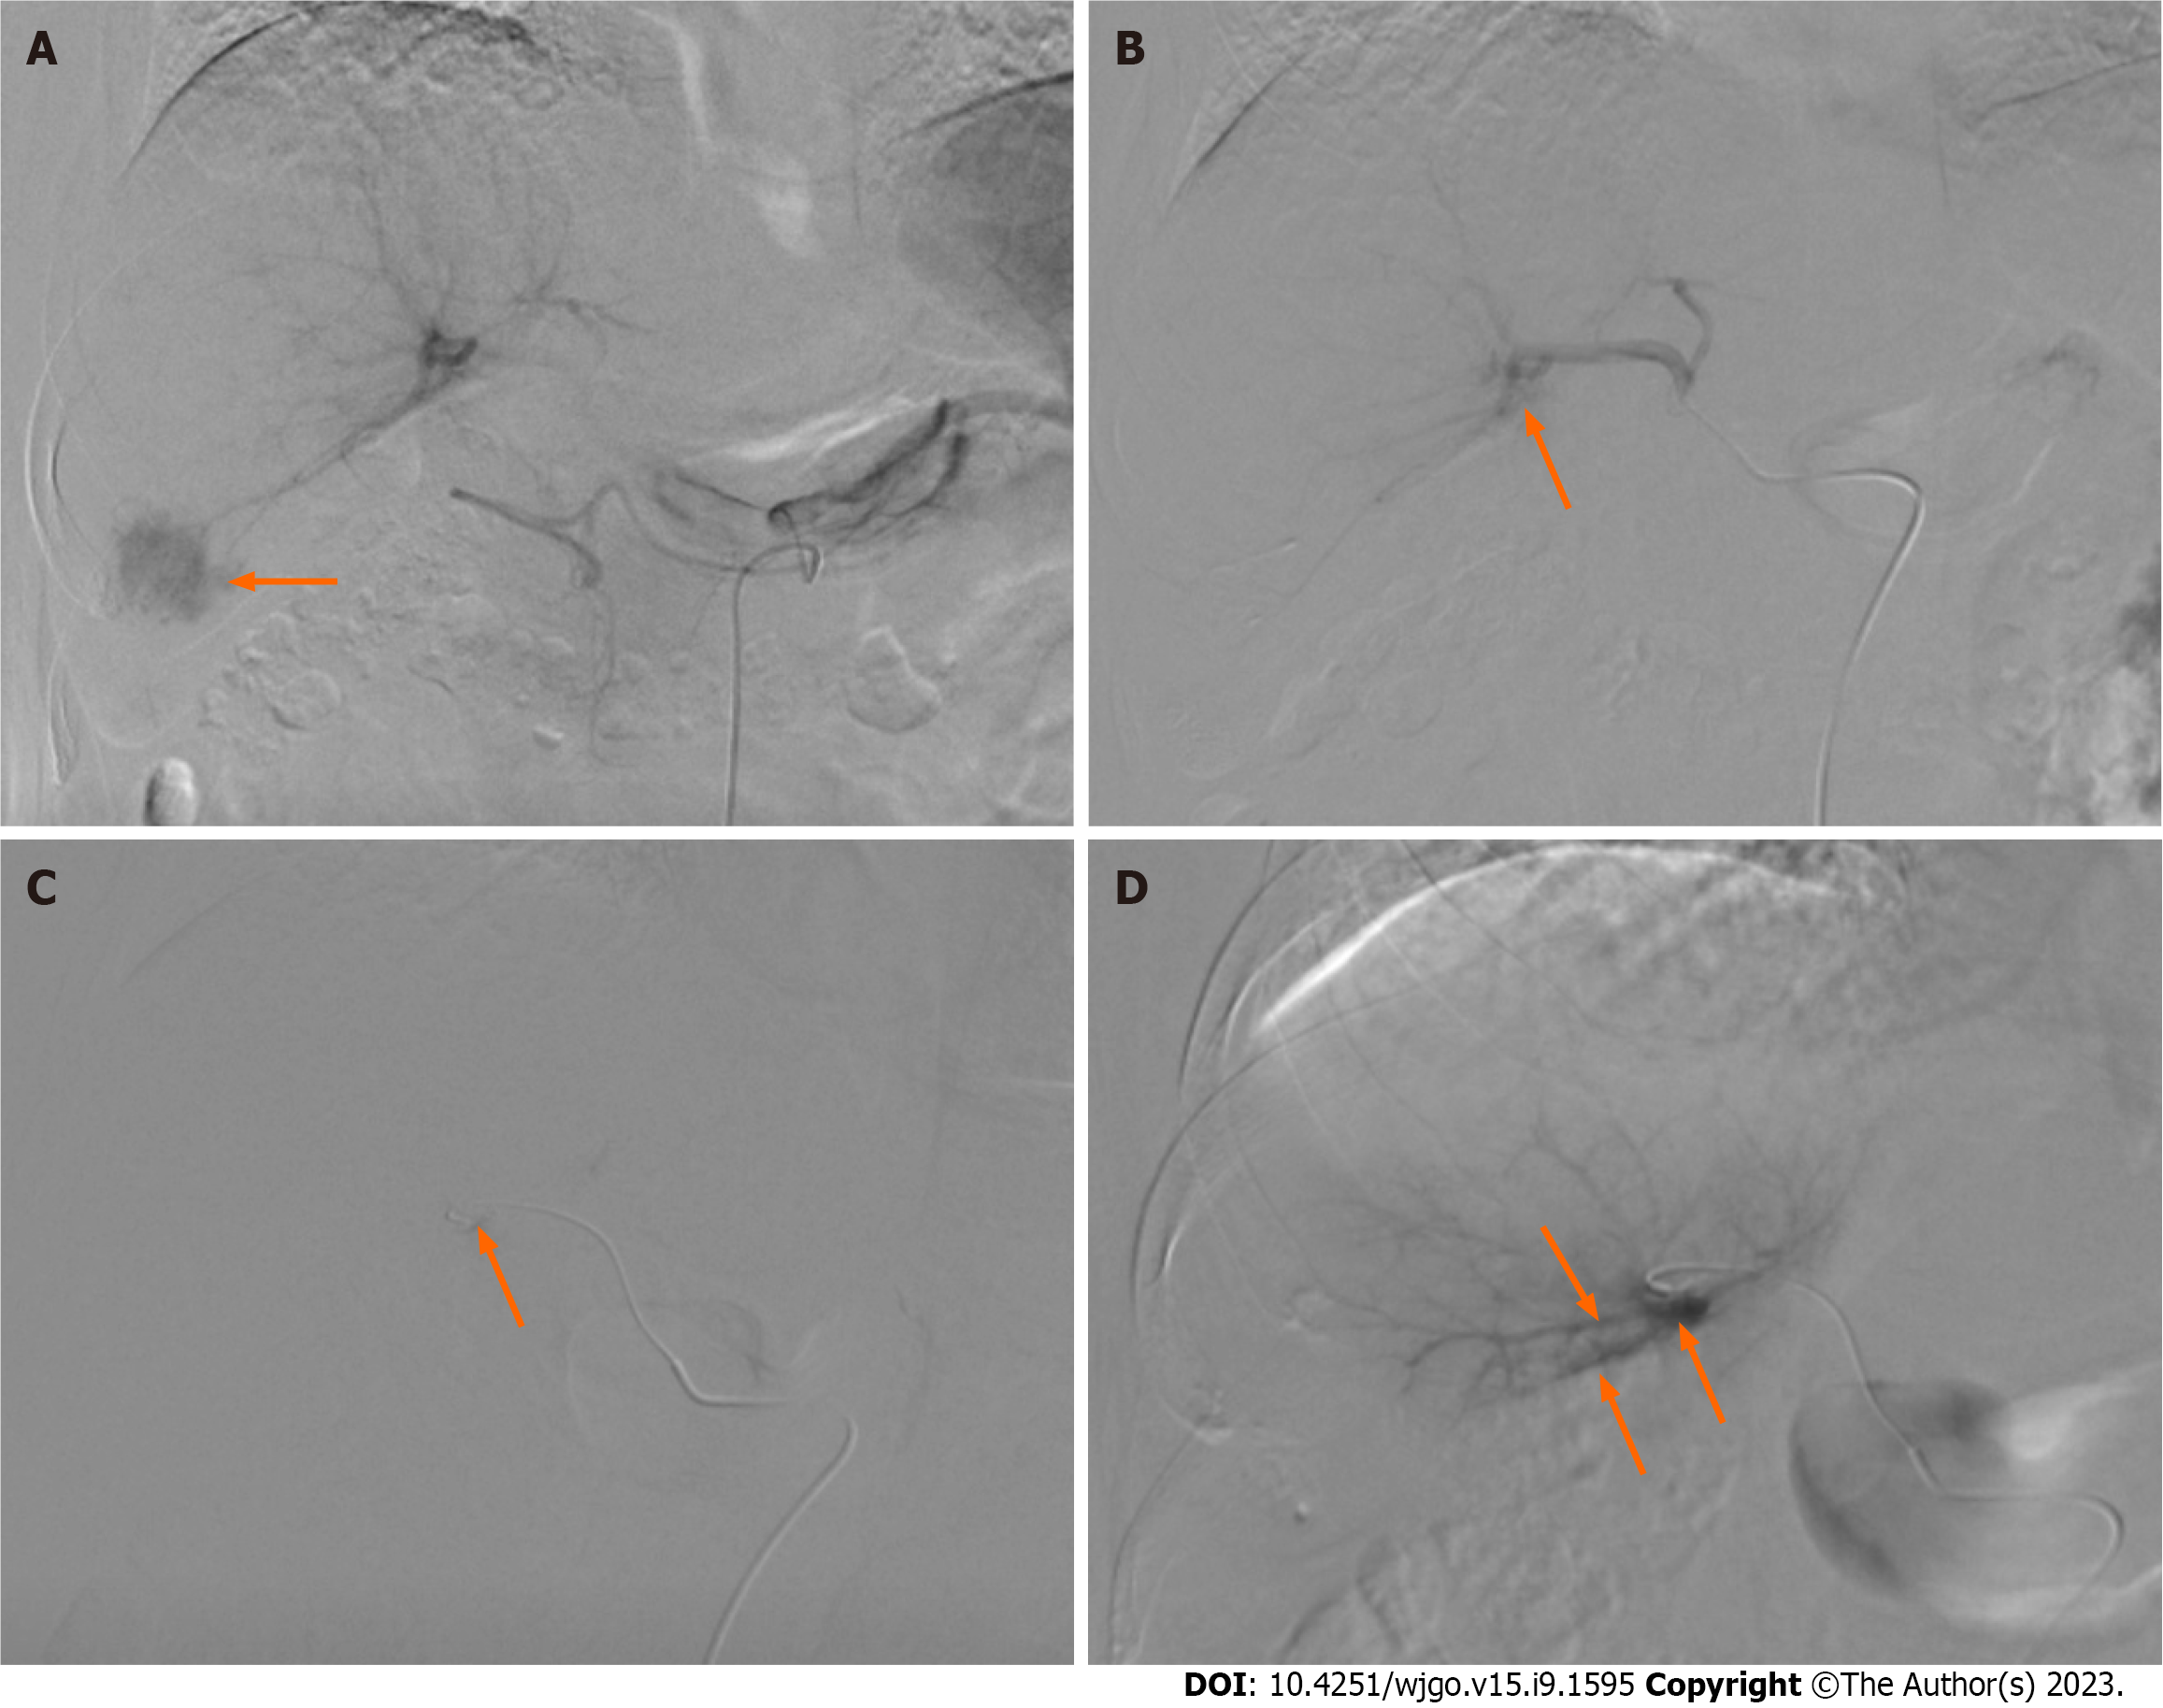
Figure 1 Digital subtraction angiography of the tumor and shunt.
A: Angiography of the celiac artery shows liver tumor staining (orange arrow) in segment Ⅵ; B: Angiography of the proper hepatic artery shows hepatic arterioportal shunt. The orange arrow indicates the branch of the portal vein; C: The feeding artery (orange arrow) of the shunt is super-selected with a microcatheter; D: Angiography with the microcatheter shows the branches of the portal vein (orange arrow).
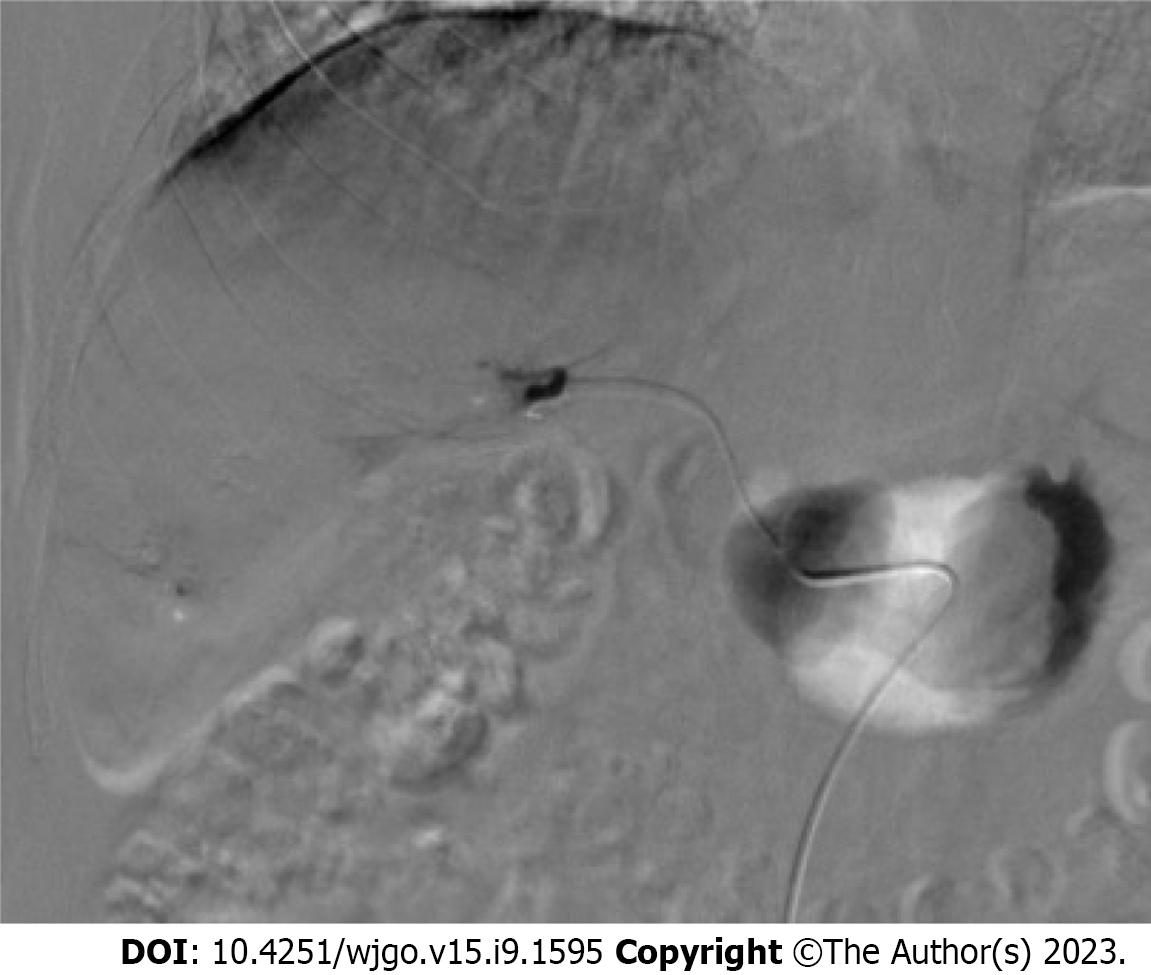
Figure 2 Repeated angiography confirmed completed embolization of the shunt.
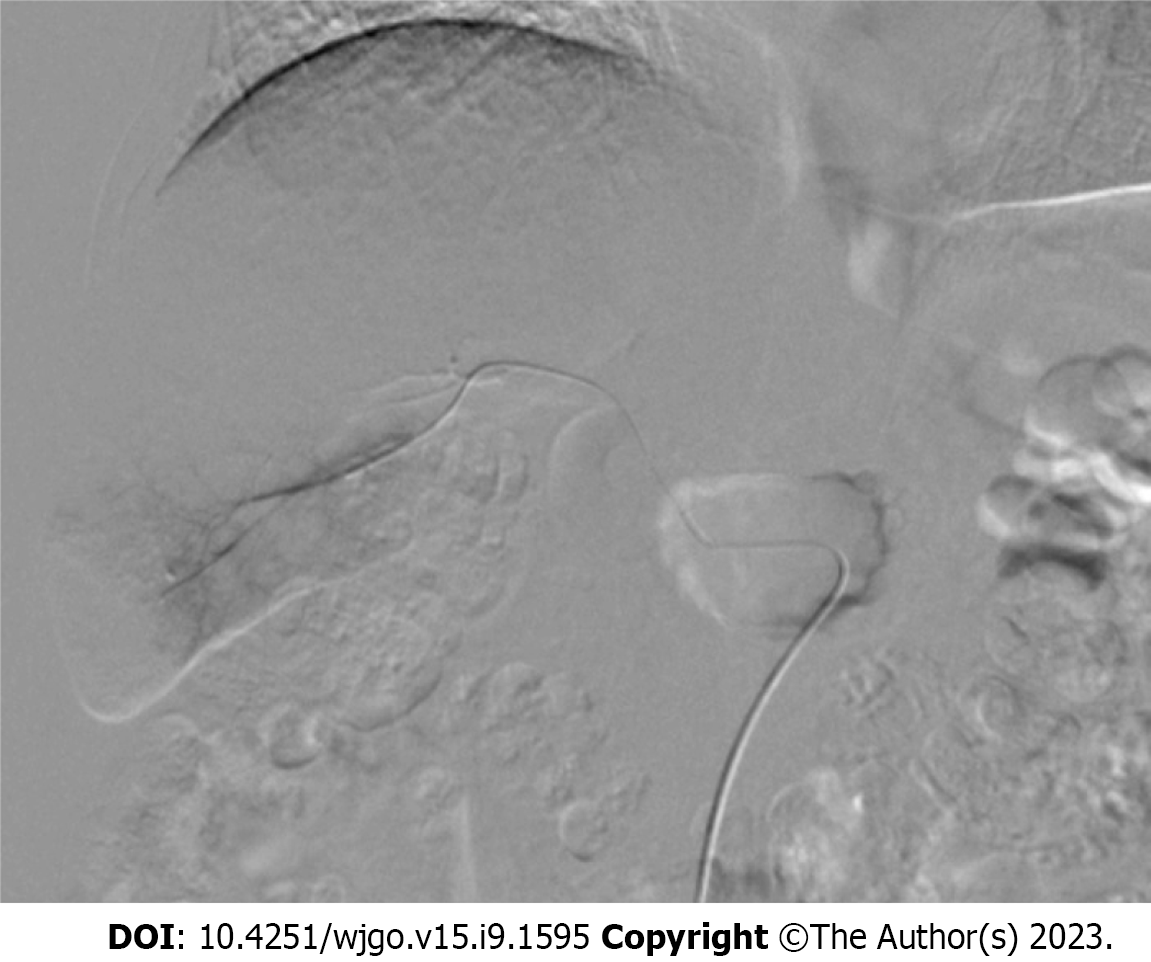
Figure 3 Angiography performed to confirm complete embolization of the tumor.
Figure 4 The Kaplan-Meier curve.
A: Overall survival; B: Progression-free survival.
- Citation: Yuan GS, Zhang LL, Chen ZT, Zhang CJ, Tian SH, Gong MX, Wang P, Guo L, Shao N, Liu B. Comparison of ethanol-soaked gelatin sponge and microspheres for hepatic arterioportal fistulas embolization in hepatic cellular carcinoma. World J Gastrointest Oncol 2023; 15(9): 1595-1604
- URL: https://www.wjgnet.com/1948-5204/full/v15/i9/1595.htm
- DOI: https://dx.doi.org/10.4251/wjgo.v15.i9.1595


