Copyright
©The Author(s) 2023.
World J Gastrointest Oncol. Aug 15, 2023; 15(8): 1400-1411
Published online Aug 15, 2023. doi: 10.4251/wjgo.v15.i8.1400
Published online Aug 15, 2023. doi: 10.4251/wjgo.v15.i8.1400
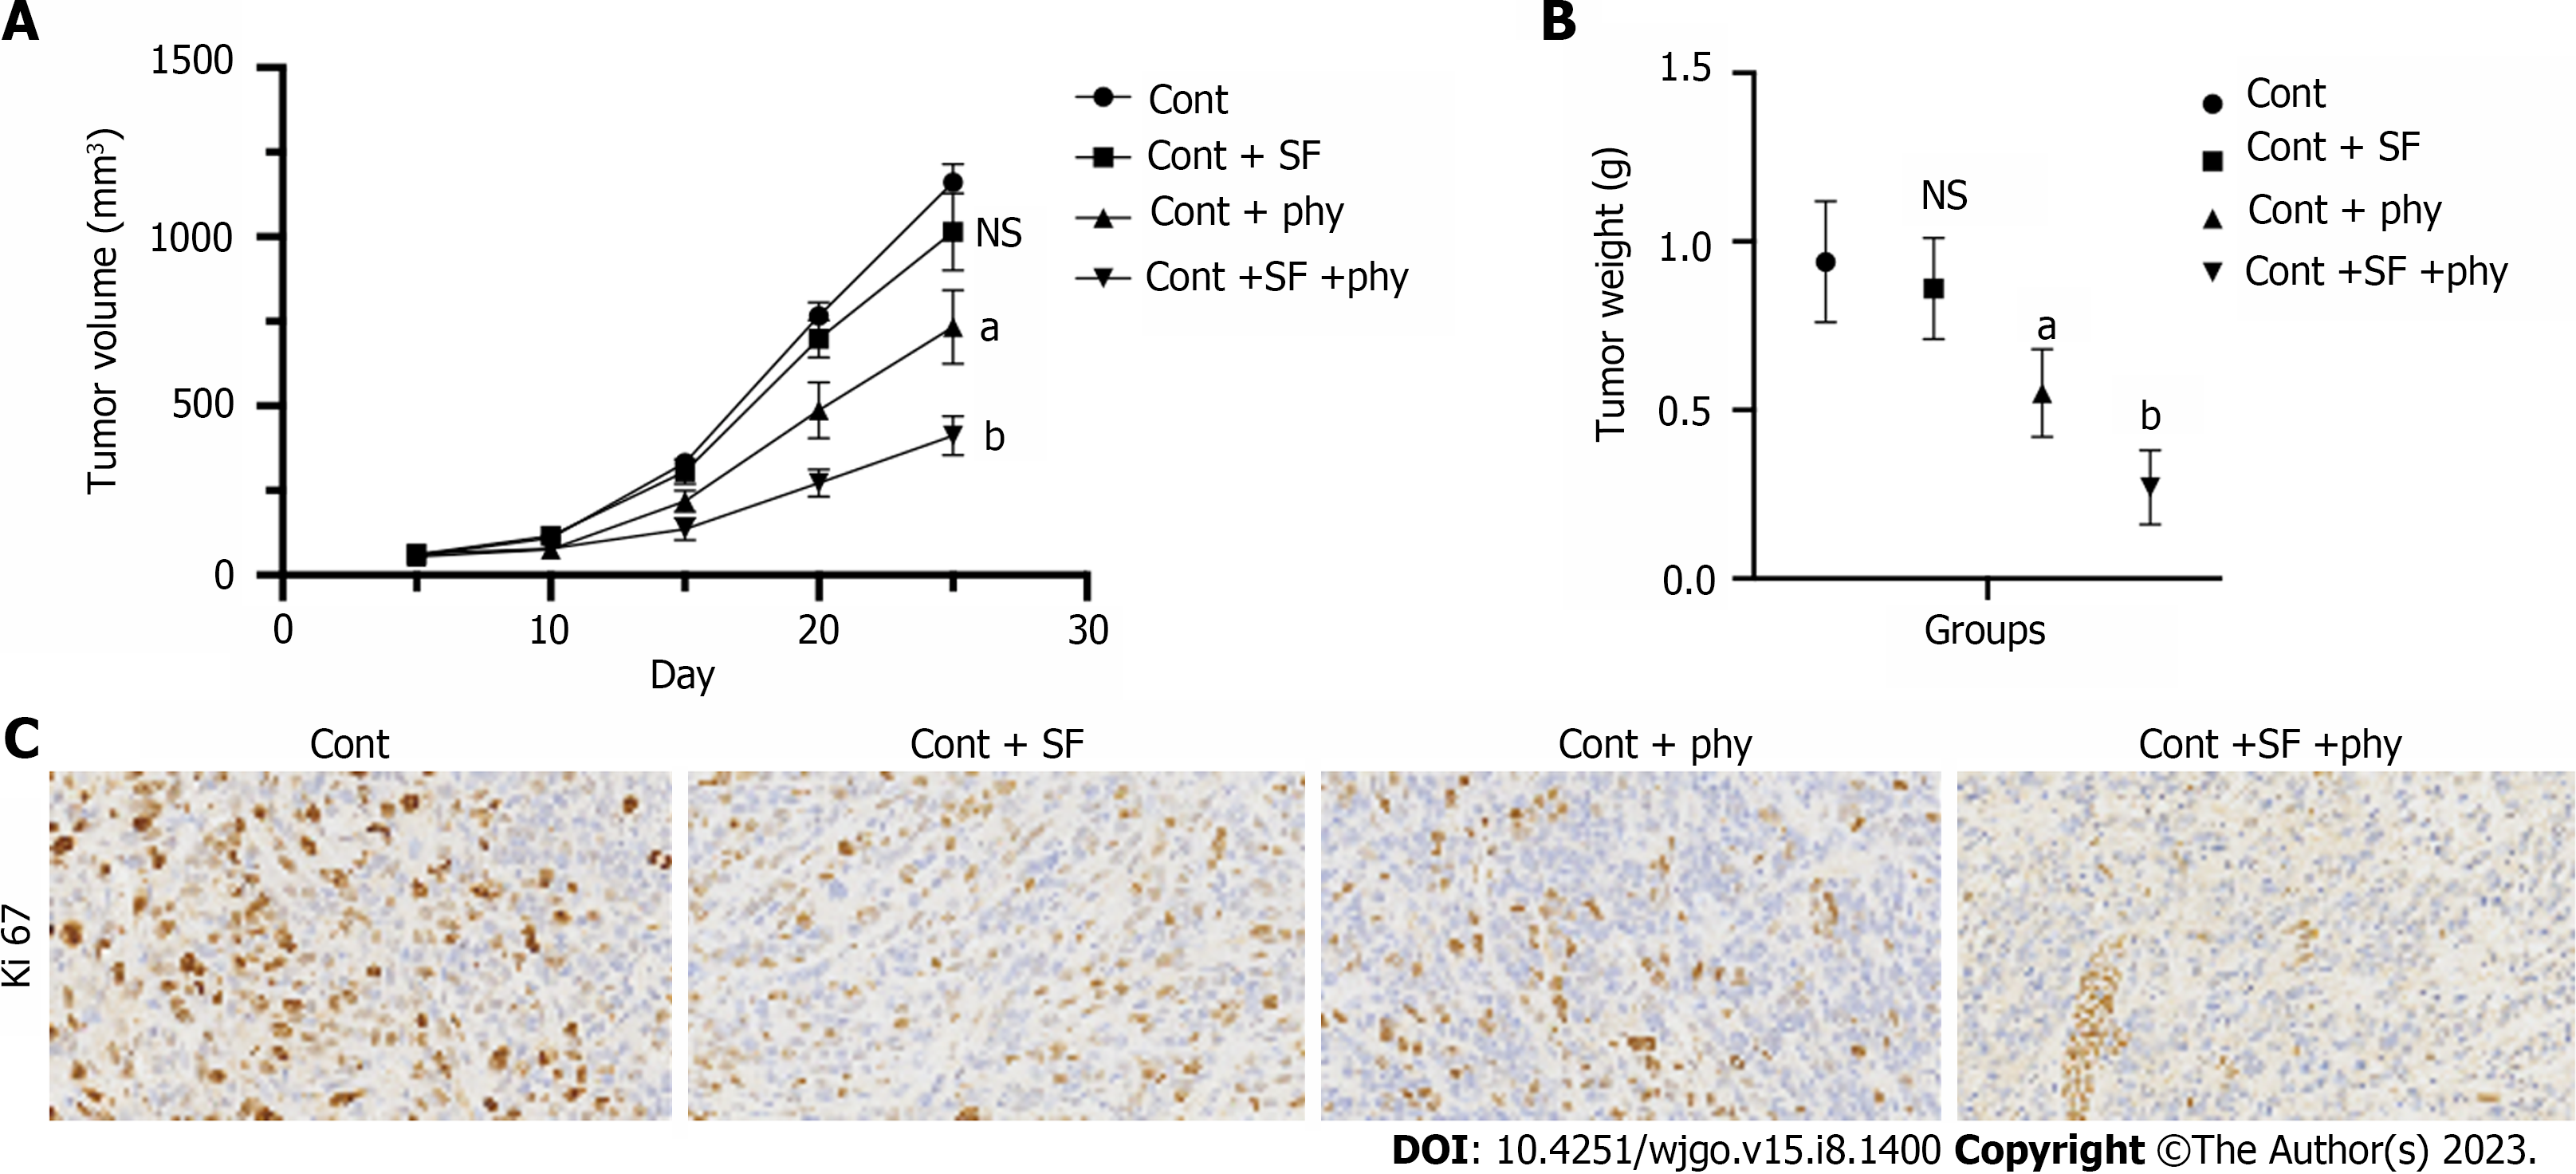
Figure 1 Physcion promotes sorafenib sensitivity in in vivo model.
A xenograft tumor model was established using the sorafenib-resistant Huh7 cells, followed by treatment with sorafenib and/or physcion. A and B: Tumor growth cure (A) and (B) tumor weight were measured; C: Expression of Ki67 in tumor tissues was analyzed by immunohistochemical staining. aP < 0.05 versus control (Cont) group; bP < 0.05 versus Cont + SF group. Cont: Control; SF: Sorafenib; phy: Physcion; NS: No significant.
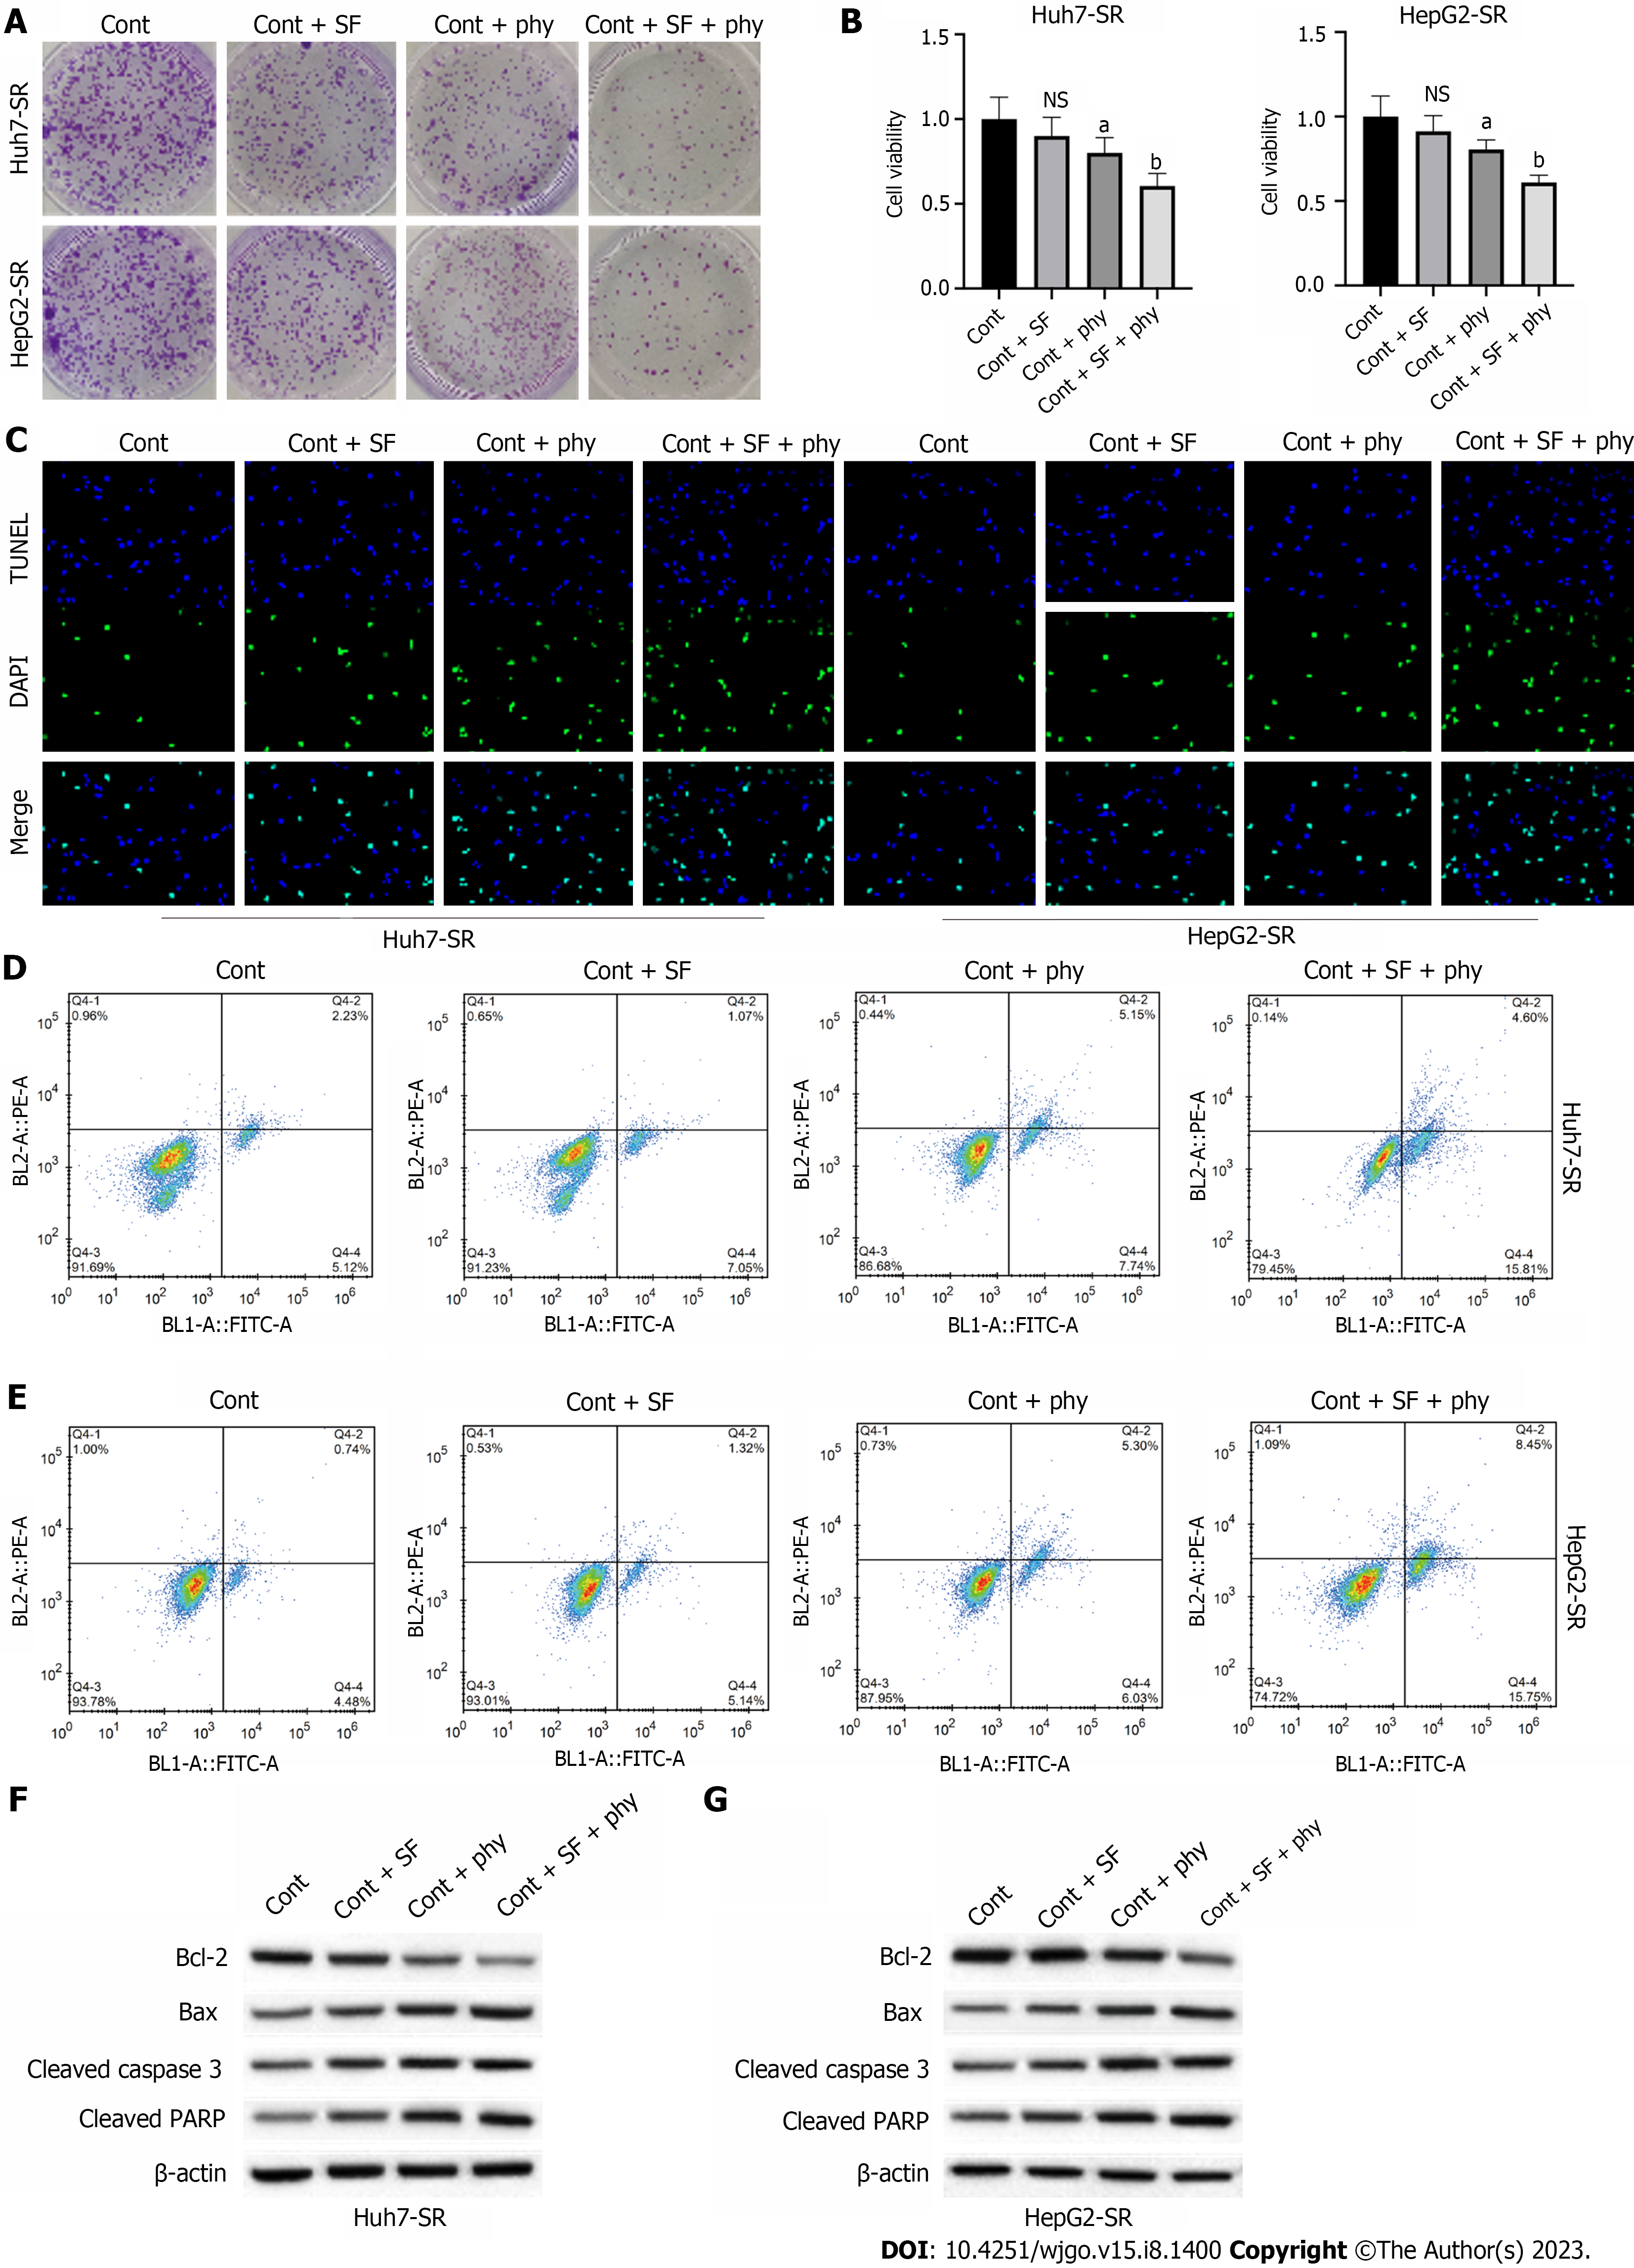
Figure 2 Physcion promotes sorafenib sensitivity of sorafenib-resistant hepatocellular carcinoma cells.
SF-resistant Huh7-SR and HepG2-SR cells were treated with physcion and/or SF. A: Cell proliferation was measured by colony formation; B: Cell viability was checked by cell counting kit 8 assay; C: TUNEL assay was conducted to measure cell apoptosis; D and E: Huh7-SR cells (D) and HepG2-SR cells (E) were labeled with Annexin V and PI and detected by flow cytometry to determine cell apoptosis; F and G: The protein levels of Bcl-2, Bax, cleaved caspase-3 and cleaved PARP in (F) Huh7-SR cells and (G) HepG2-SR cells were analyzed by western blotting. aP < 0.05 versus control (Cont) group; bP < 0.05 versus Cont + SF group. Cont: Control; SF: Sorafenib; phy: Physcion; NS: No significant.
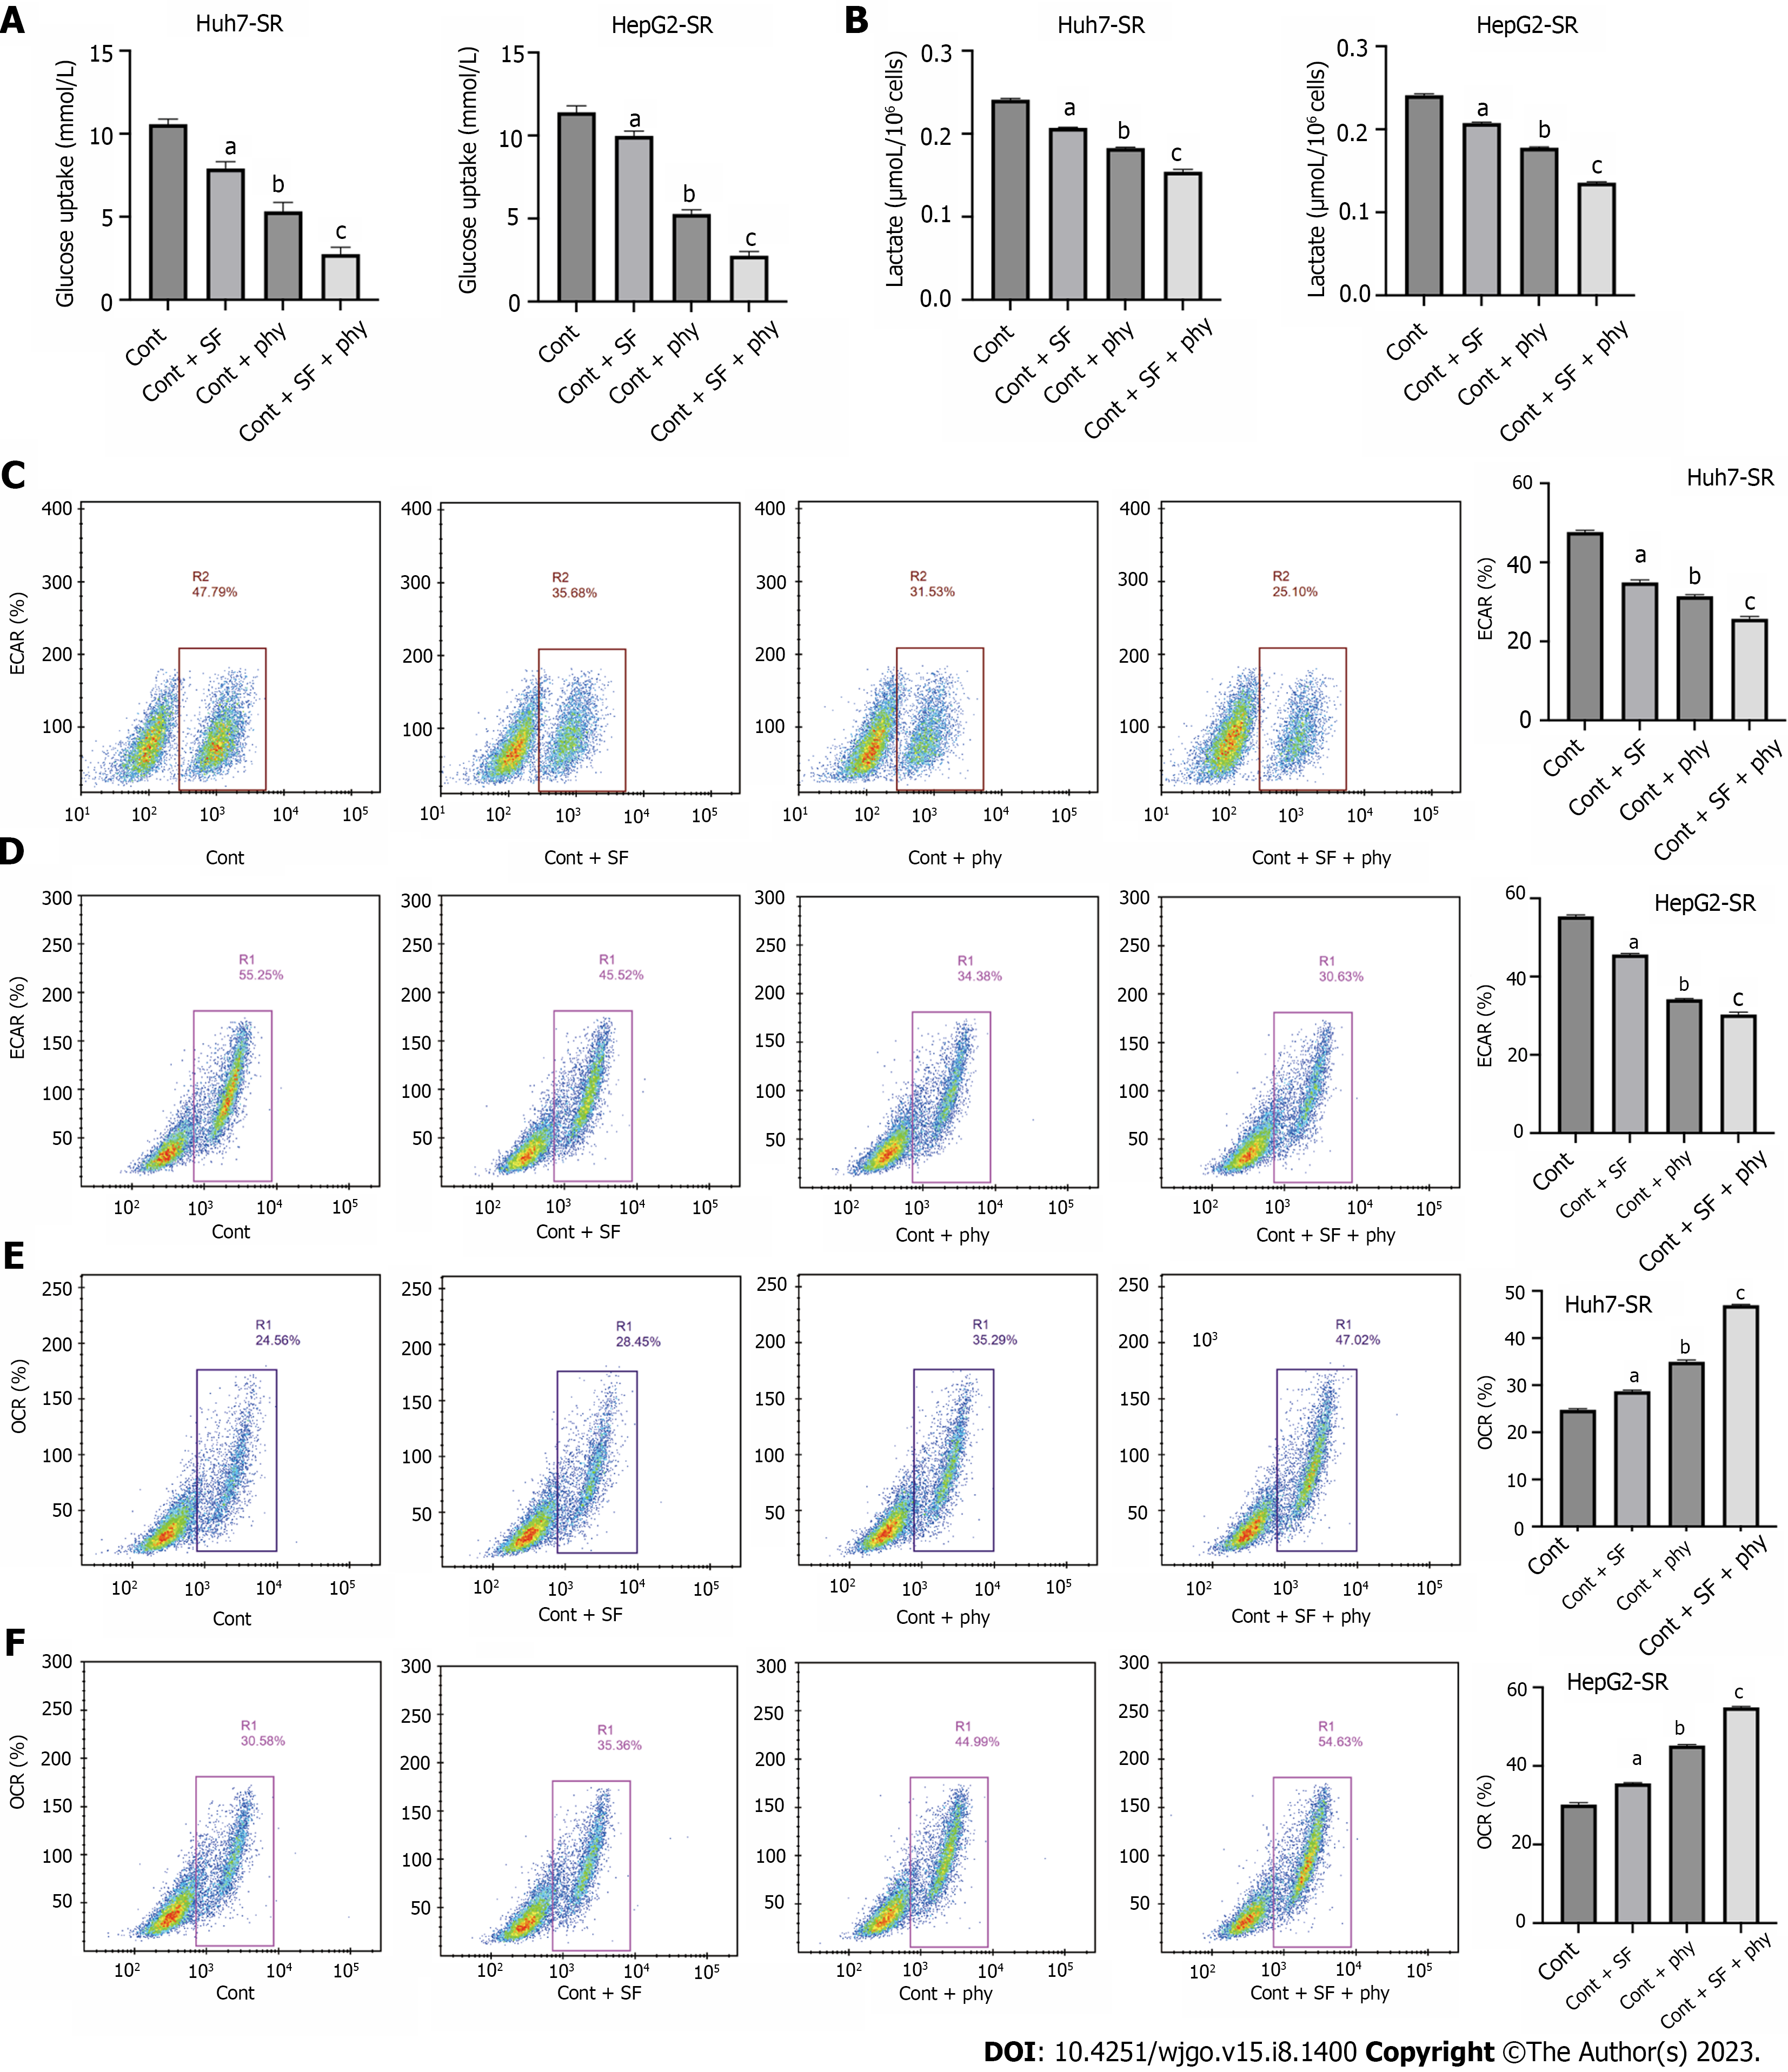
Figure 3 Physcion promotes the inhibition of sorafenib on hepatocellular carcinoma glycolysis.
The sorafenib-resistant Huh7-SR and HepG2-SR cells were treated with physcion and/or sorafenib. A-D: Glucose uptake (A), lactate production (B), extracellular acidification rate (C and D); E and F: Oxygen consumption rate. aP < 0.05, bP < 0.001 versus control (Cont) group; cP < 0.001 versus Cont + SF group. Cont: Control; SF: Sorafenib; phy: Physcion; ECAR: Extracellular acidification rate; OCR: Oxygen consumption rate.
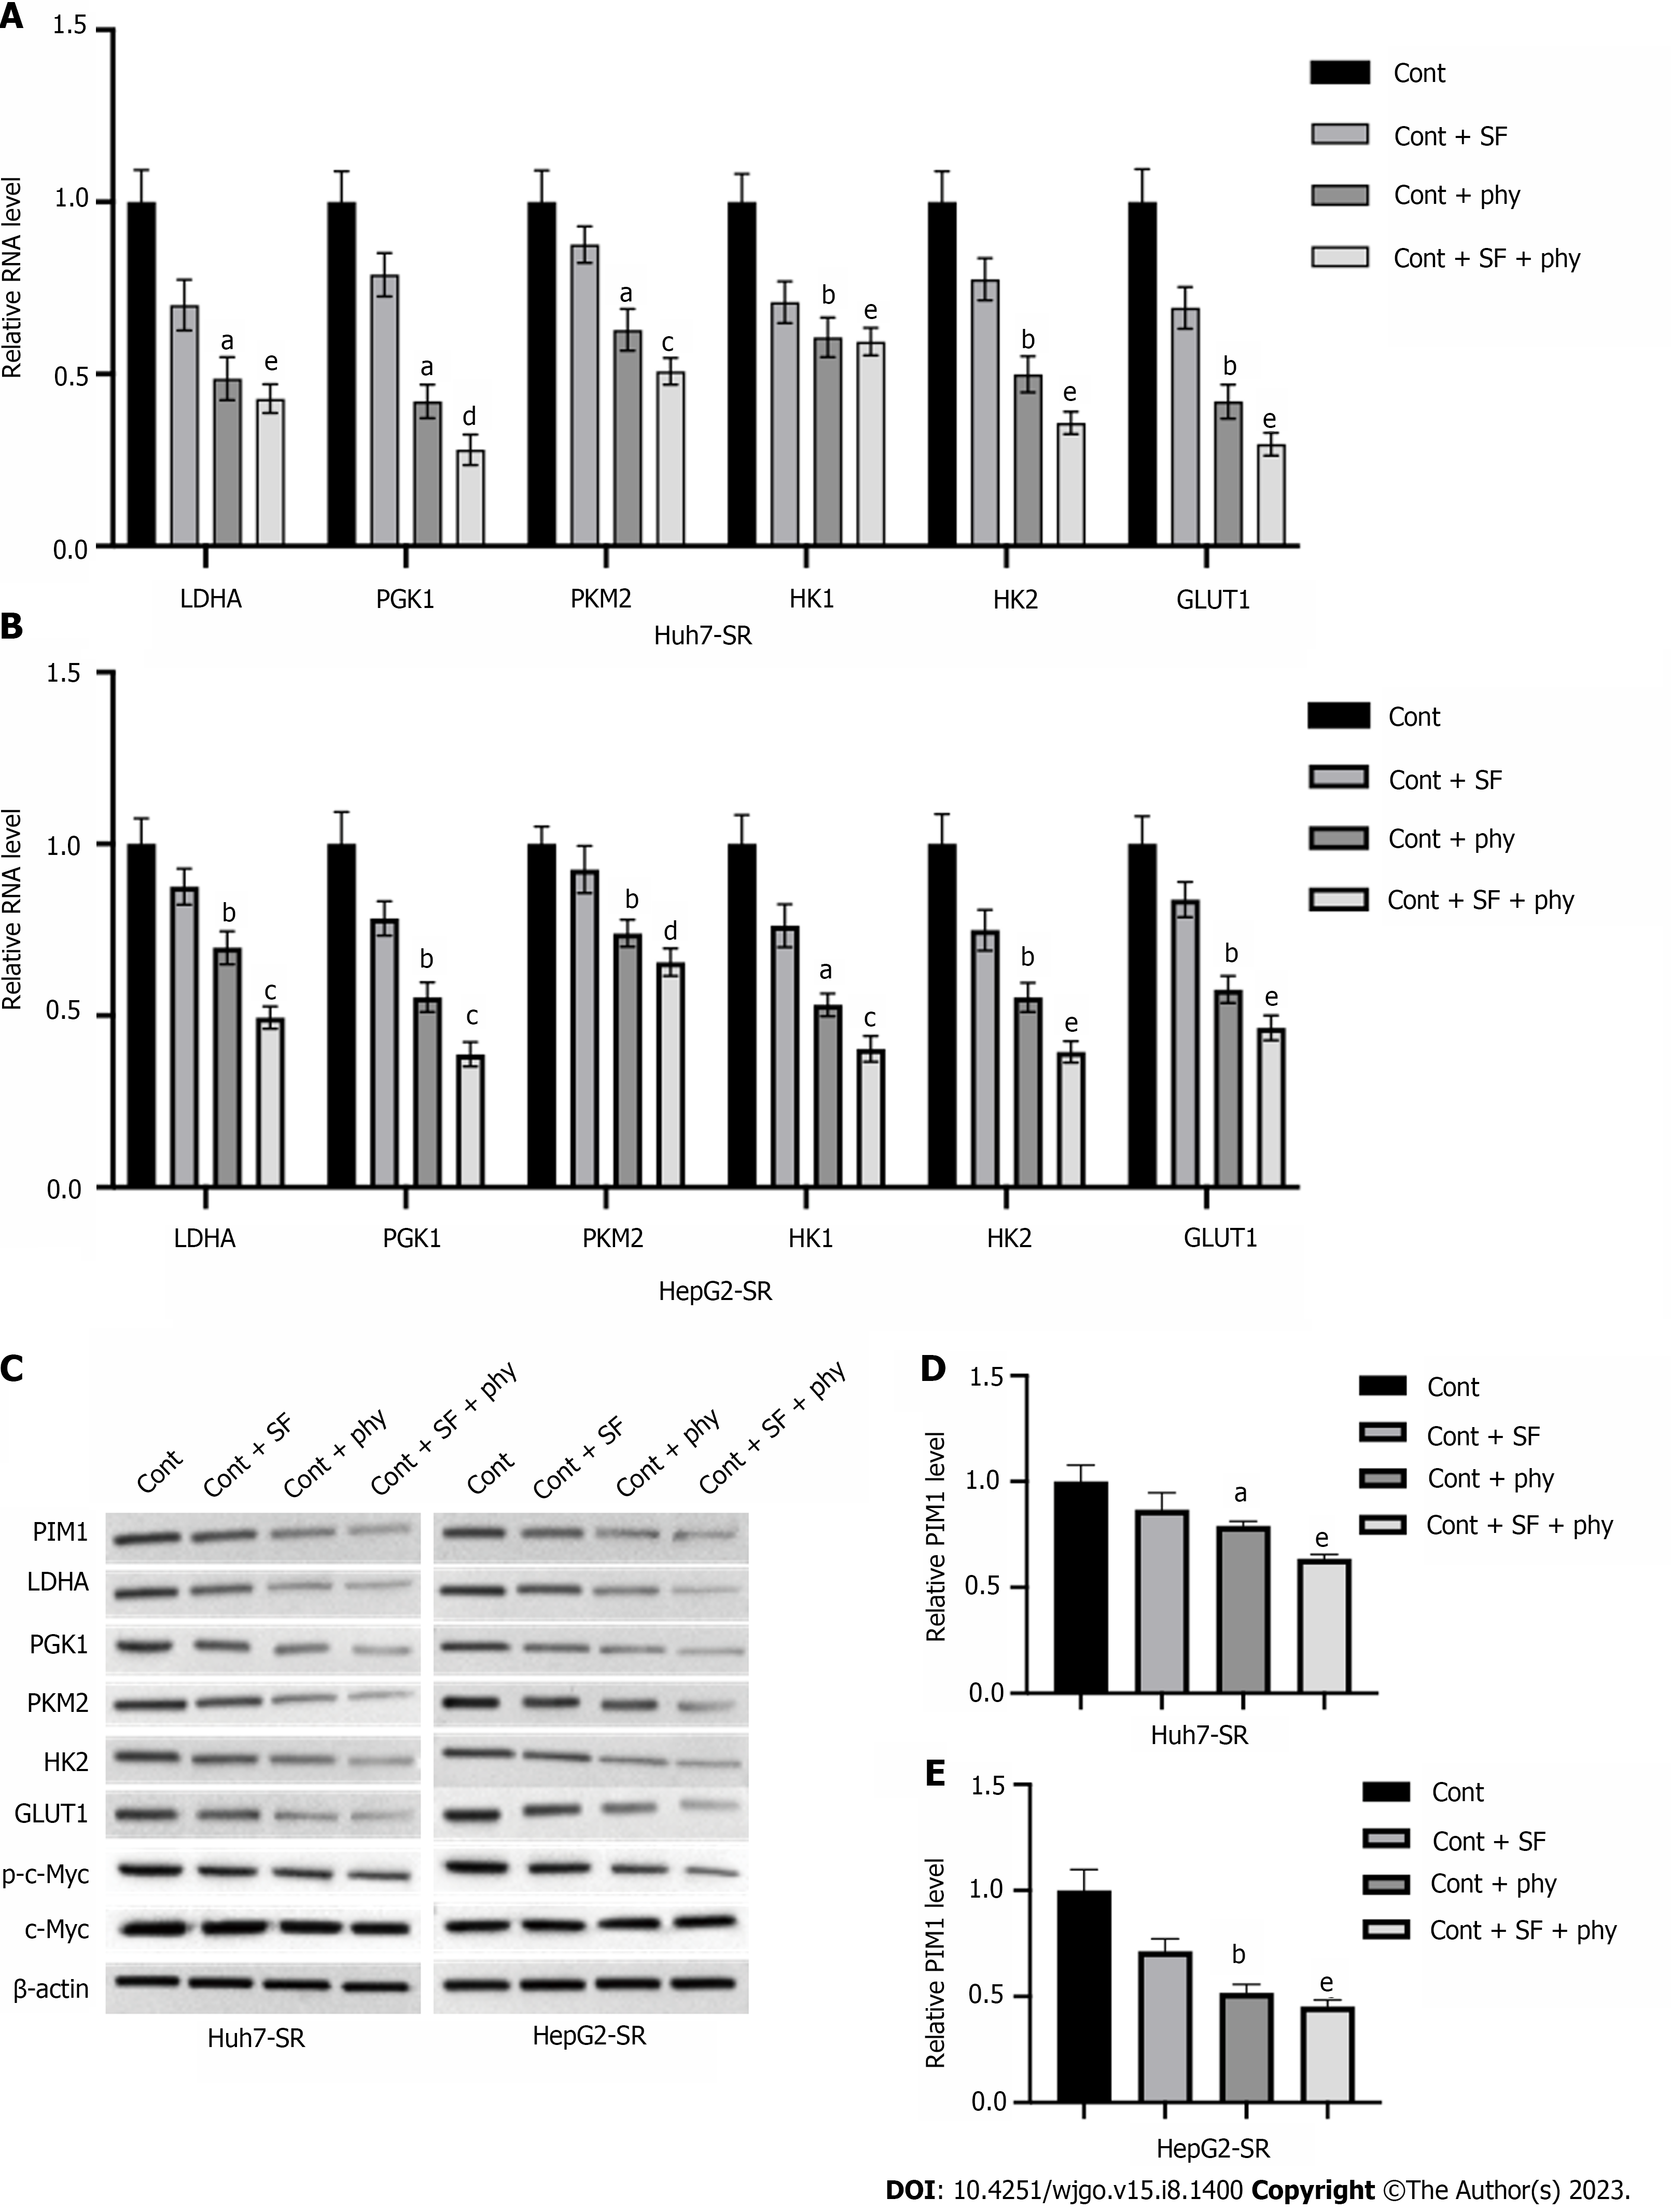
Figure 4 Physcion regulates hepatocellular carcinoma cell glycolysis via targeting PIM1.
The sorafenib-resistant Huh7-SR and HepG2-SR cells were treated with physcion and/or sorafenib. A and B: RNA levels of LDHA, PGK1, PKM2, HK1, HK2, and GLUT1 in (A) Huh7-SR and (B) HepG2-SR cells were measured by quantitative real-time polymerase chain reaction (qPCR) assay; C: The protein levels of PIM1, LDHA, PGK1, PKM2, HK1, HK2, GLUT1, c-Myc, and phosphorylated c-Myc in cells were measured by qPCR assay; D and E: The RNA level of PIM1 in (D) Huh7-SR and (E) HepG2-SR cells were measured by qPCR assay. aP < 0.01, bP < 0.001 versus control (Cont) group; cP < 0.05, dP < 0.01, eP < 0.001 versus Cont + SF group. qPCR: Quantitative polymerase chain reaction; Cont: Control; SF: Sorafenib; phy: Physcion.
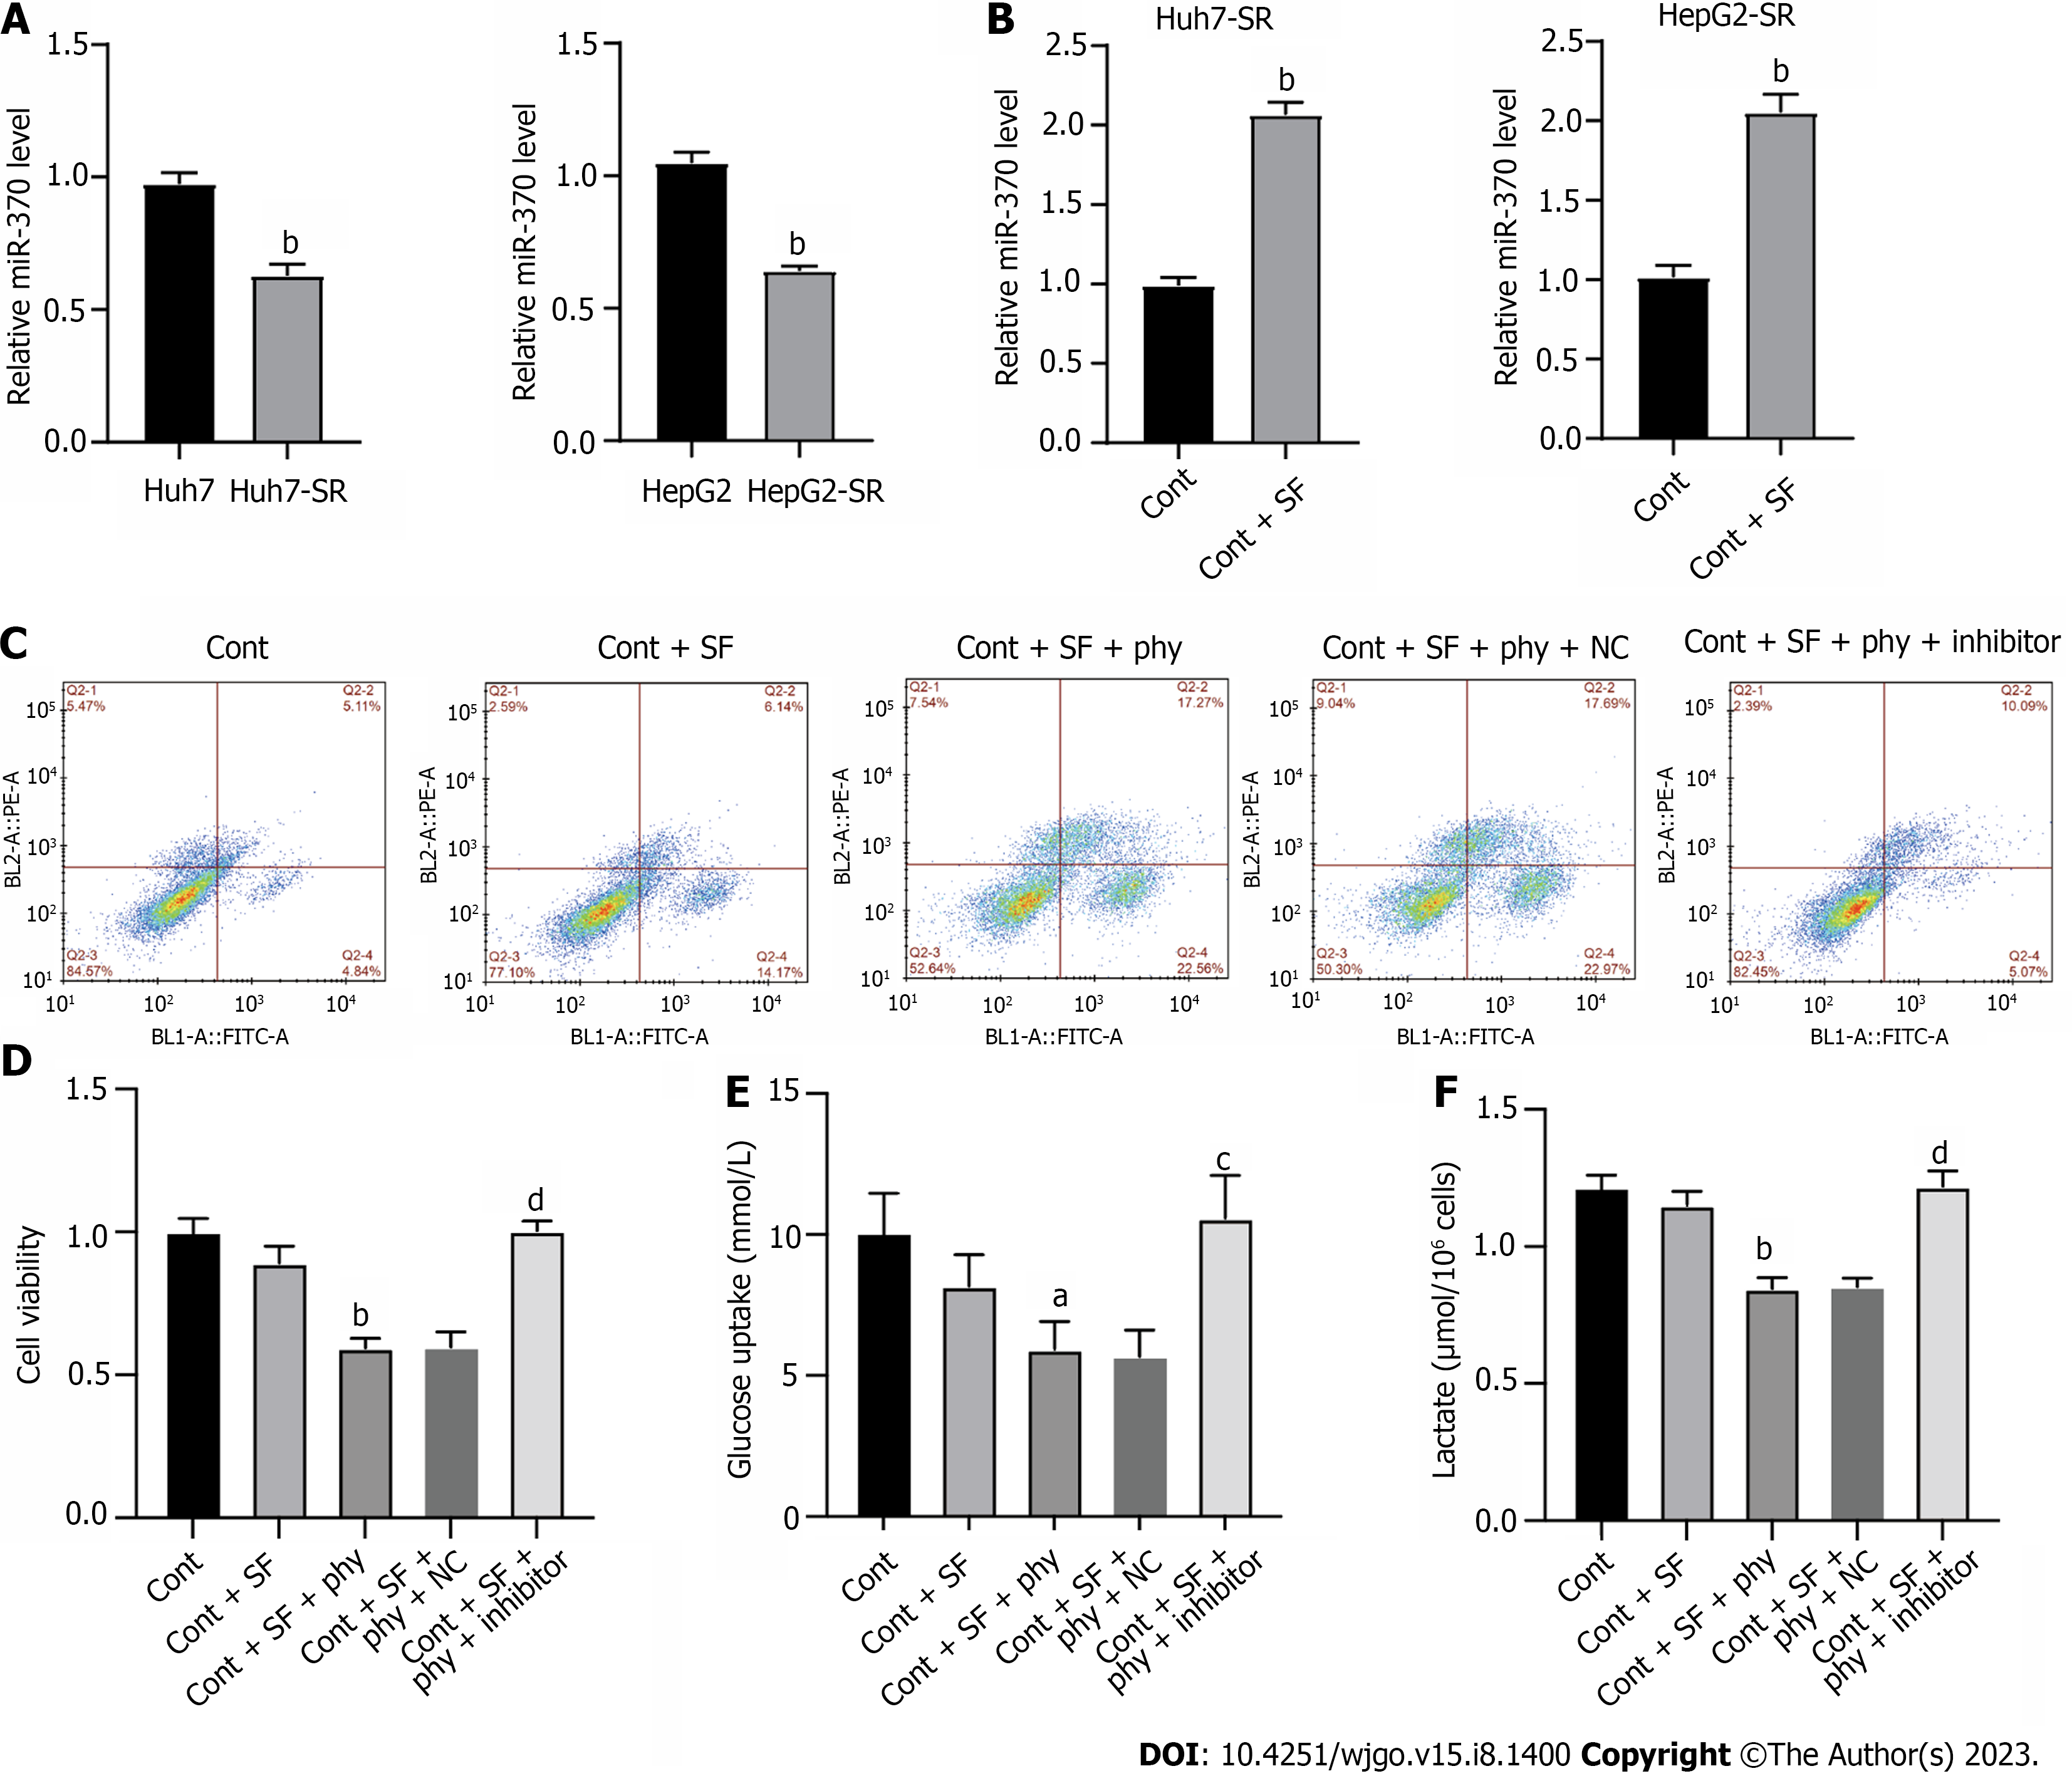
Figure 5 Physcion regulates the miR-370 to suppress PIM1 expression in sorafenib-resistant hepatocellular carcinoma cells.
The sorafenib-resistant Huh7-SR and HepG2-SR cells were treated with physcion and/or sorafenib and transfected with miR-370 inhibitors (inhibitor). A and B: The level of miR-370 was checked by quantitative real-time polymerase chain reaction; C: Cell apoptosis was checked by flow cytometry; D: Cell viability was checked by cell counting kit 8 assay; E and F: The (E) glucose uptake and (F) lactate production were measured. aP < 0.05, bP < 0.001 versus control (Cont), Huh7, or HepG2 group; cP < 0.05, dP < 0.001 versus Cont + SF + phy group. Cont: Control; SF: Sorafenib; phy: Physcion.
- Citation: Pan XP, Jiya BR, Wang F, Lan Z. Physcion increases the sensitivity of hepatocellular carcinoma to sorafenib through miRNA-370/PIM1 axis-regulated glycolysis. World J Gastrointest Oncol 2023; 15(8): 1400-1411
- URL: https://www.wjgnet.com/1948-5204/full/v15/i8/1400.htm
- DOI: https://dx.doi.org/10.4251/wjgo.v15.i8.1400


