Copyright
©The Author(s) 2023.
World J Gastrointest Oncol. Aug 15, 2023; 15(8): 1366-1383
Published online Aug 15, 2023. doi: 10.4251/wjgo.v15.i8.1366
Published online Aug 15, 2023. doi: 10.4251/wjgo.v15.i8.1366
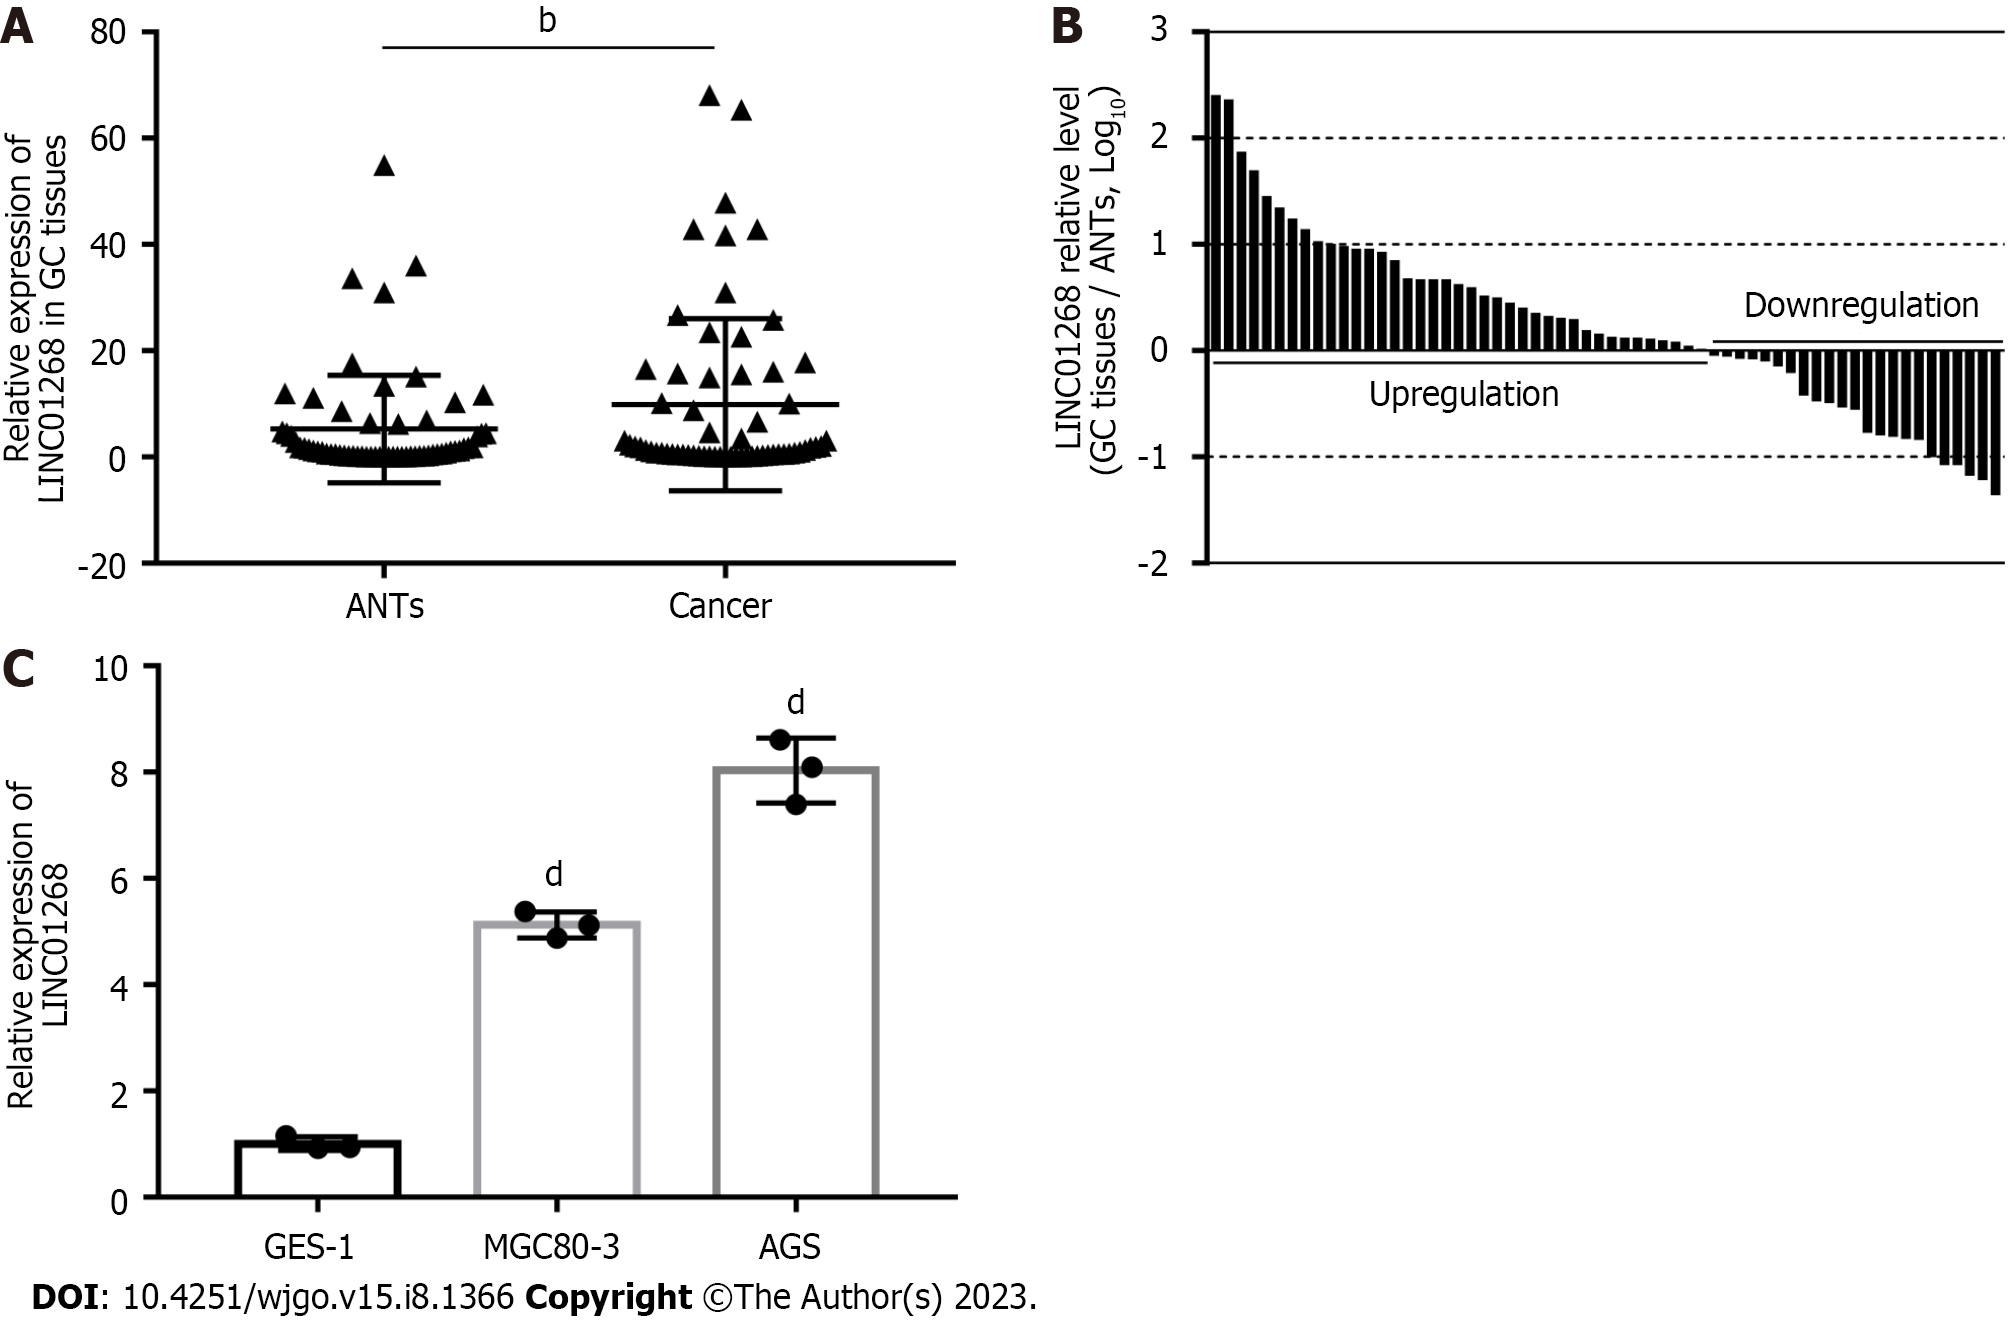
Figure 1 Relative expression level of LINC01268 in gastric cancer.
A: The relative expression level of LINC01268 in 62 cases of gastric cancer (GC) tissues was higher than that of adjacent noncancerous tissues (ANTs). Expression levels were normalized to ACTB levels; B: The expression level of LINC01268 was up-regulated in 39 GC tissues and down-regulated in 23 GC tissues [bars represent the ratio between the expression levels in GC tissues and ANTs (C/N, log scale) from the 62 patients]; C: The relative expression levels of LINC01268 in GC cell lines MGC80-3 and AGS were higher than those in normal gastric mucosa epithelial cell line GES-1. Expression levels were normalized to GAPDH levels. The results were shown as the mean ± SD. bP < 0.01, dP < 0.0001. GC: Gastric cancer; ANT: Adjacent noncancerous tissue.
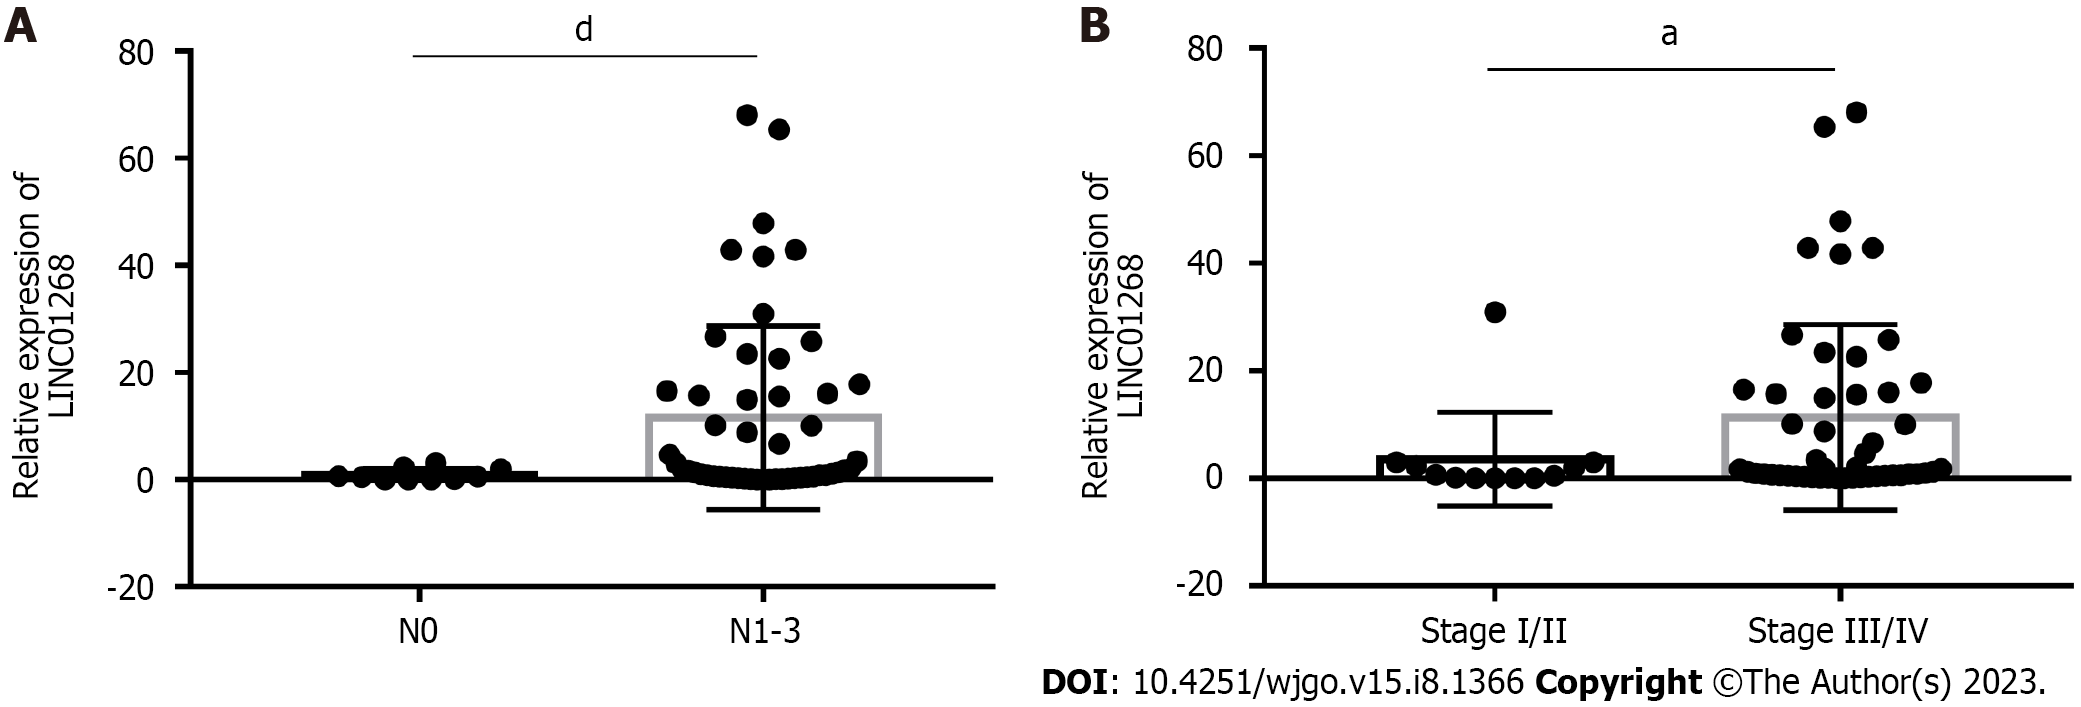
Figure 2 The relative expression of LINC01268 in gastric cancer tissues was compared according to the clinicopathological chara
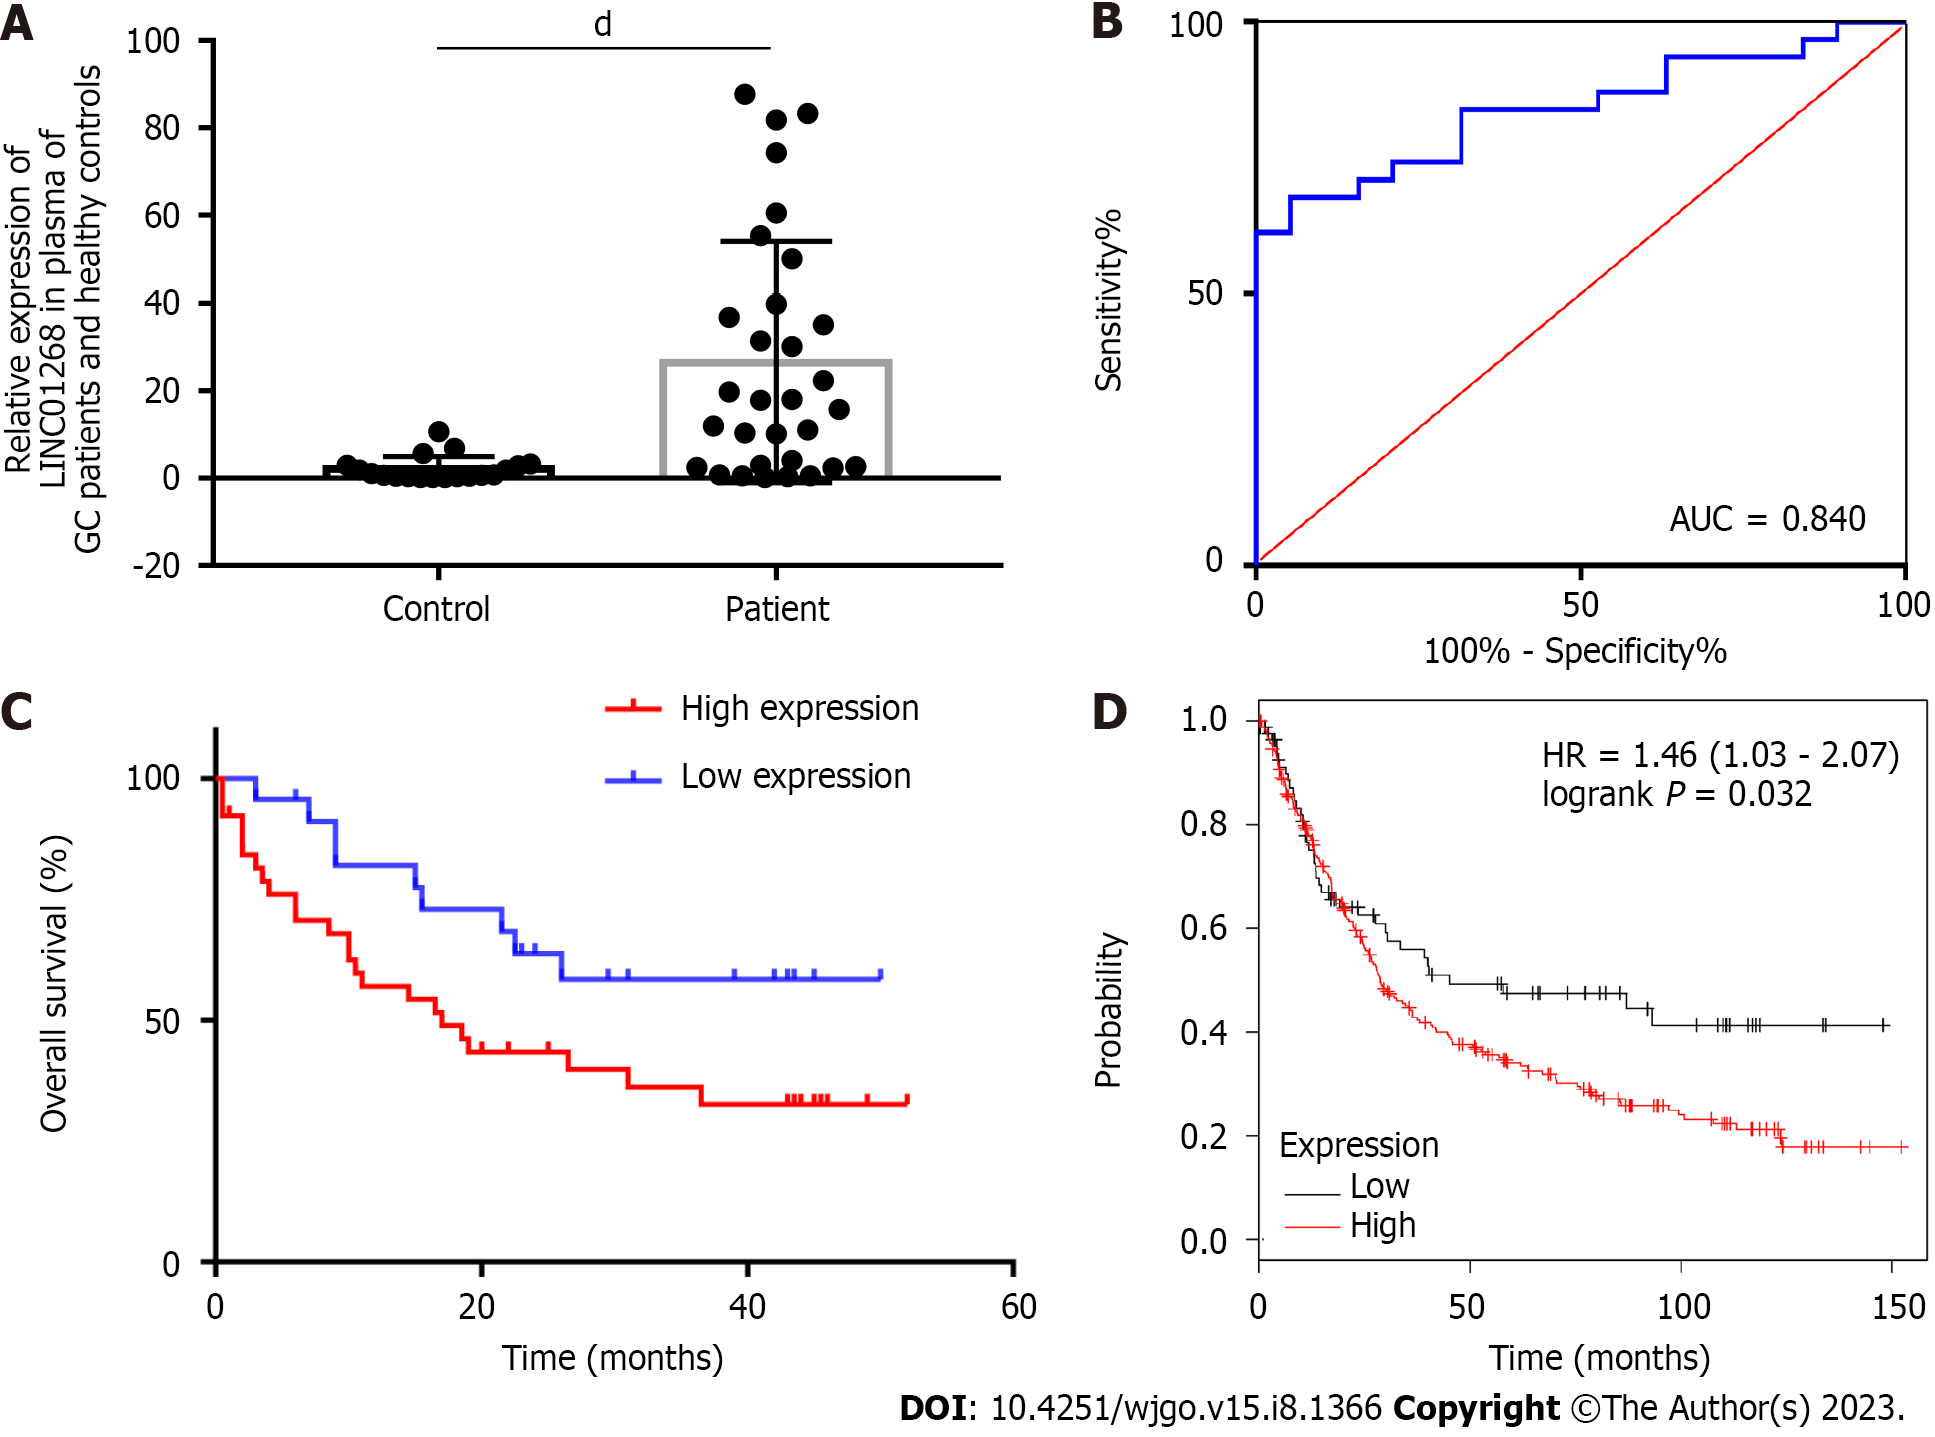
Figure 3 The value of LINC01268 in auxiliary diagnosis and prognostic evaluation of gastric cancer.
A: The expression level of LINC01268 in preoperative plasma of 31 patients with gastric cancer (GC) was higher than that of 19 healthy controls. Expression levels were normalized to the ACTB levels. The results were shown as the mean ± SD; B: Construction of receiver operating characteristic curve of LINC01268 expression level in plasma for diagnosis of GC, area under the curve = 0.840 (95% confidence interval: 0.733-0.948, P < 0.0001); C: The prognosis of 39 patients with high expression of LINC01268 was worse than that of 23 patients with low expression (Log-rank P = 0.047); D: The prognosis of 262 GC patients with high expression of LINC01268 in the online database Kaplan-Meier plotter was worse than that of 86 patients with low expression of LINC01268 (Log-rank P = 0.032). dP < 0.0001. AUC: Area under the curve; HR: Hazard ratio.
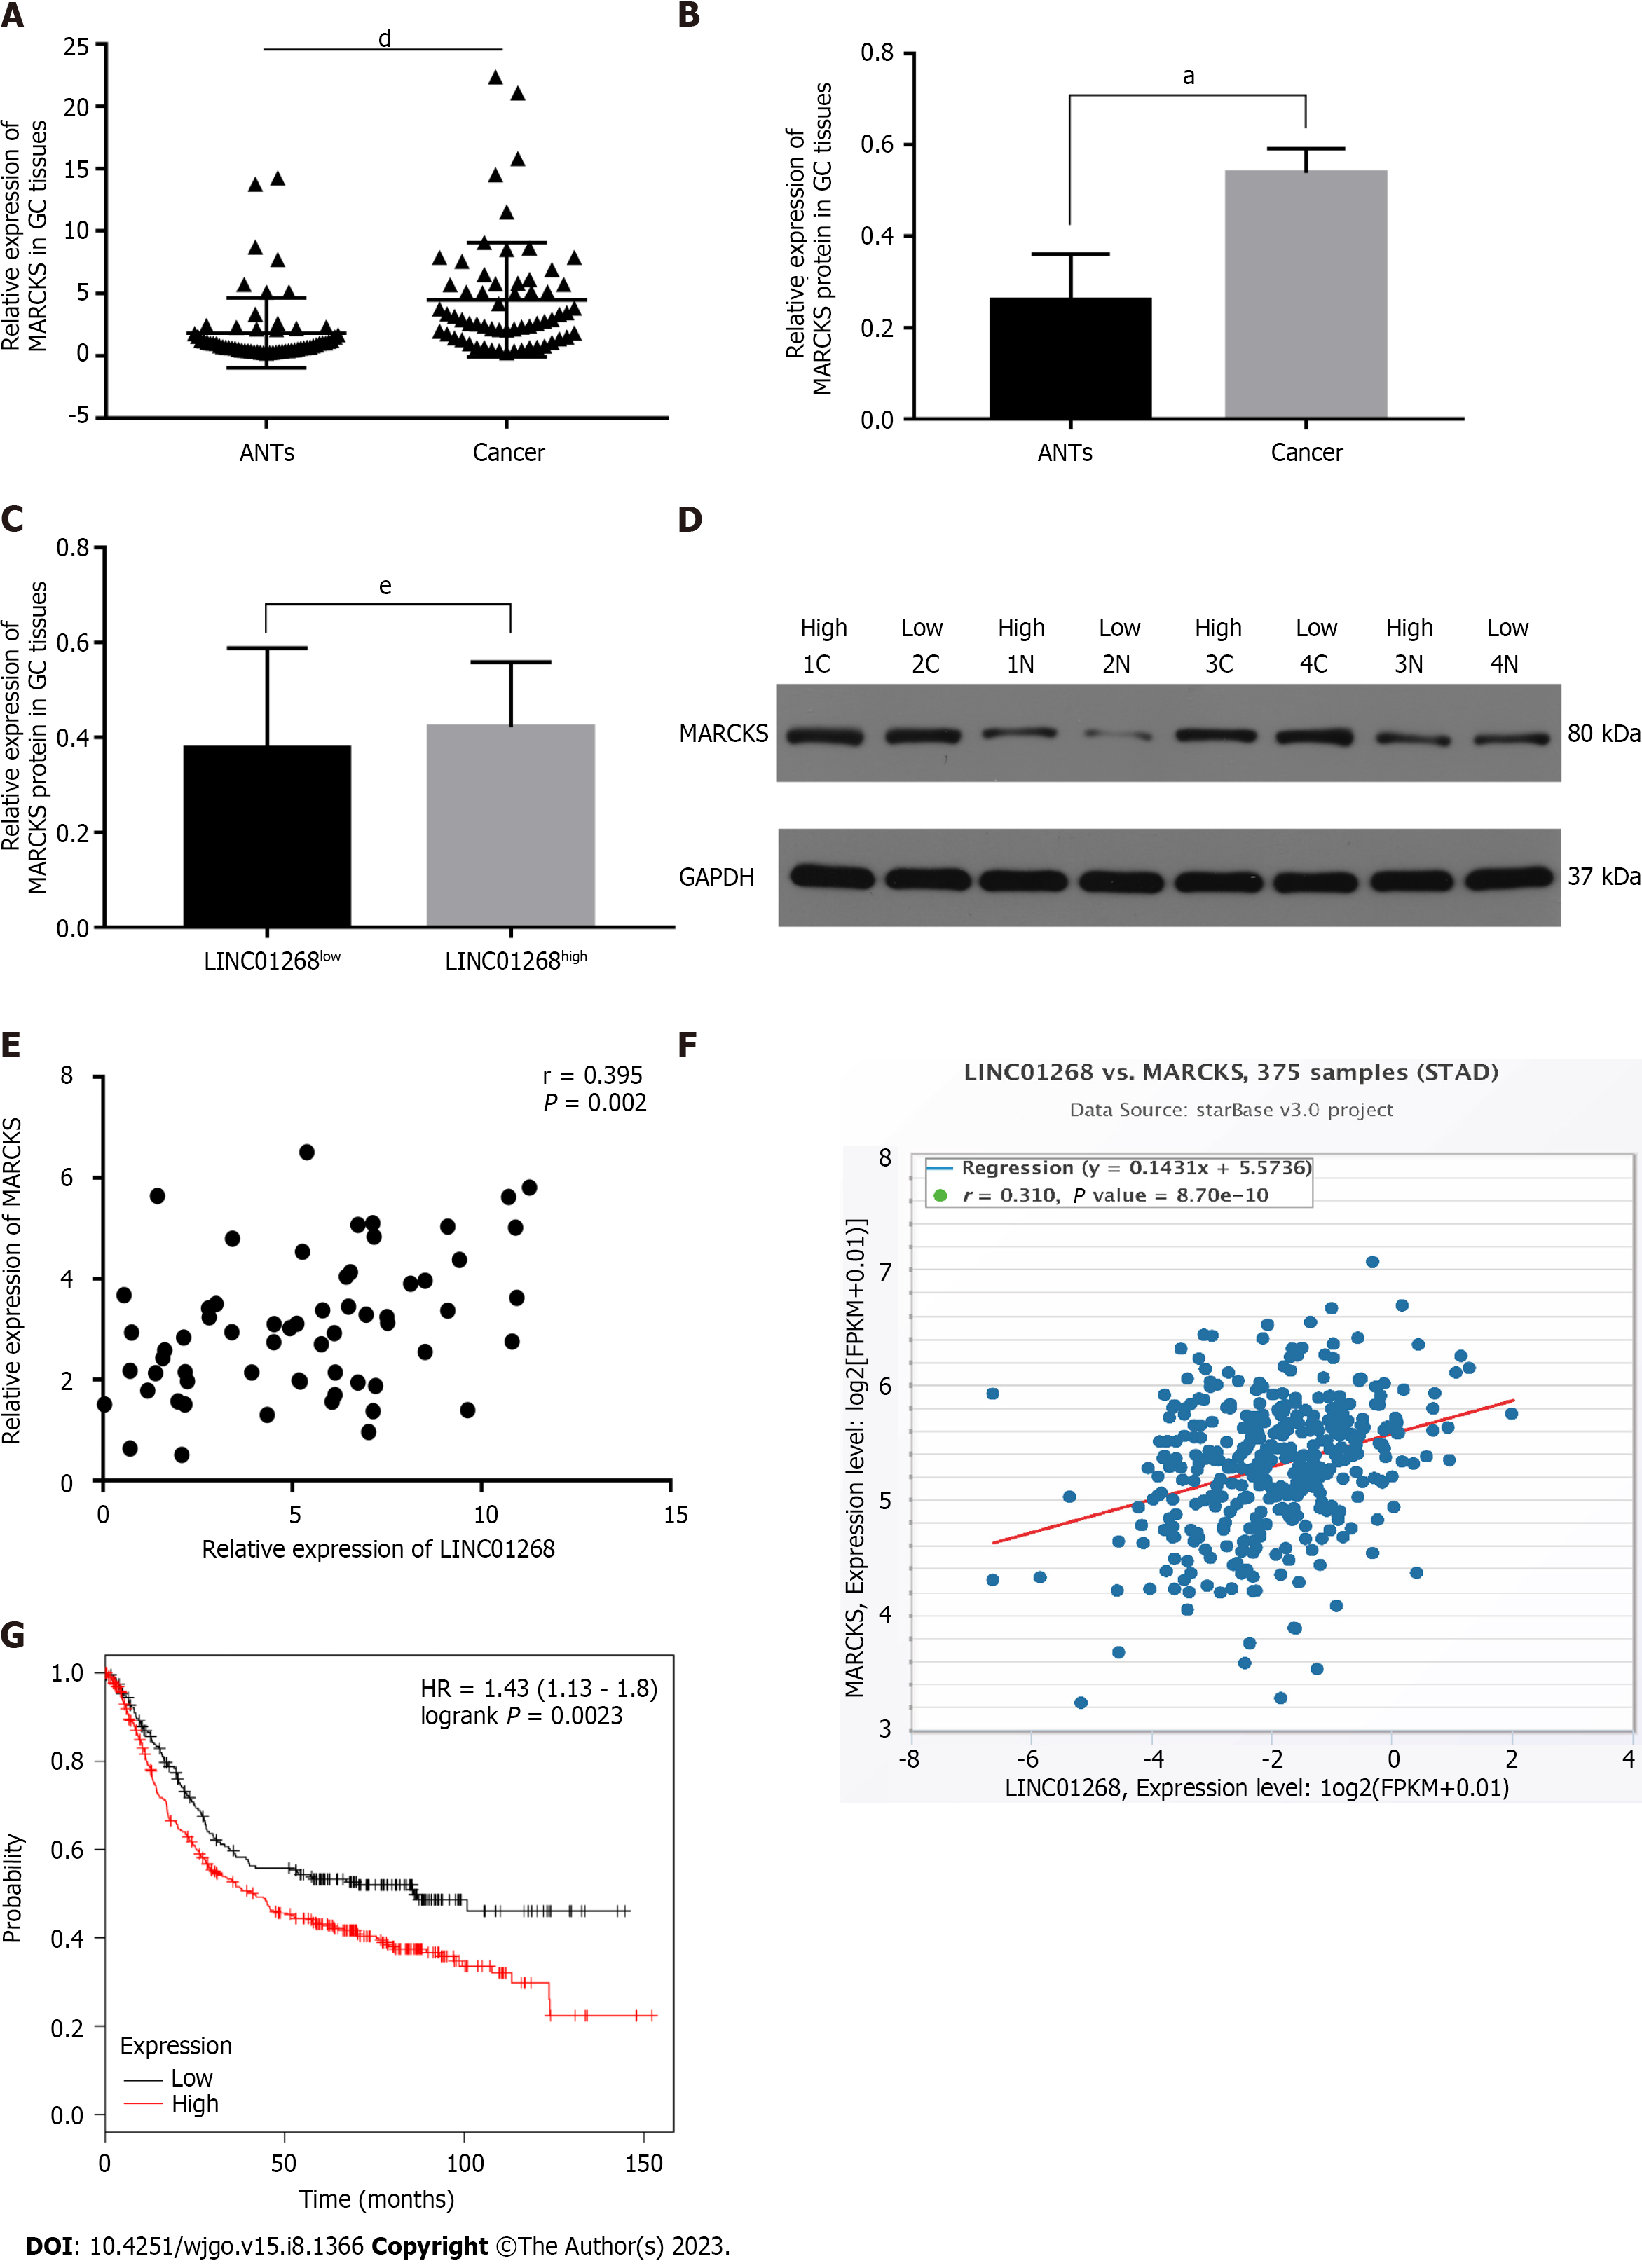
Figure 4 The expression level of myristoylated alanine rich protein kinase C substrate in gastric cancer and its relationship with LINC01268.
A: The relative mRNA expression level of myristoylated alanine rich protein kinase C substrate (MARCKS) in 62 cases of gastric cancer (GC) tissues was significantly higher than that of paired adjacent noncancerous tissue (ANTs). Expression levels were normalized to the ACTB levels. The results were shown as the mean ± SD; B: The protein levels of MARCKS in 4 pairs of GC tissues were significantly higher than those in paired ANTs. Expression levels were normalized to GAPDH levels. The results were shown as the mean ± SD; C: The protein levels of MARCKS in LINC01268 high expression groups were not higher than those in the LINC01268 low expression groups; D: Western blot detected the MARCKS protein expression of 4 pairs of GC tissues (C) and ANTs (N); E: The mRNA expression levels of MARCKS and LINC01268 in 62 cases of GC were positively correlated (r = 0.395, P = 0.002); F: LINC01268 and MARCKS showed a positive correlation in 375 GC samples in the starBase online database (r = 0.310, P < 0.0001); G: In Kaplan-Meier plotter online database, the prognosis and survival of 392 GC patients with high expression of MARCKS were worse than 239 GC patients with relatively low expression of MARCKS (log-rank P = 0.0023). aP < 0.05, dP < 0.0001, eP > 0.05. MARCKS: Myristoylated alanine rich protein kinase C substrate; GC: Gastric cancer; ANT: Adjacent noncancerous tissue; HR: Hazard ratio.
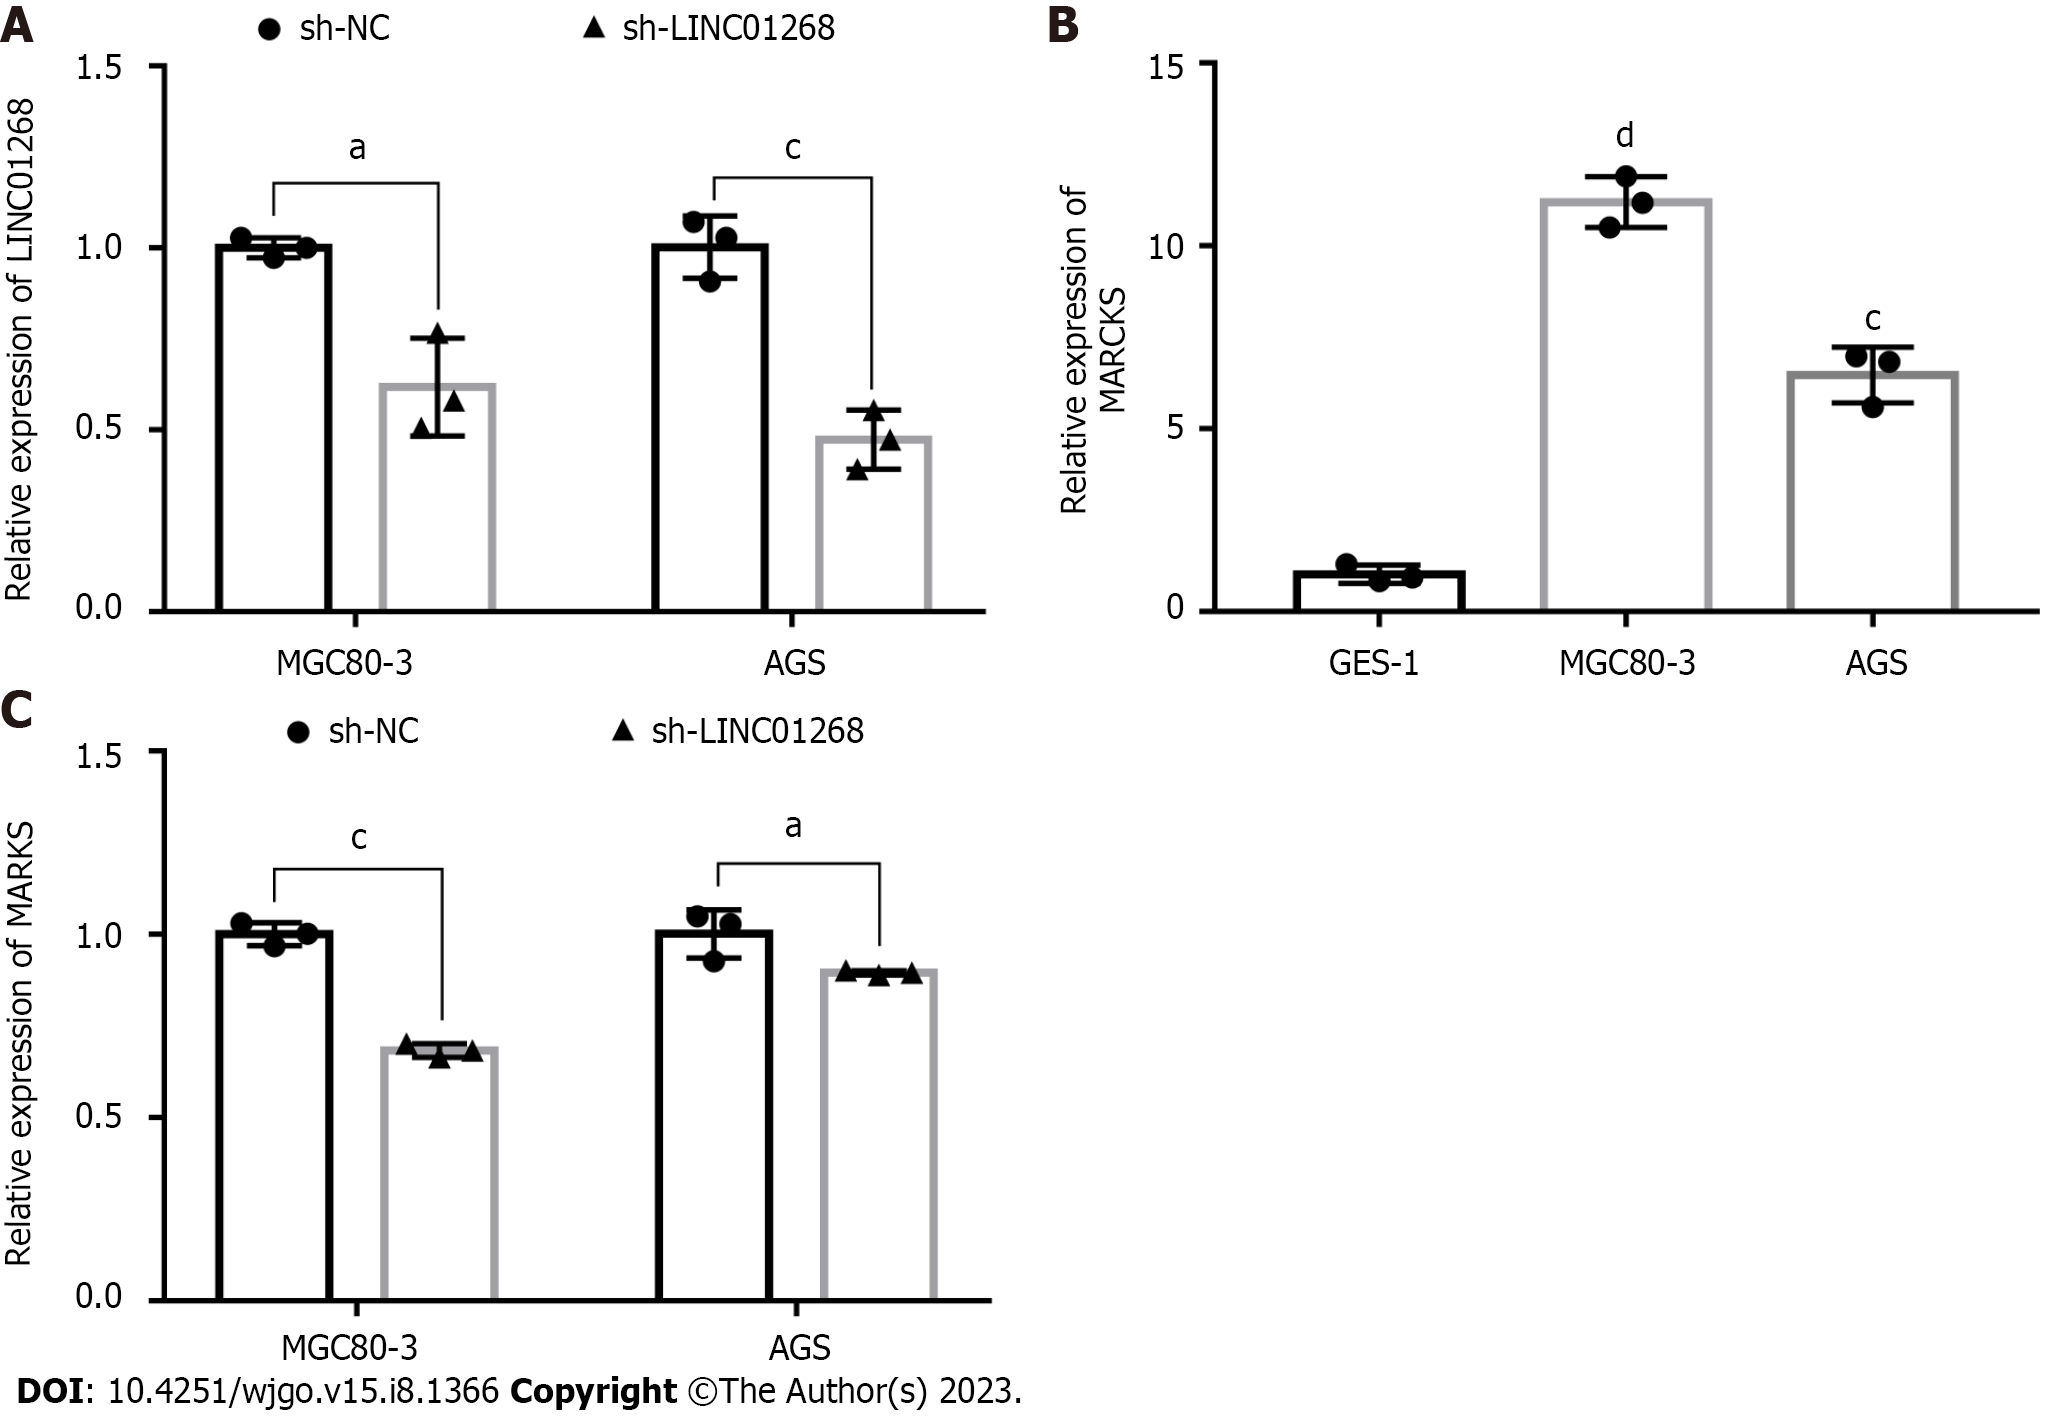
Figure 5 Expression of myristoylated alanine rich protein kinase C substrate in gastric cancer cells and changes after knocking down LINC01268.
A: After transfection with sh-LINC01268, the expression of LINC01268 in MGC80-3 and AGS decreased significantly; B: The relative expression levels of myristoylated alanine rich protein kinase C substrate (MARCKS) mRNA in gastric cancer cell lines MGC80-3 and AGS were higher than that in GES-1; C: After down-regulating the expression of LINC01268 in MGC80-3 and AGS, the expression level of MARCKS mRNA was significantly reduced. Expression levels were normalized to GAPDH levels. The results were shown as the mean ± SD. aP < 0.05, cP < 0.001, dP < 0.0001. MARCKS: Myristoylated alanine rich protein kinase C substrate; sh-NC: sh-negative control.
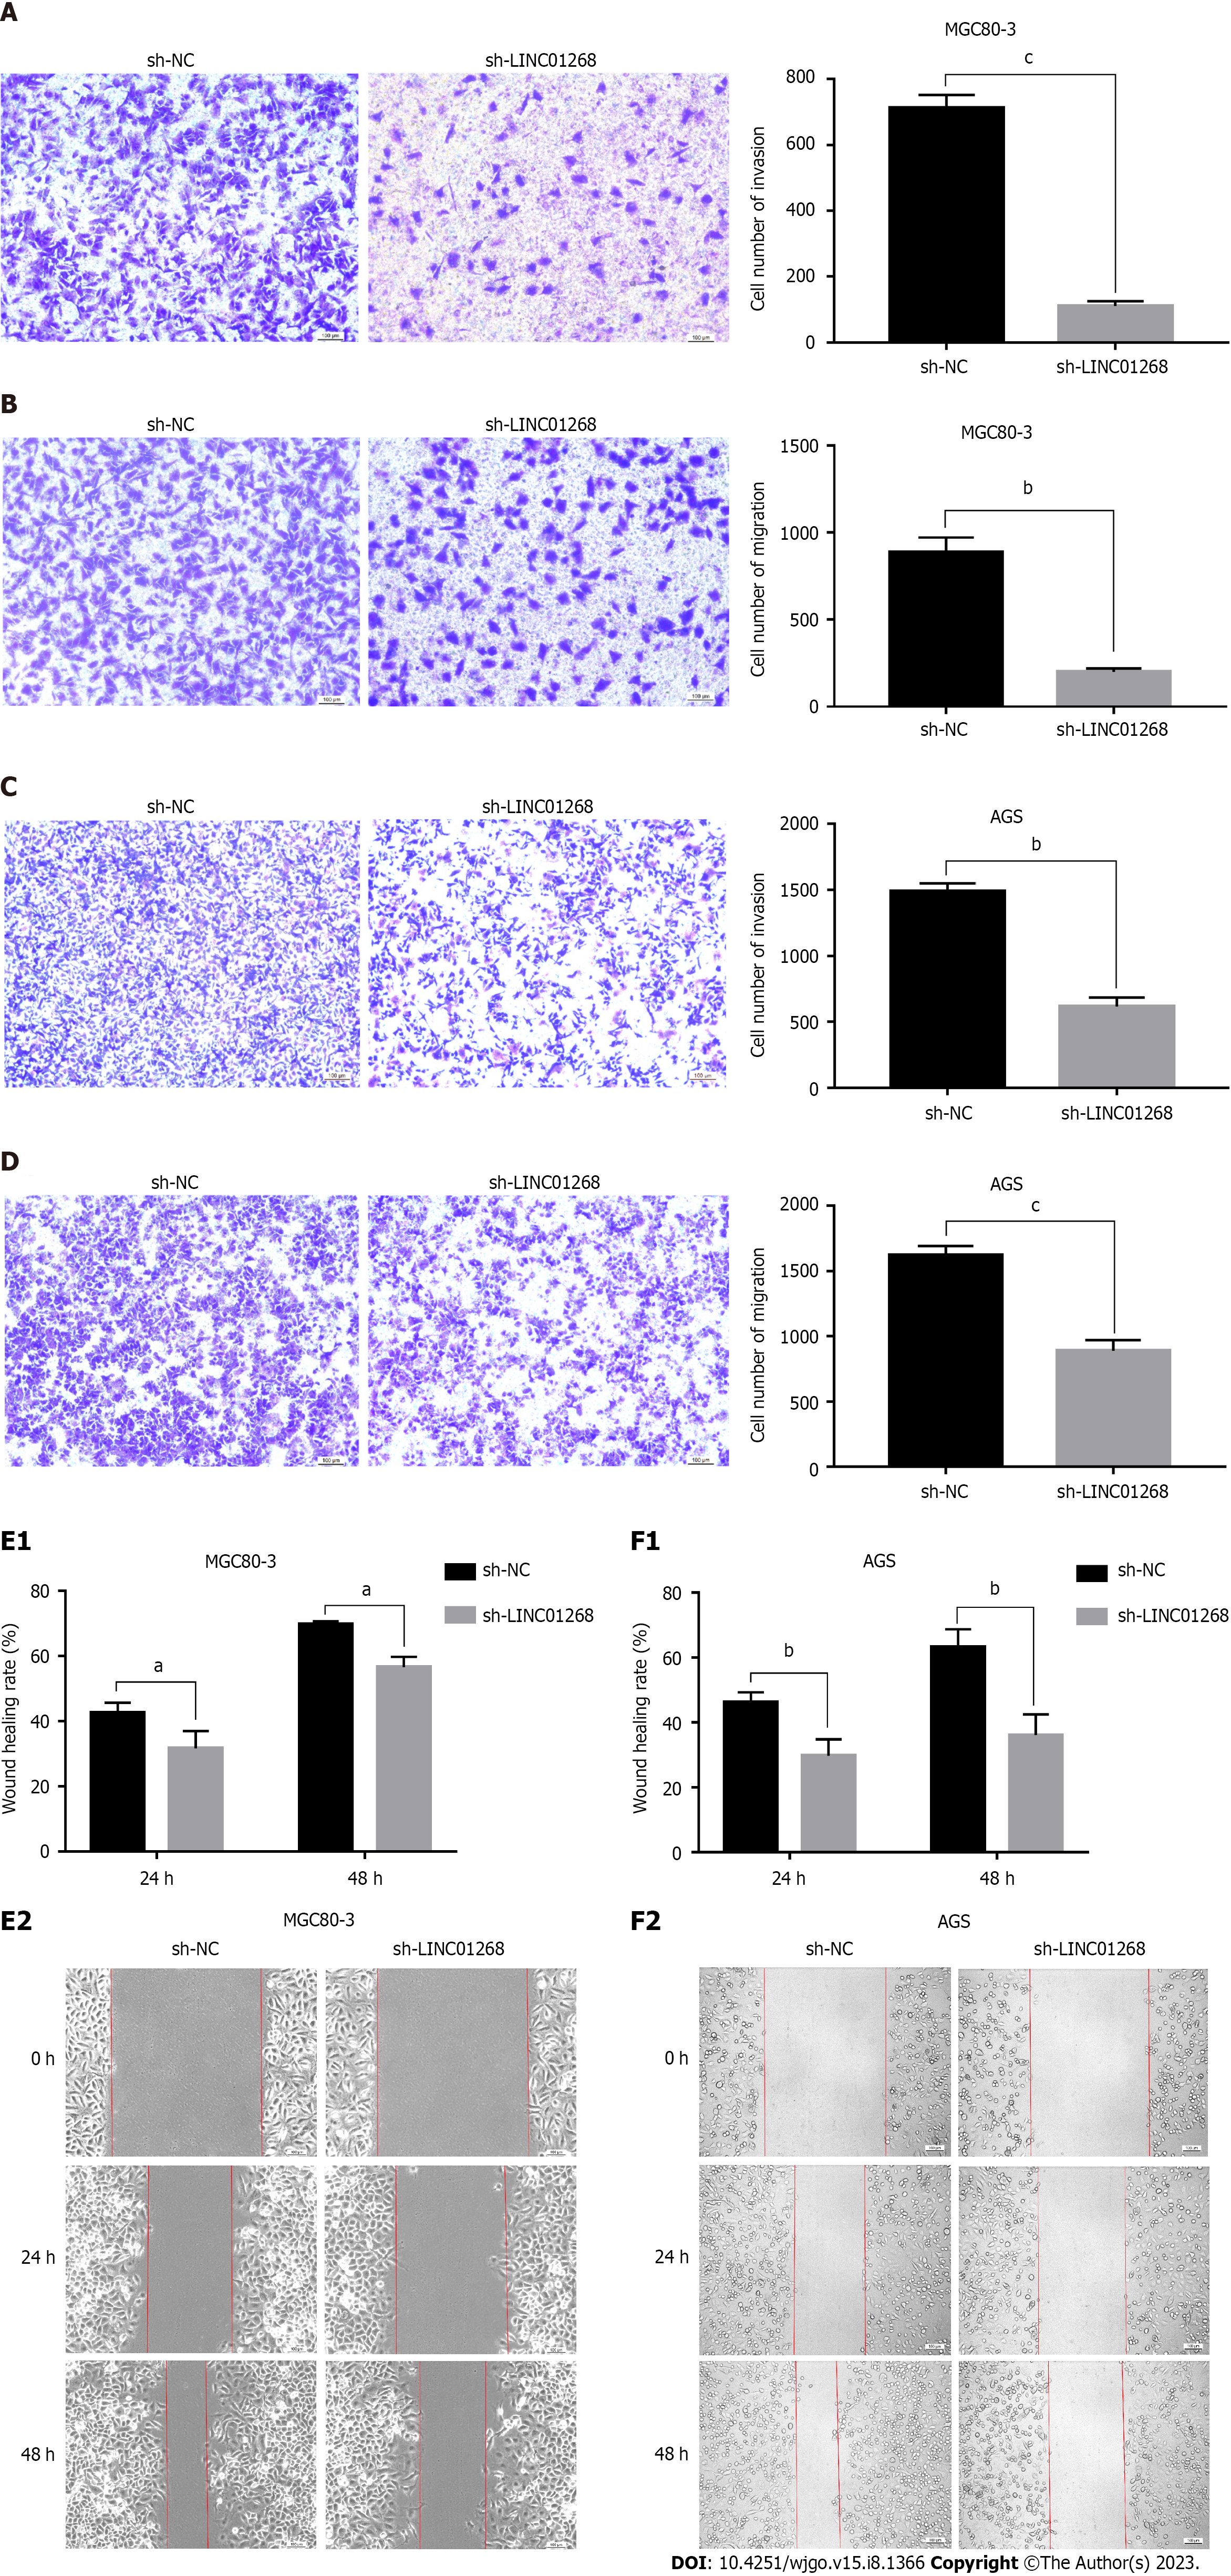
Figure 6 Comparison of the invasion and migration ability of gastric cancer cells after down-regulation of LINC01268.
A: The invasive ability of MGC80-3 in the sh-LINC01268 group was significantly weaker than that in the sh-negative control (sh-NC) group; B: The migration ability of MGC80-3 in the sh-LINC01268 group was significantly weaker than that in the sh-NC group; C: The invasive ability of AGS in the sh-LINC01268 group was significantly weaker than that in the sh-NC group; D: The migration ability of AGS in the sh-LINC01268 group was significantly weaker than that in the sh-NC group; E: After knocking down the expression of LINC01268 in MGC80-3, the cell migration ability was significantly weakened; F: After knocking down the expression of LINC01268 in AGS, the cell migration ability was significantly weakened. All the experiments were performed in triplicate. The results were shown as the mean ± SD. aP < 0.05, bP < 0.01, cP < 0.001. sh-NC: sh-negative control.
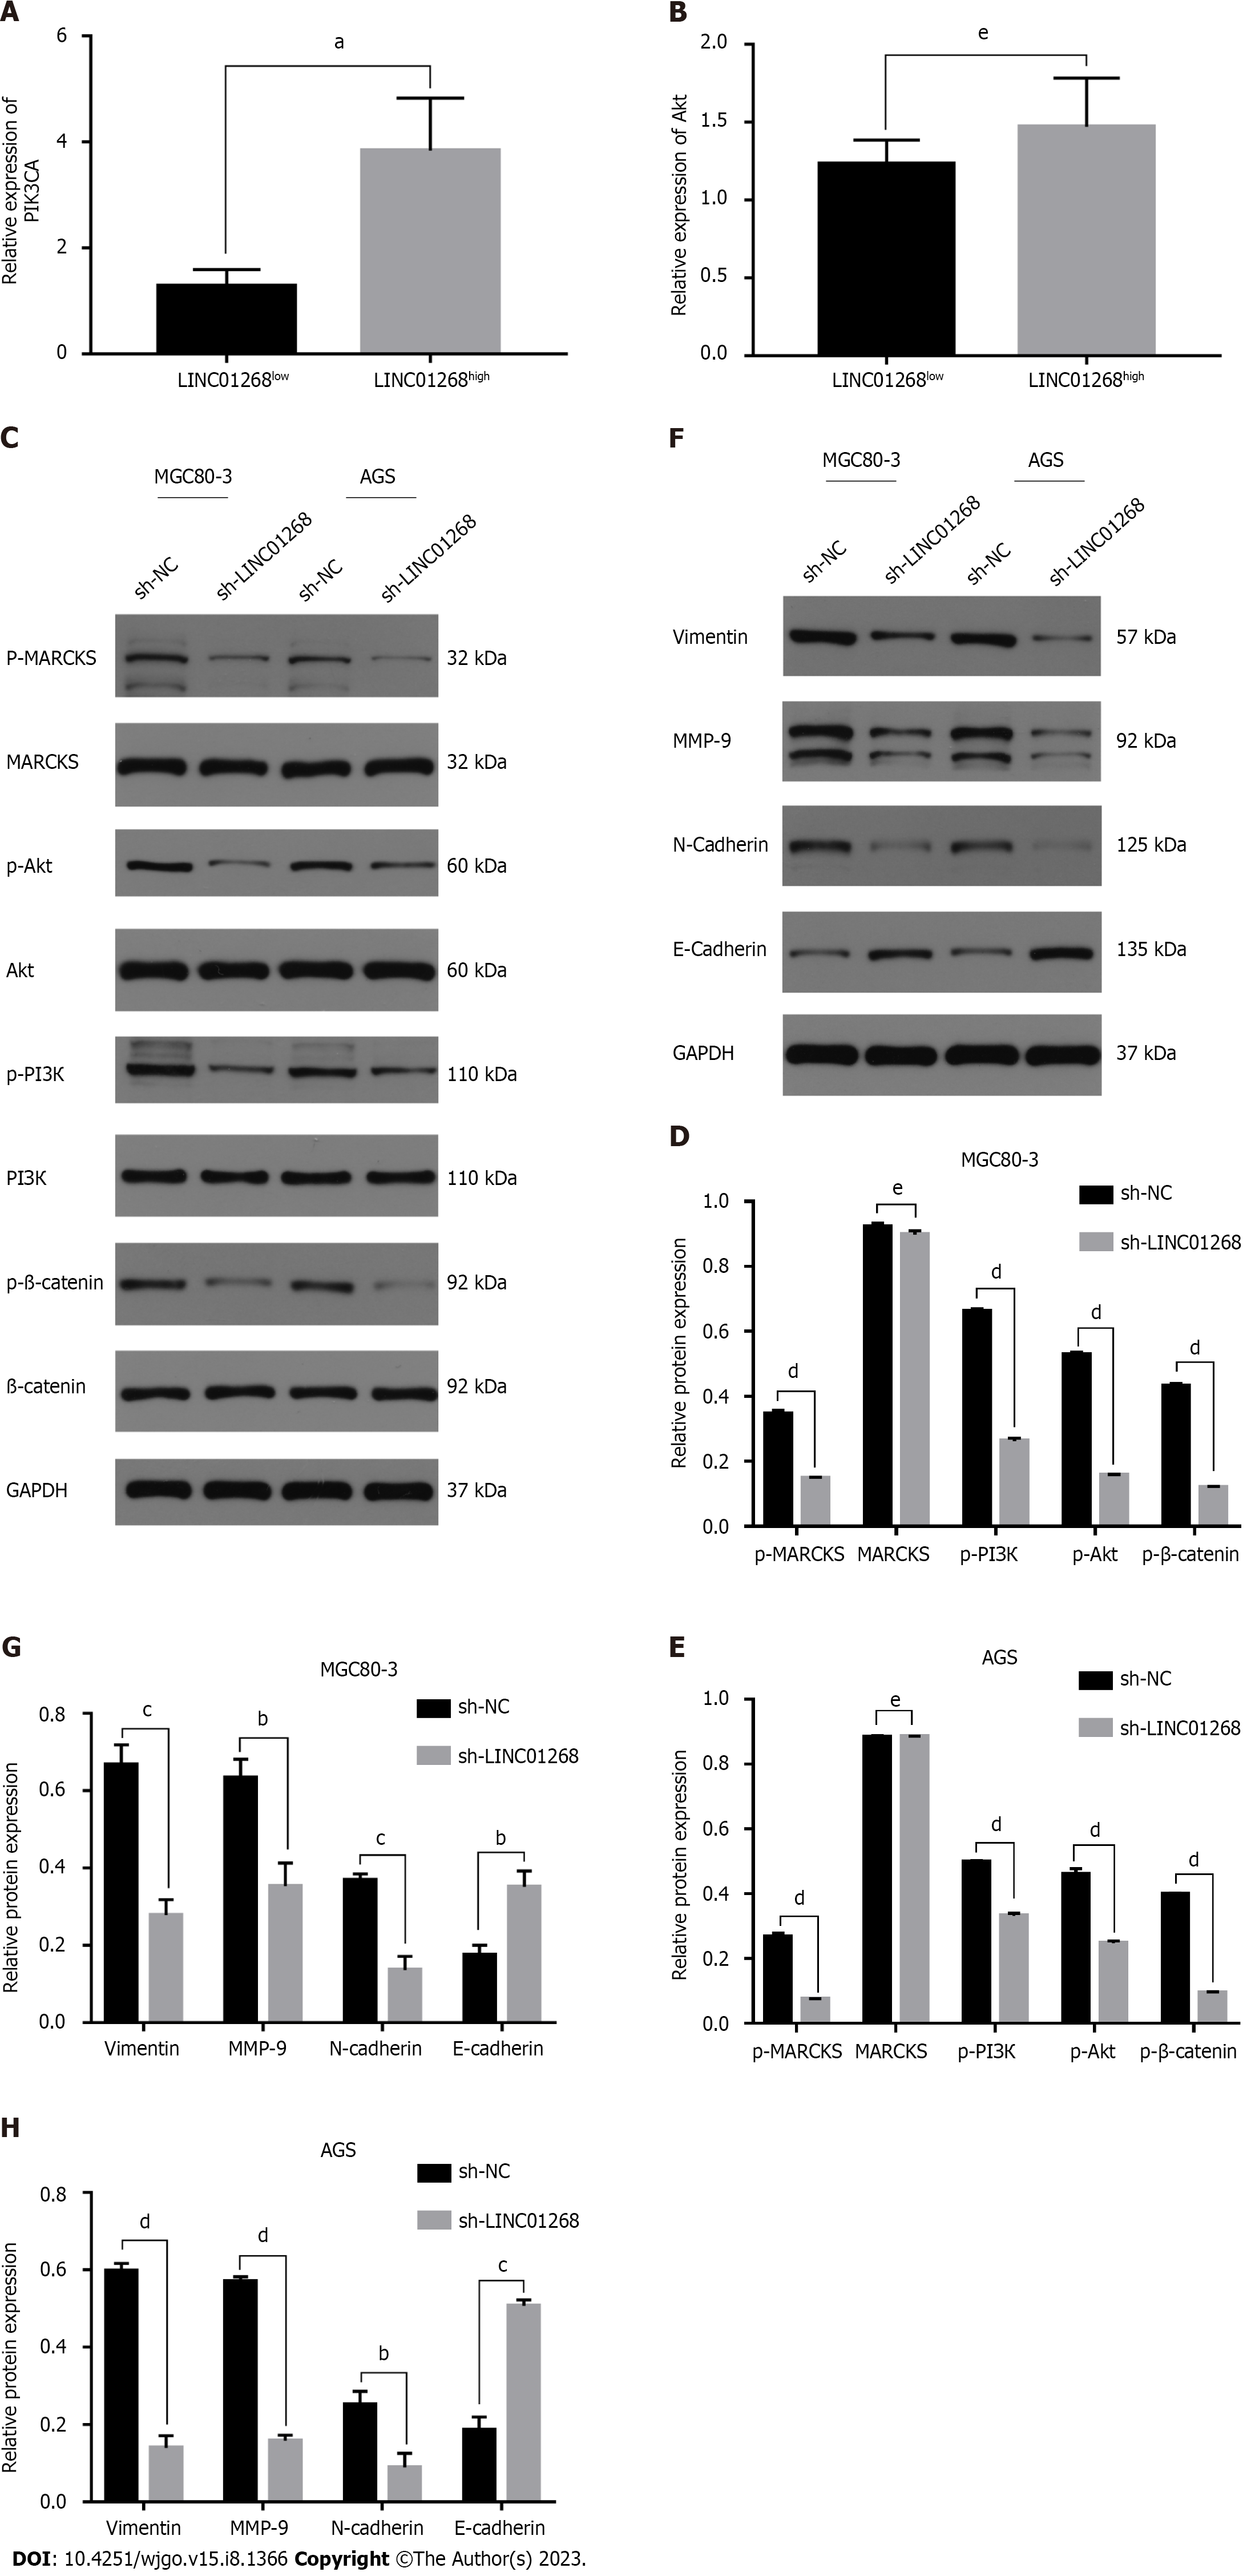
Figure 7 The relationship between LINC01268 and PI3K/Akt signaling pathway and epithelial-mesenchymal transition in gastric cancer.
A: The expression level of PIK3CA in the LINC01268high gastric cancer (GC) tissues was significantly higher than that in the LINC01268low cancer tissues; B: The expression level of Akt in the LINC01268high GC tissues was higher than that in the LINC01268low cancer tissues, but there was no statistical difference. Expression levels were normalized to ACTB levels. The results were shown as the mean ± SEM; C-E: After knocking down LINC01268, the p-MARCKS, p-PI3K, p-Akt and p-β-catenin protein levels were down-regulated in MGC80-3 and AGS cells, but the protein level of MARCKS had no significant change. Expression levels were normalized to GAPDH levels; F-H: Knocking down LINC01268 reduced vimentin, MMP-9 and N-cadherin protein levels, and increased E-cadherin protein levels in MGC80-3 and AGS cells. Expression levels were normalized to GAPDH levels. The results were shown as the mean ± SD. bP < 0.01, cP < 0.001, dP < 0.0001, eP > 0.05. MARCKS: Myristoylated alanine rich protein kinase C substrate; sh-NC: sh-negative control.
- Citation: Tang LH, Ye PC, Yao L, Luo YJ, Tan W, Xiang WP, Liu ZL, Tan L, Xiao JW. LINC01268 promotes epithelial-mesenchymal transition, invasion and metastasis of gastric cancer via the PI3K/Akt signaling pathway and targeting MARCKS. World J Gastrointest Oncol 2023; 15(8): 1366-1383
- URL: https://www.wjgnet.com/1948-5204/full/v15/i8/1366.htm
- DOI: https://dx.doi.org/10.4251/wjgo.v15.i8.1366


