Copyright
©The Author(s) 2023.
World J Gastrointest Oncol. Jul 15, 2023; 15(7): 1262-1270
Published online Jul 15, 2023. doi: 10.4251/wjgo.v15.i7.1262
Published online Jul 15, 2023. doi: 10.4251/wjgo.v15.i7.1262
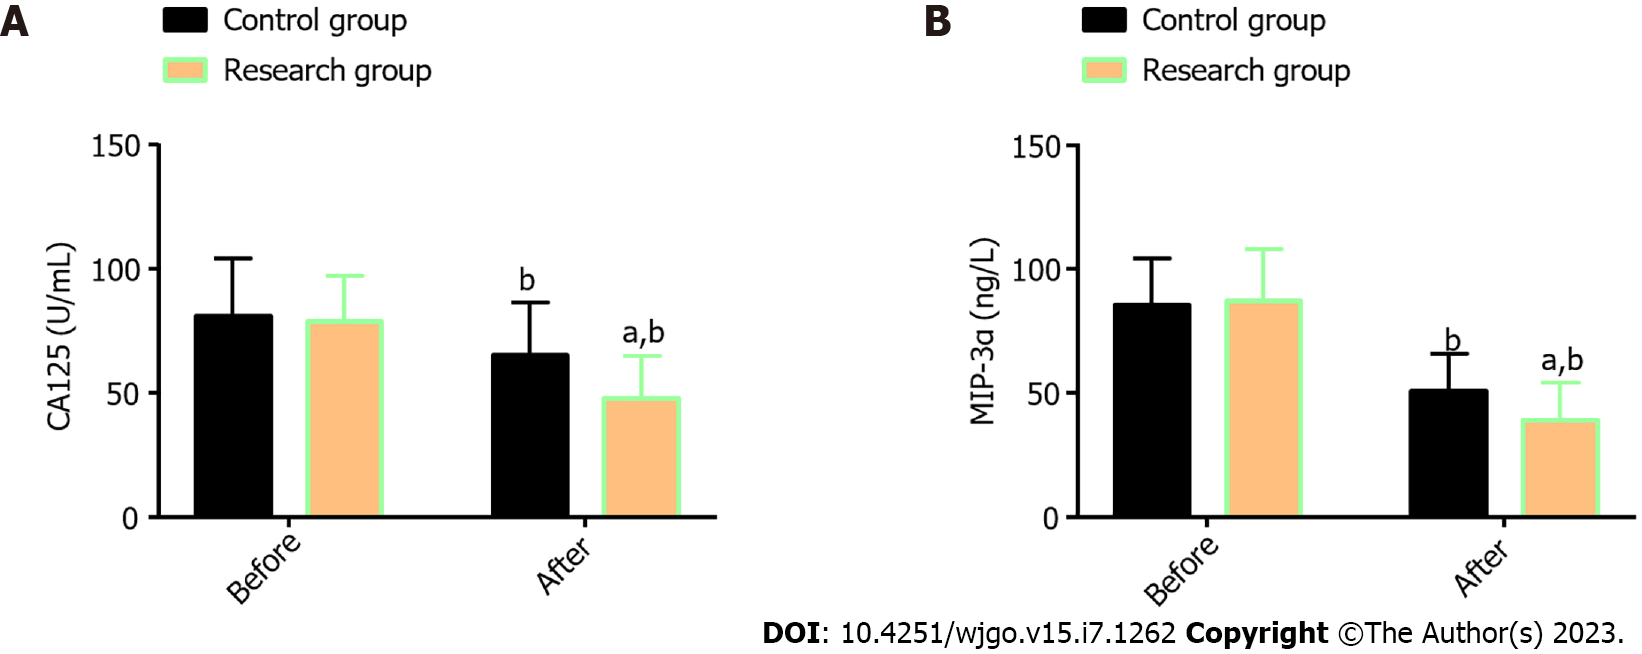
Figure 1 Serum tumor markers in two groups of esophageal cancer patients.
A: The research group had markedly lower CA125 levels than the control group after treatment; B: The research group had markedly lower MIP-3α levels than the control group after treatment. aP < 0.05 vs control; bP < 0.01, vs before treatment. CA125: Carbohydrate antigen 125; MIP-3α: Macrophage inflammatory protein-3α.
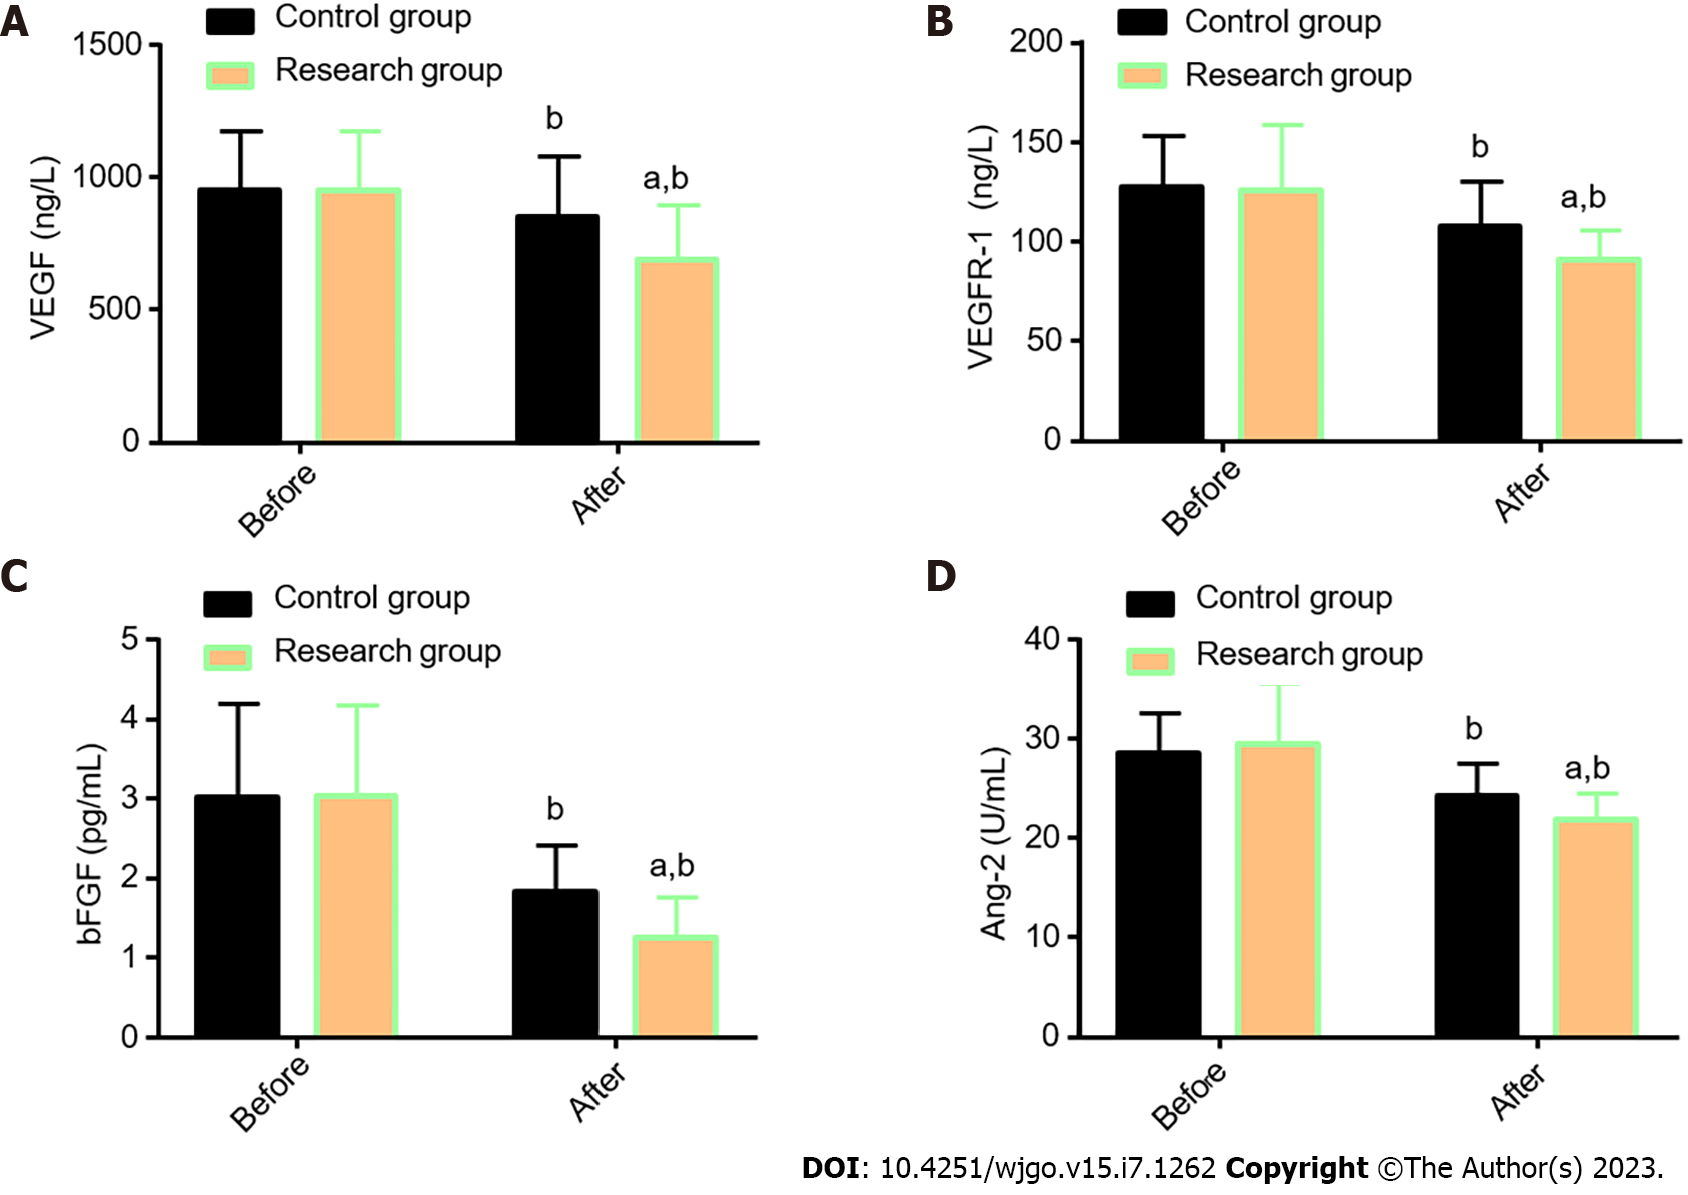
Figure 2 Angiogenesis-related indexes in two groups of esophageal cancer patients.
A: The research group had markedly lower VEGF levels than the control group after treatment; B: The research group had markedly lower VEGFR-1 Levels than the control group after treatment; C: The research group had markedly lower bFGF levels than the control group after treatment; D: The research group had markedly lower Ang-2 levels than the control group after treatment. aP < 0.05 vs control; bP < 0.01, vs before treatment. VEGF: Vascular endothelial growth factor; VEGFR-1: Vascular endothelial growth factor receptor-1; bFGF: Basic fibroblast growth factor; Ang-2: Angiogenin-2.
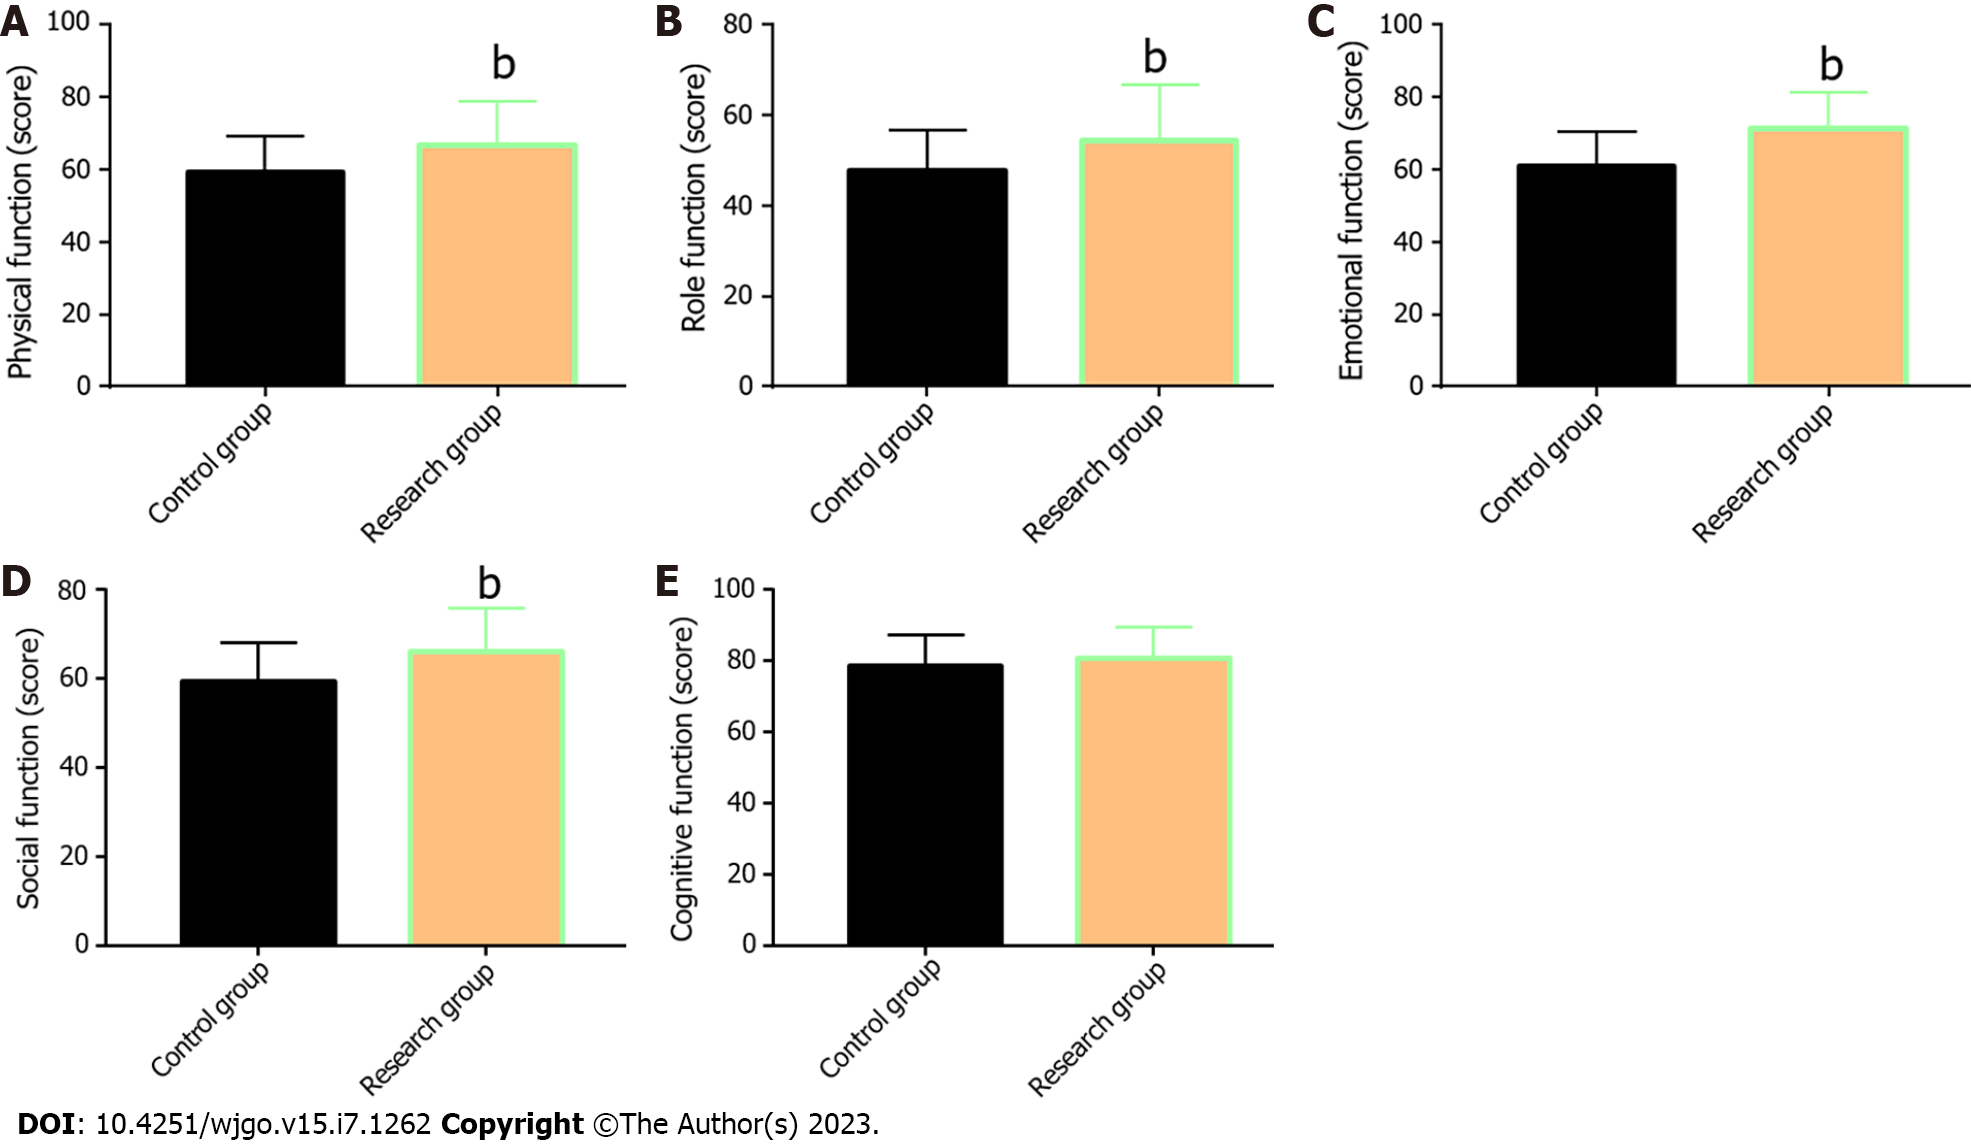
Figure 3 Quality of life of esophageal cancer patients.
A: The research group had markedly higher physical function scores than the control group after treatment; B: The research group had markedly higher role function scores than the control group after treatment; C: The research group had statistically higher emotional function scores than the control group after treatment; D: The research group had markedly higher social function scores than the control group after treatment; E: The research group had obviously higher cognitive function scores than the control group after treatment. bP < 0.01, vs before treatment.
- Citation: Zhang TW, Zhang P, Nie D, Che XY, Fu TT, Zhang Y. Efficacy of concurrent chemoradiotherapy with thalidomide and S-1 for esophageal carcinoma and its influence on serum tumor markers. World J Gastrointest Oncol 2023; 15(7): 1262-1270
- URL: https://www.wjgnet.com/1948-5204/full/v15/i7/1262.htm
- DOI: https://dx.doi.org/10.4251/wjgo.v15.i7.1262


