Copyright
©The Author(s) 2023.
World J Gastrointest Oncol. Jul 15, 2023; 15(7): 1200-1214
Published online Jul 15, 2023. doi: 10.4251/wjgo.v15.i7.1200
Published online Jul 15, 2023. doi: 10.4251/wjgo.v15.i7.1200
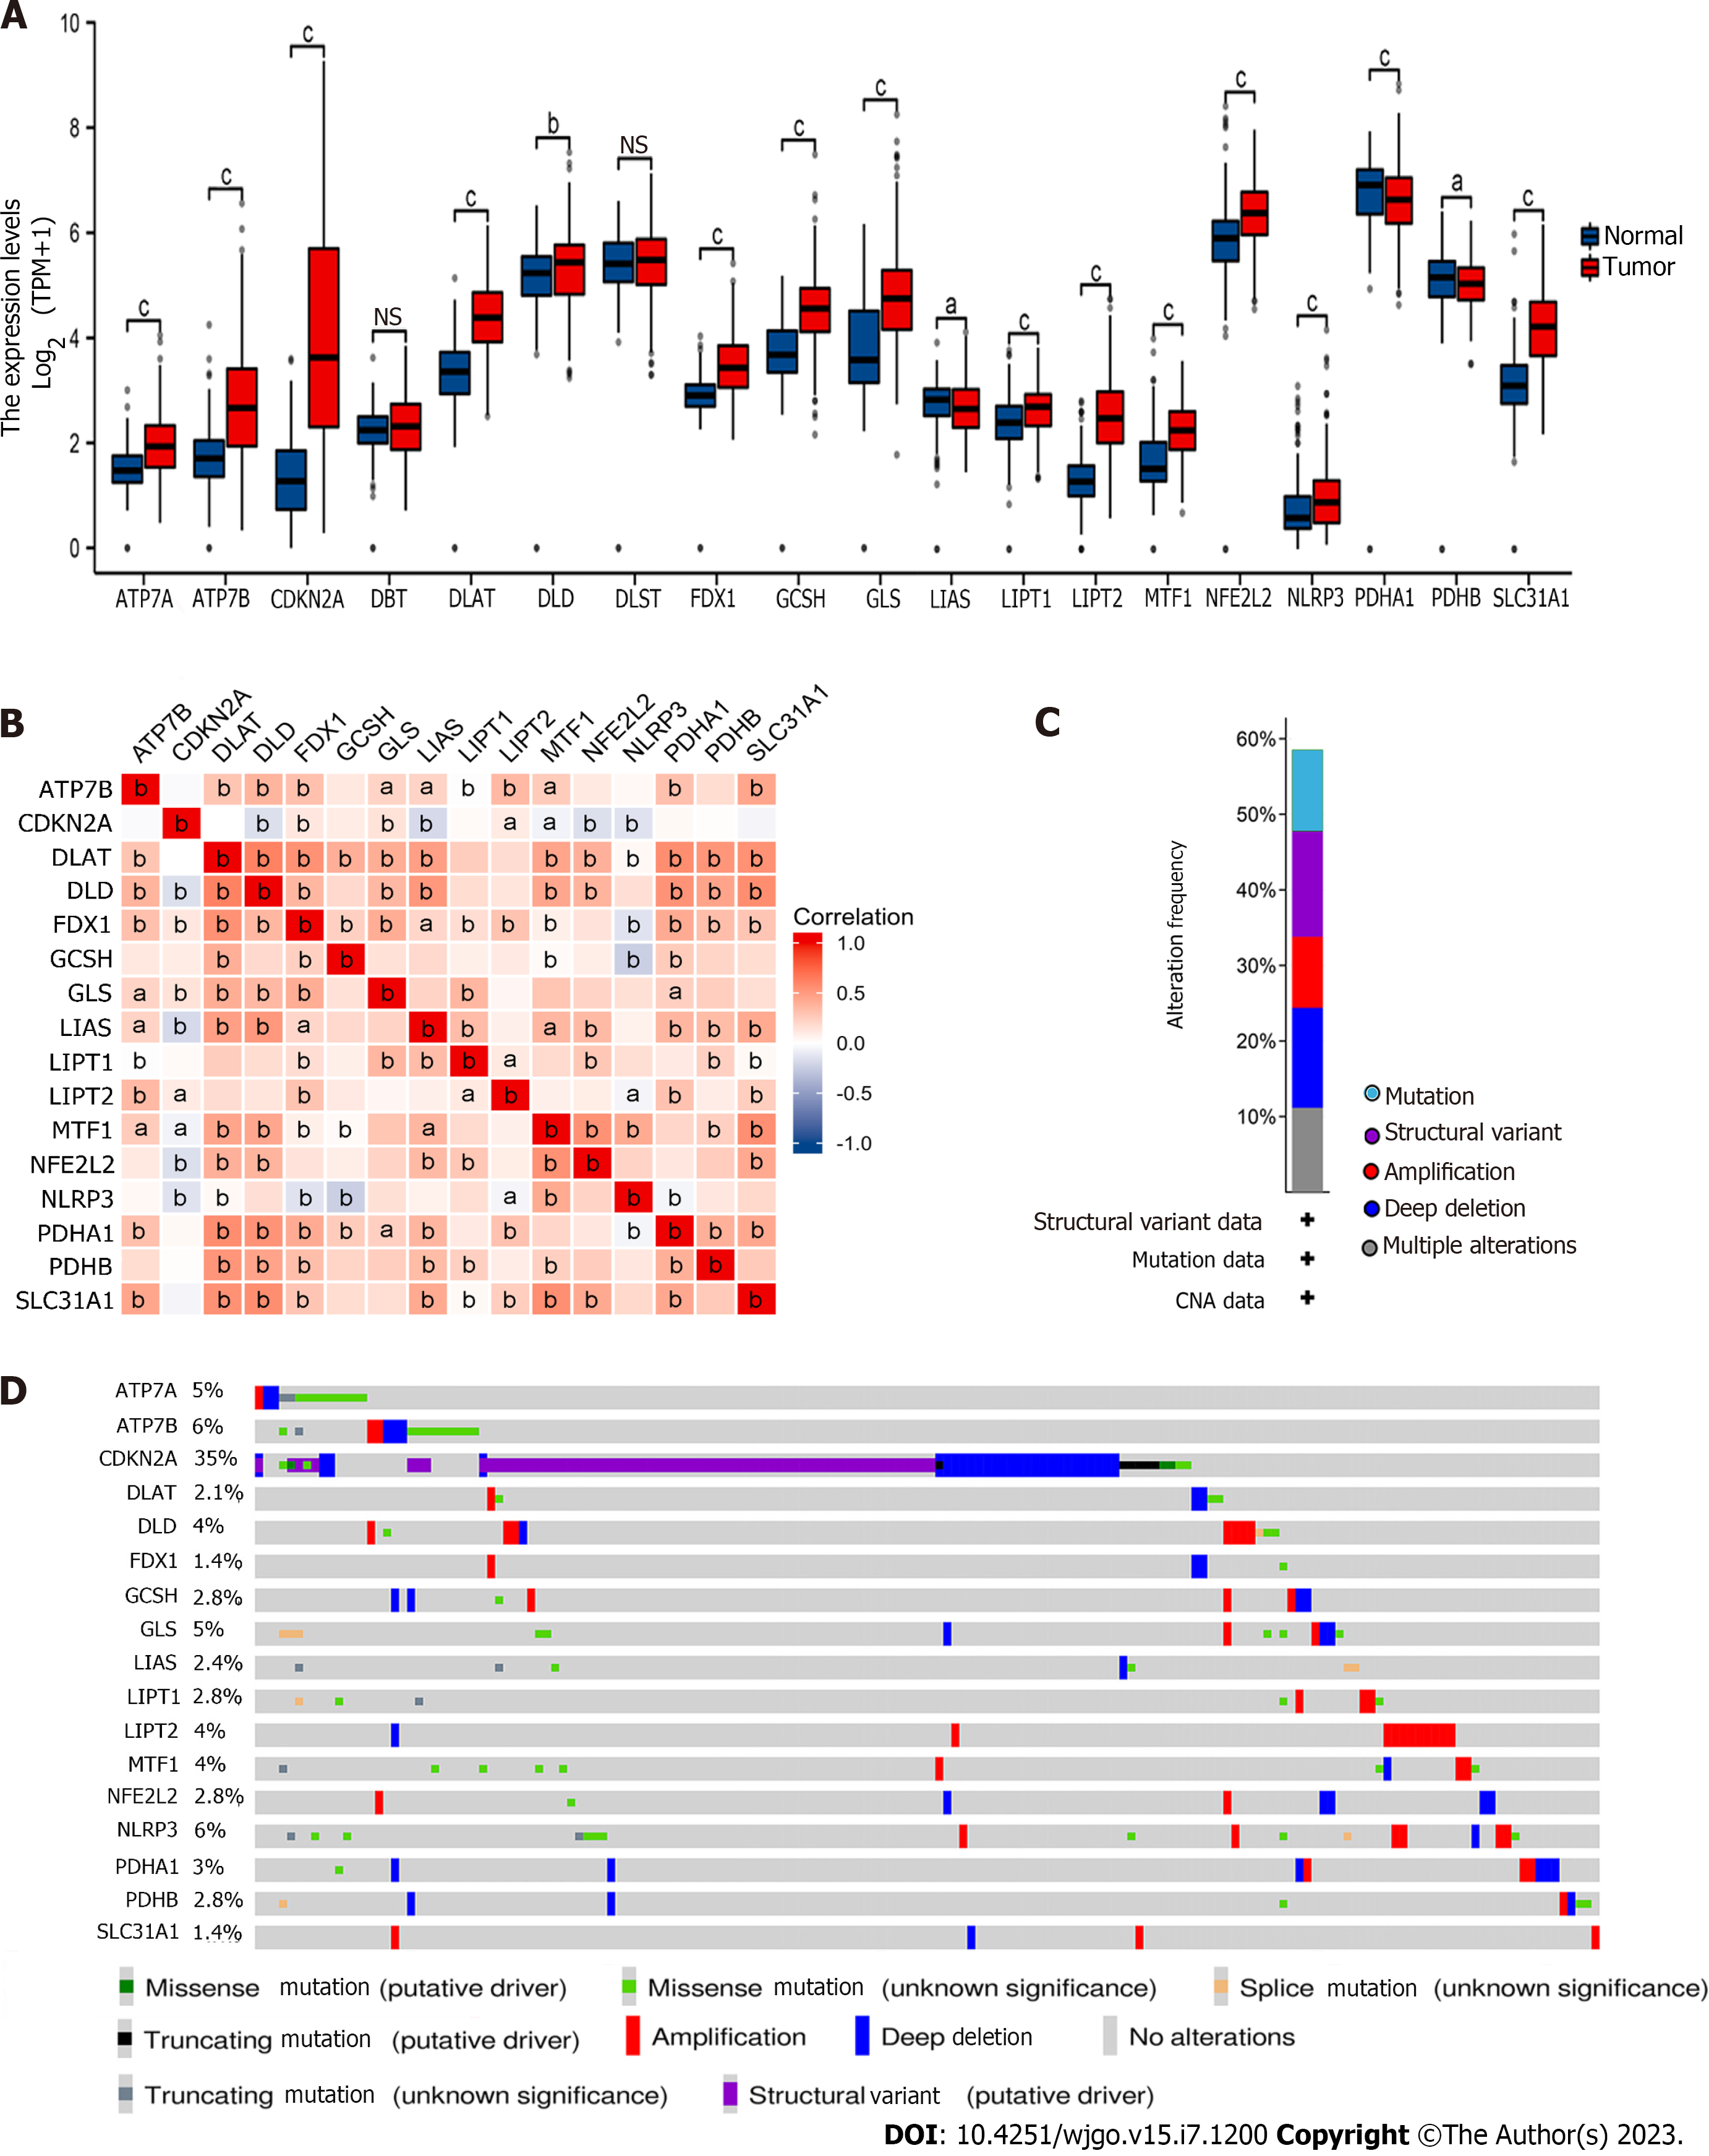
Figure 1 Cuproptosis-related gene expression status in gastric cancer.
A: Expression levels of 19 human cuproptosis-related genes (CRGs) in gastric cancer tissues and corresponding normal tissues in the Cancer Genome Atlas database; B: Correlations between the expression of 16 differential CRGs in gastric cancer; C: Overall landscape of gene mutations of differential CRGs in gastric cancer; D: Patterns of gene mutation of differentially expressed CRGs in gastric cancer (aP < 0.05, bP < 0.01, cP < 0.001). NS: Not significant.
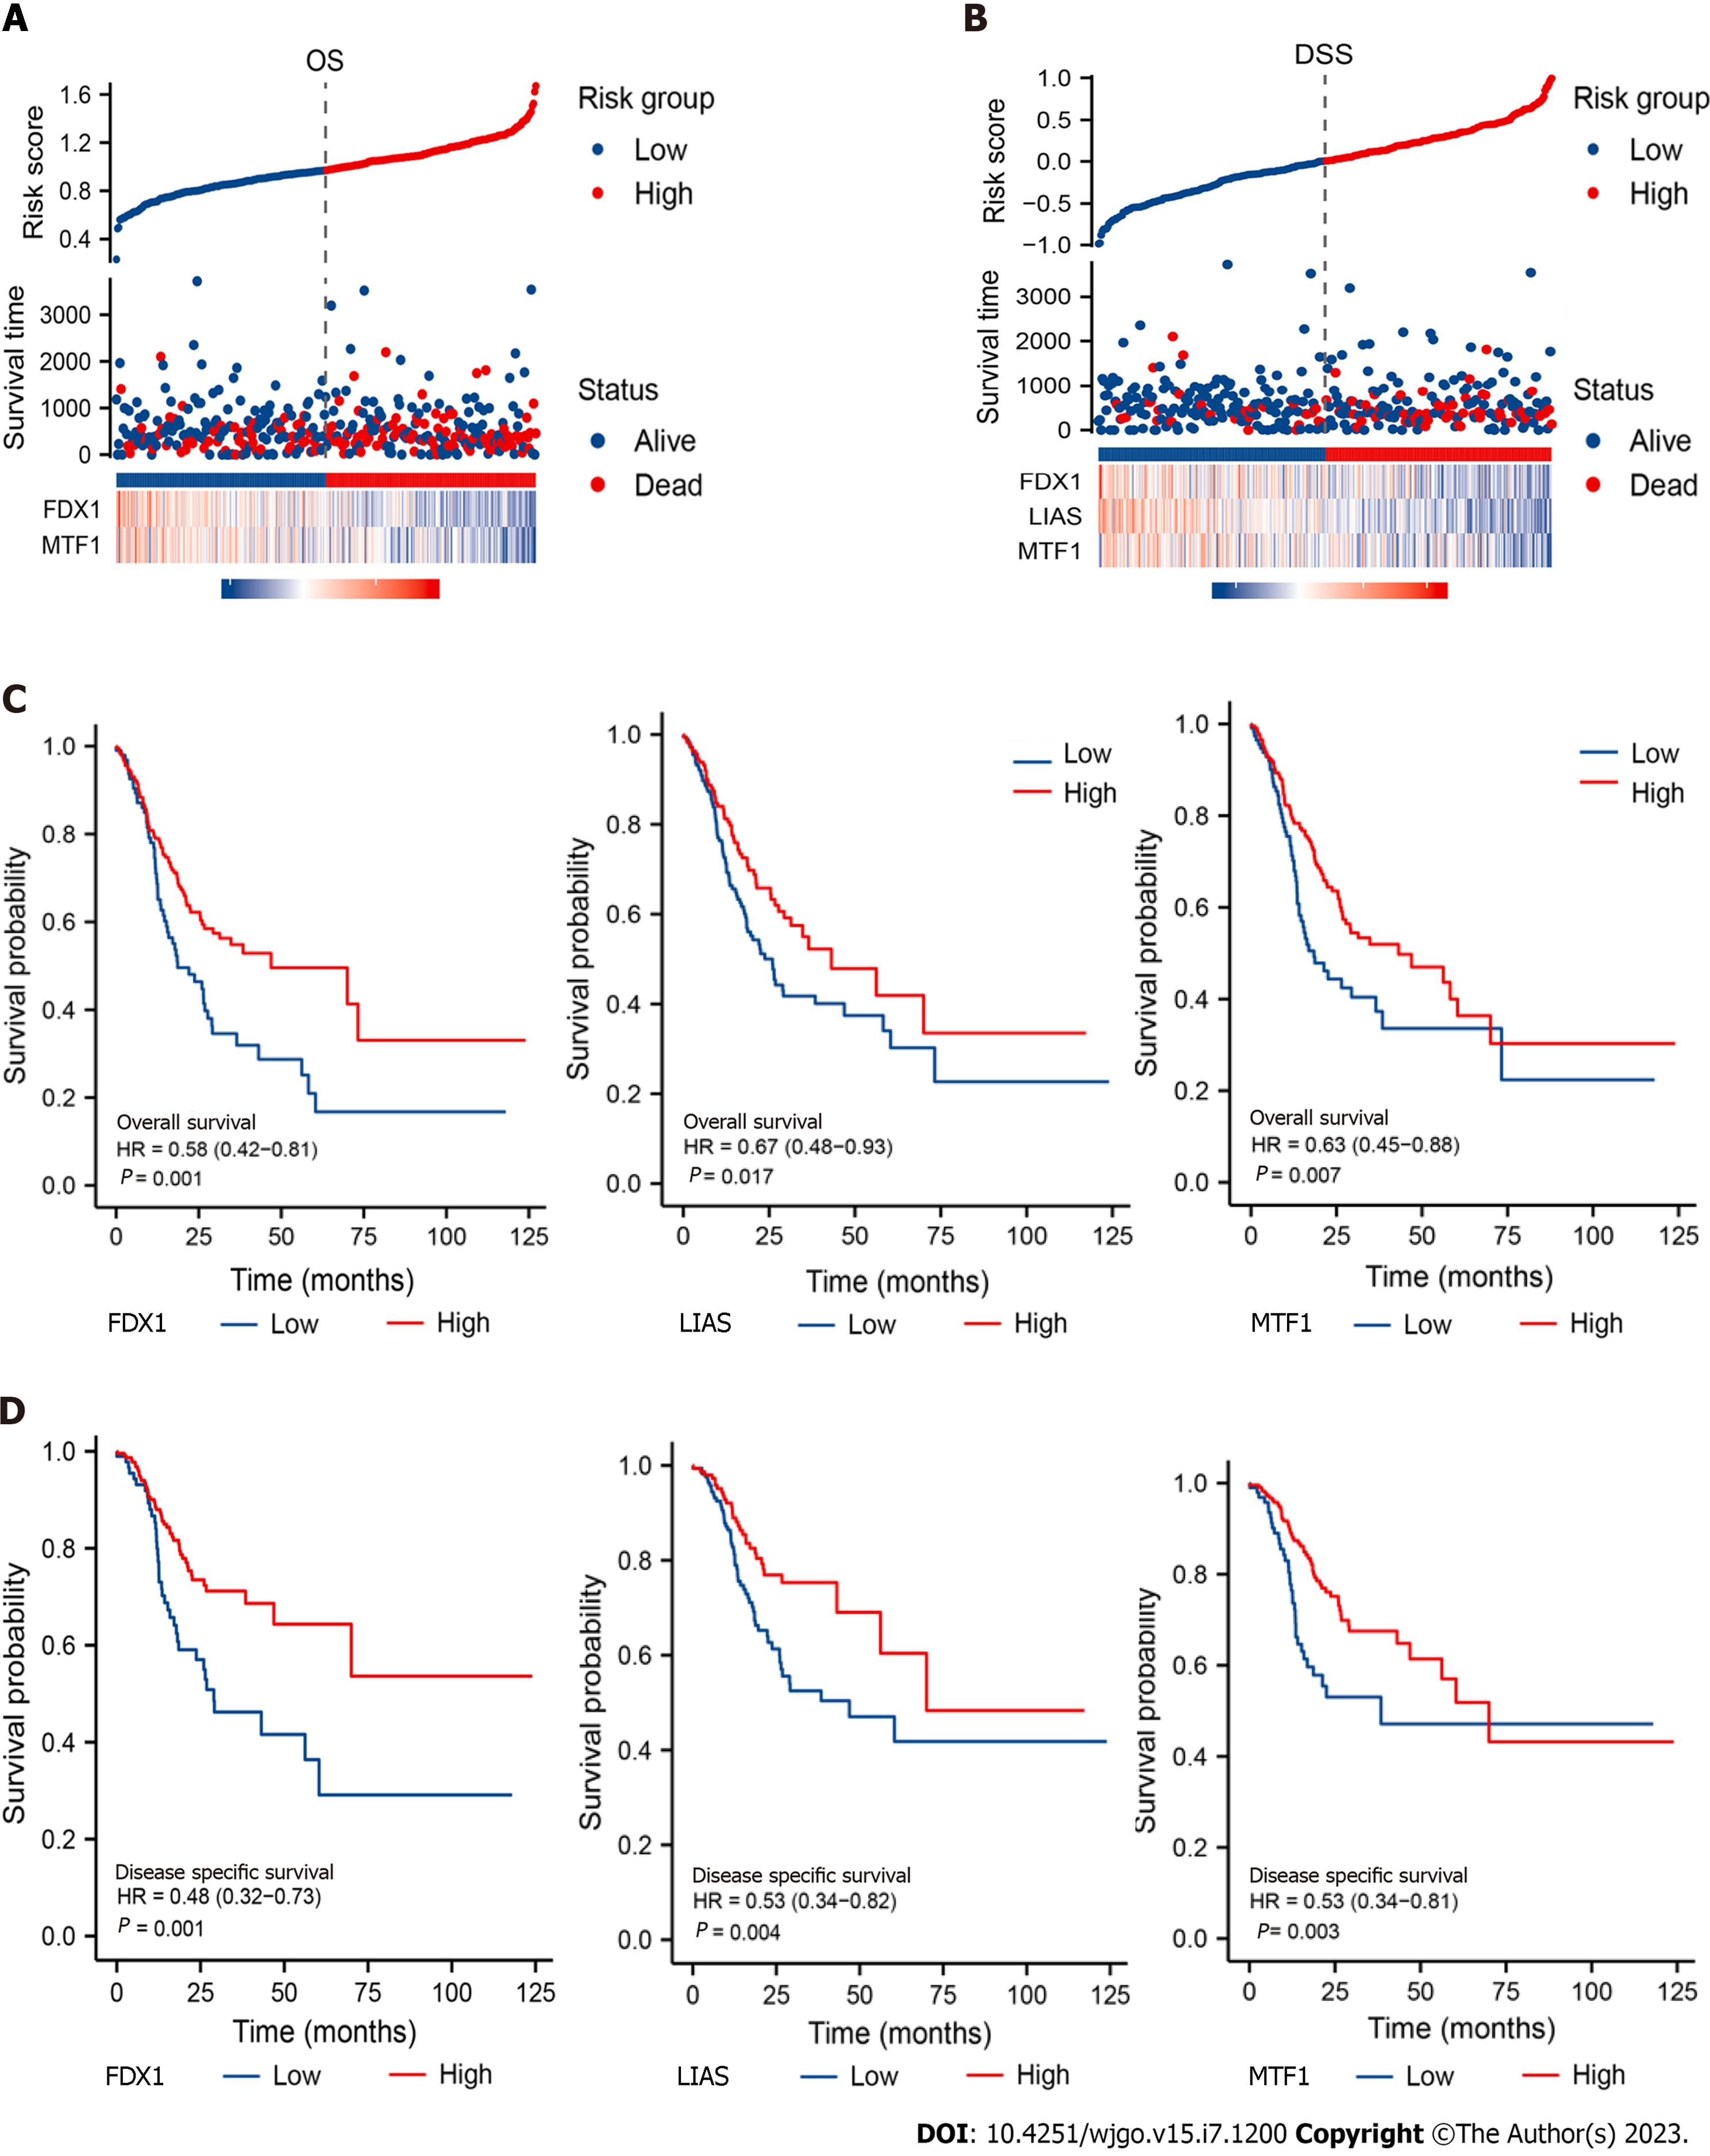
Figure 2 Clinical significance of prognostic cuproptosis-related genes in gastric cancer in the Cancer Genome Atlas cohort.
A: Distribution of risk score, overall survival (OS) status and the expression of FDX1 and MTF1 in gastric cancer (GC) patients; B: Distribution of risk score, disease-specific survival (DSS) status and the expression of FDX1 and MTF1 in GC patients; C: Kaplan-Meier curves of the expression of FDX1, LIAS, MTF1 and OS time; D: Kaplan-Meier curves of the expression of FDX1, LIAS, and MTF1 and DSS time.
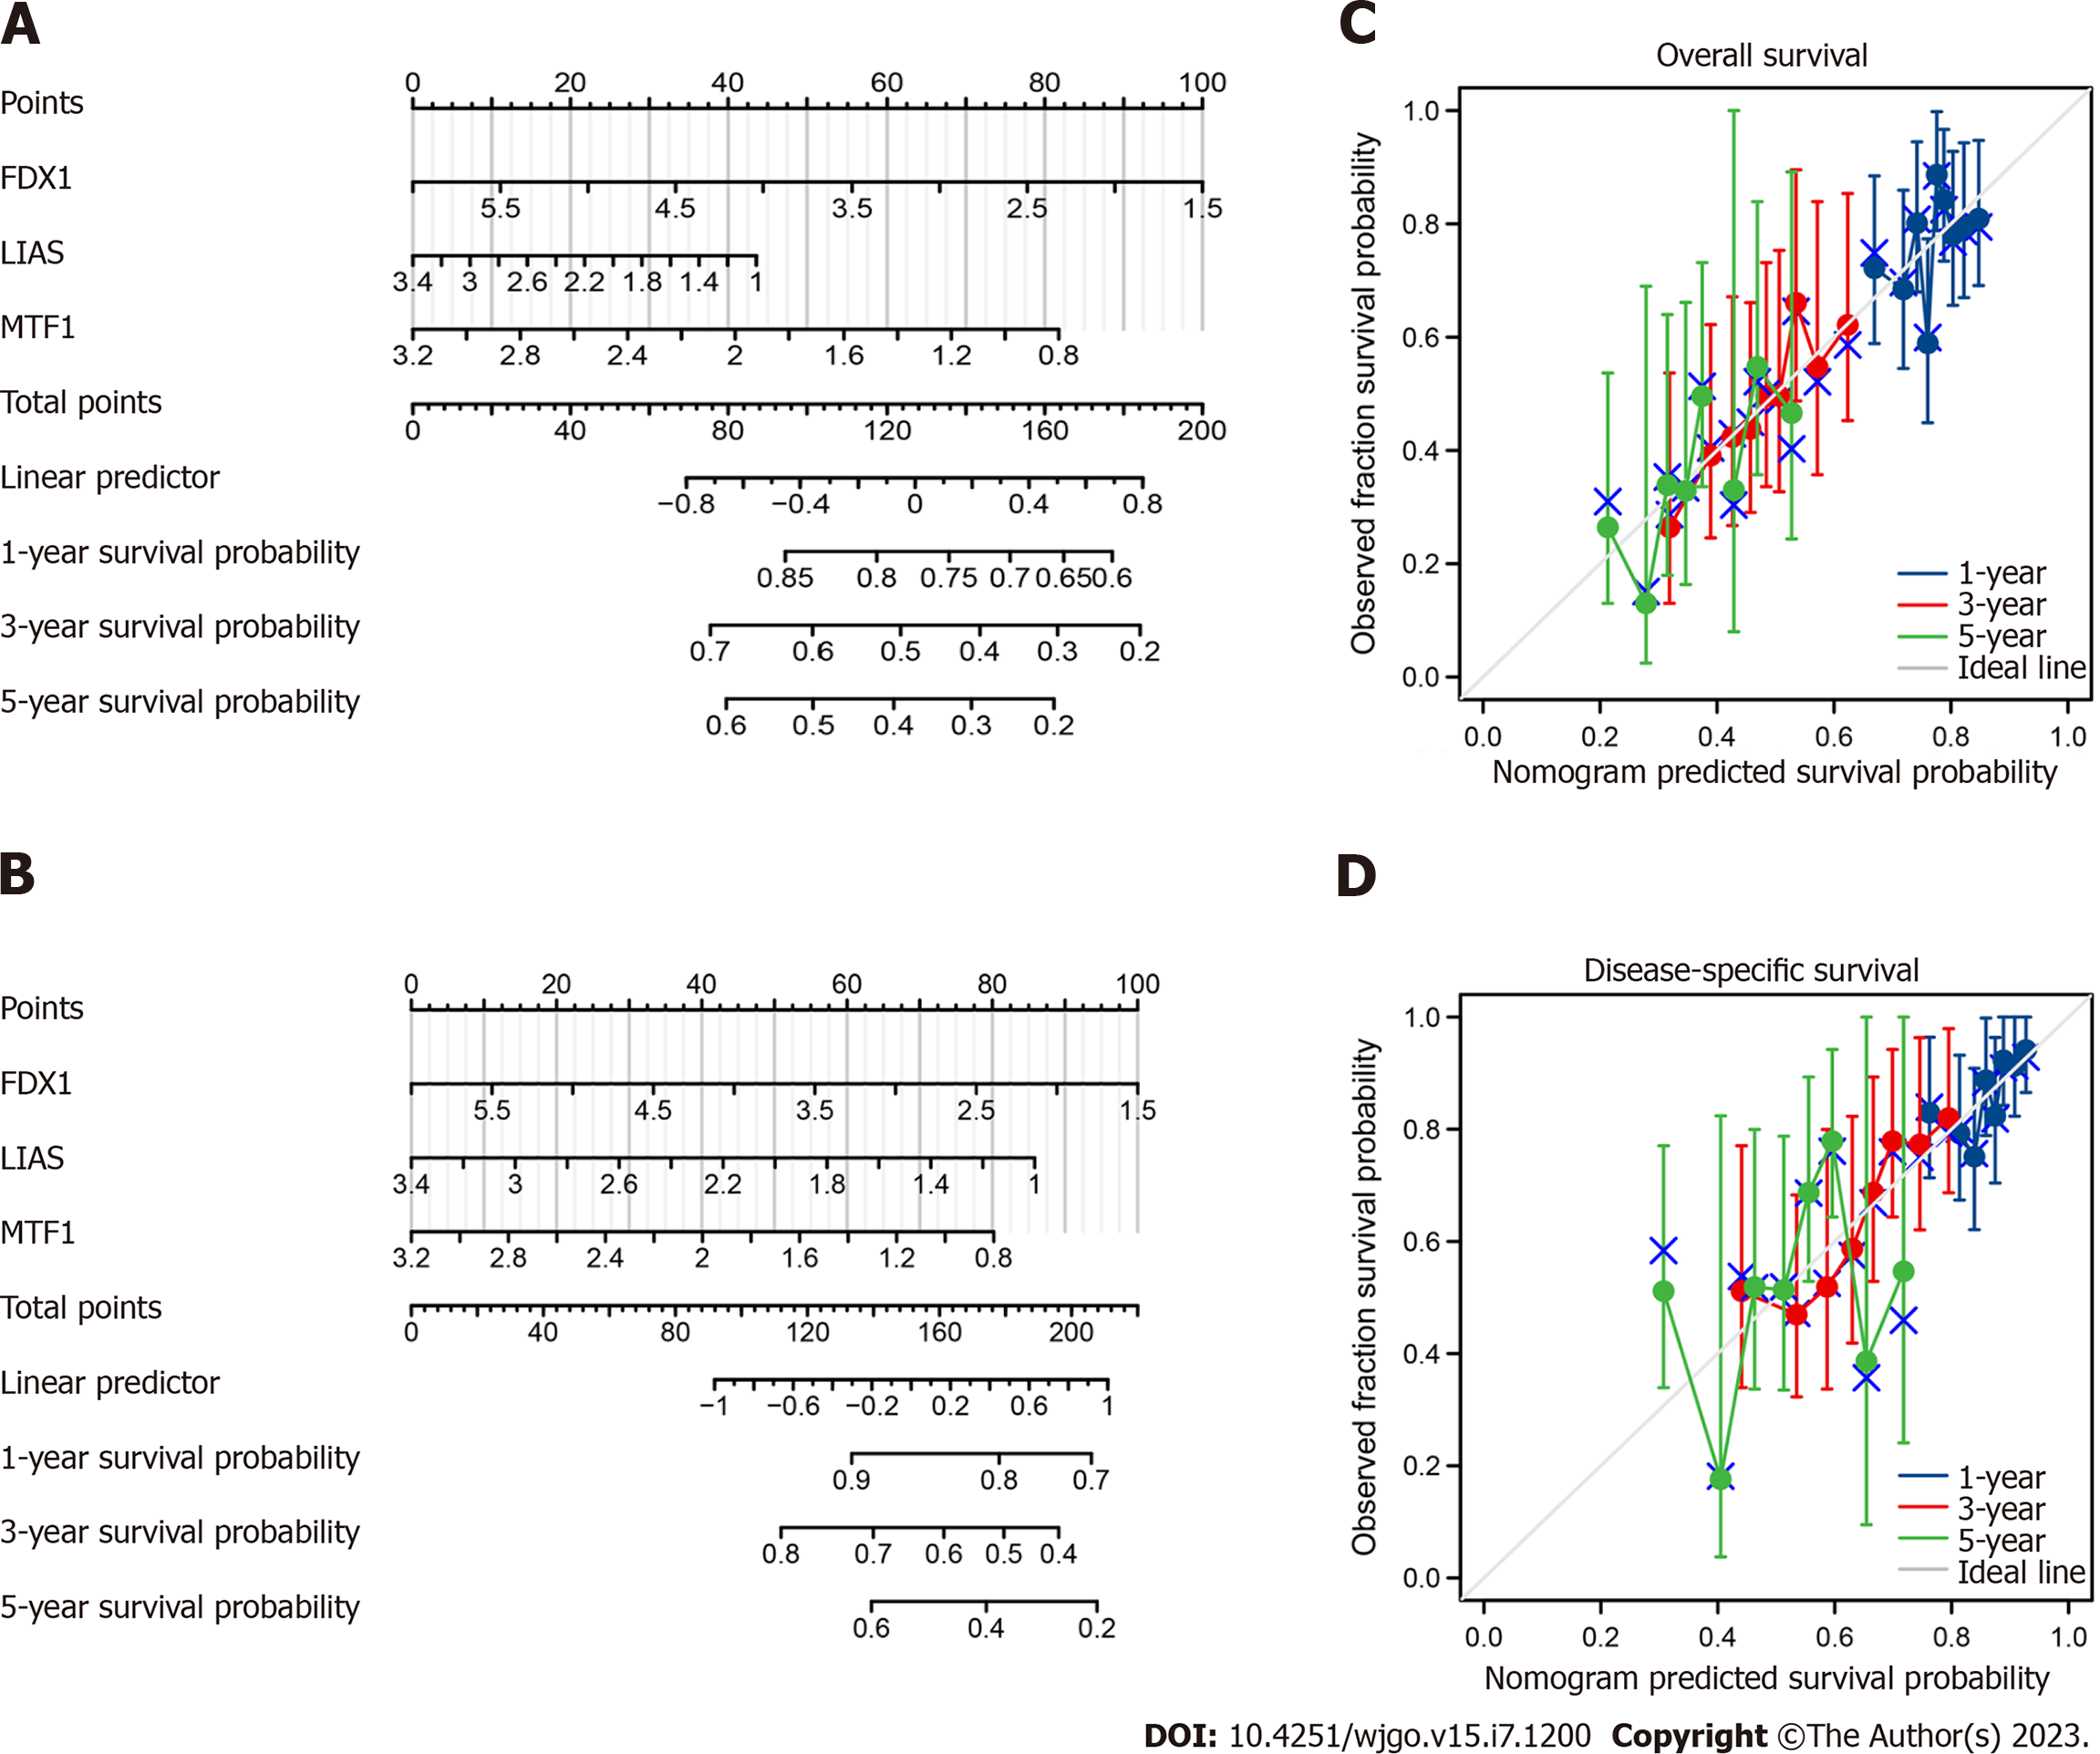
Figure 3 Overall survival nomogram model and calibration plots.
A: Prognostic nomogram plot constructed to predict the 1-, 3-, and 5-year overall survival (OS) times of gastric cancer patients in The Cancer Genome Atlas (TCGA) cohort; B: Prognostic nomogram plot constructed to predict the 1-, 3-, and 5-year disease-specific survival (DSS) times of gastric cancer patients in the TCGA cohort; C: Calibration plot of the nomogram for 1-, 3-, and 5-year OS time; D: Calibration plot of the nomogram for 1-, 3-, and 5-year DSS time.
Figure 4 Relationship between the expression of prognostic cuproptosis-related genes and immune cell infiltration levels in gastric cancer.
A-C: Kaplan-Meier curves of the expression of FDX1 (A), LIAS (B), MTF1 (C) in scRNA-seq samples and immune cell infiltration level groups. All of these genes were correlated with the overall survival time of gastric cancer patients; D-F: The correlation of different immune cell infiltration levels and the expression of FDX (D), LIAS (E), and MTF1 (F) in scRNA-seq samples; G-I: Lollipop plots of different immune cell infiltration levels and the expression of FDX (G), LIAS (H), and MTF1 (I). The length of the bars in the lollipop plots is relative to the correlation levels, and the color of the cycles is relative to the P value; J-L: Lower levels of methylation in FDX1 (J) and higher levels of methylation in LIAS (K), MTF1 (L) are associated with poor prognosis. HR: Hazard ratio; STAD: Stomach adenocarcinoma; TCGA: The Cancer Genome Atlas.
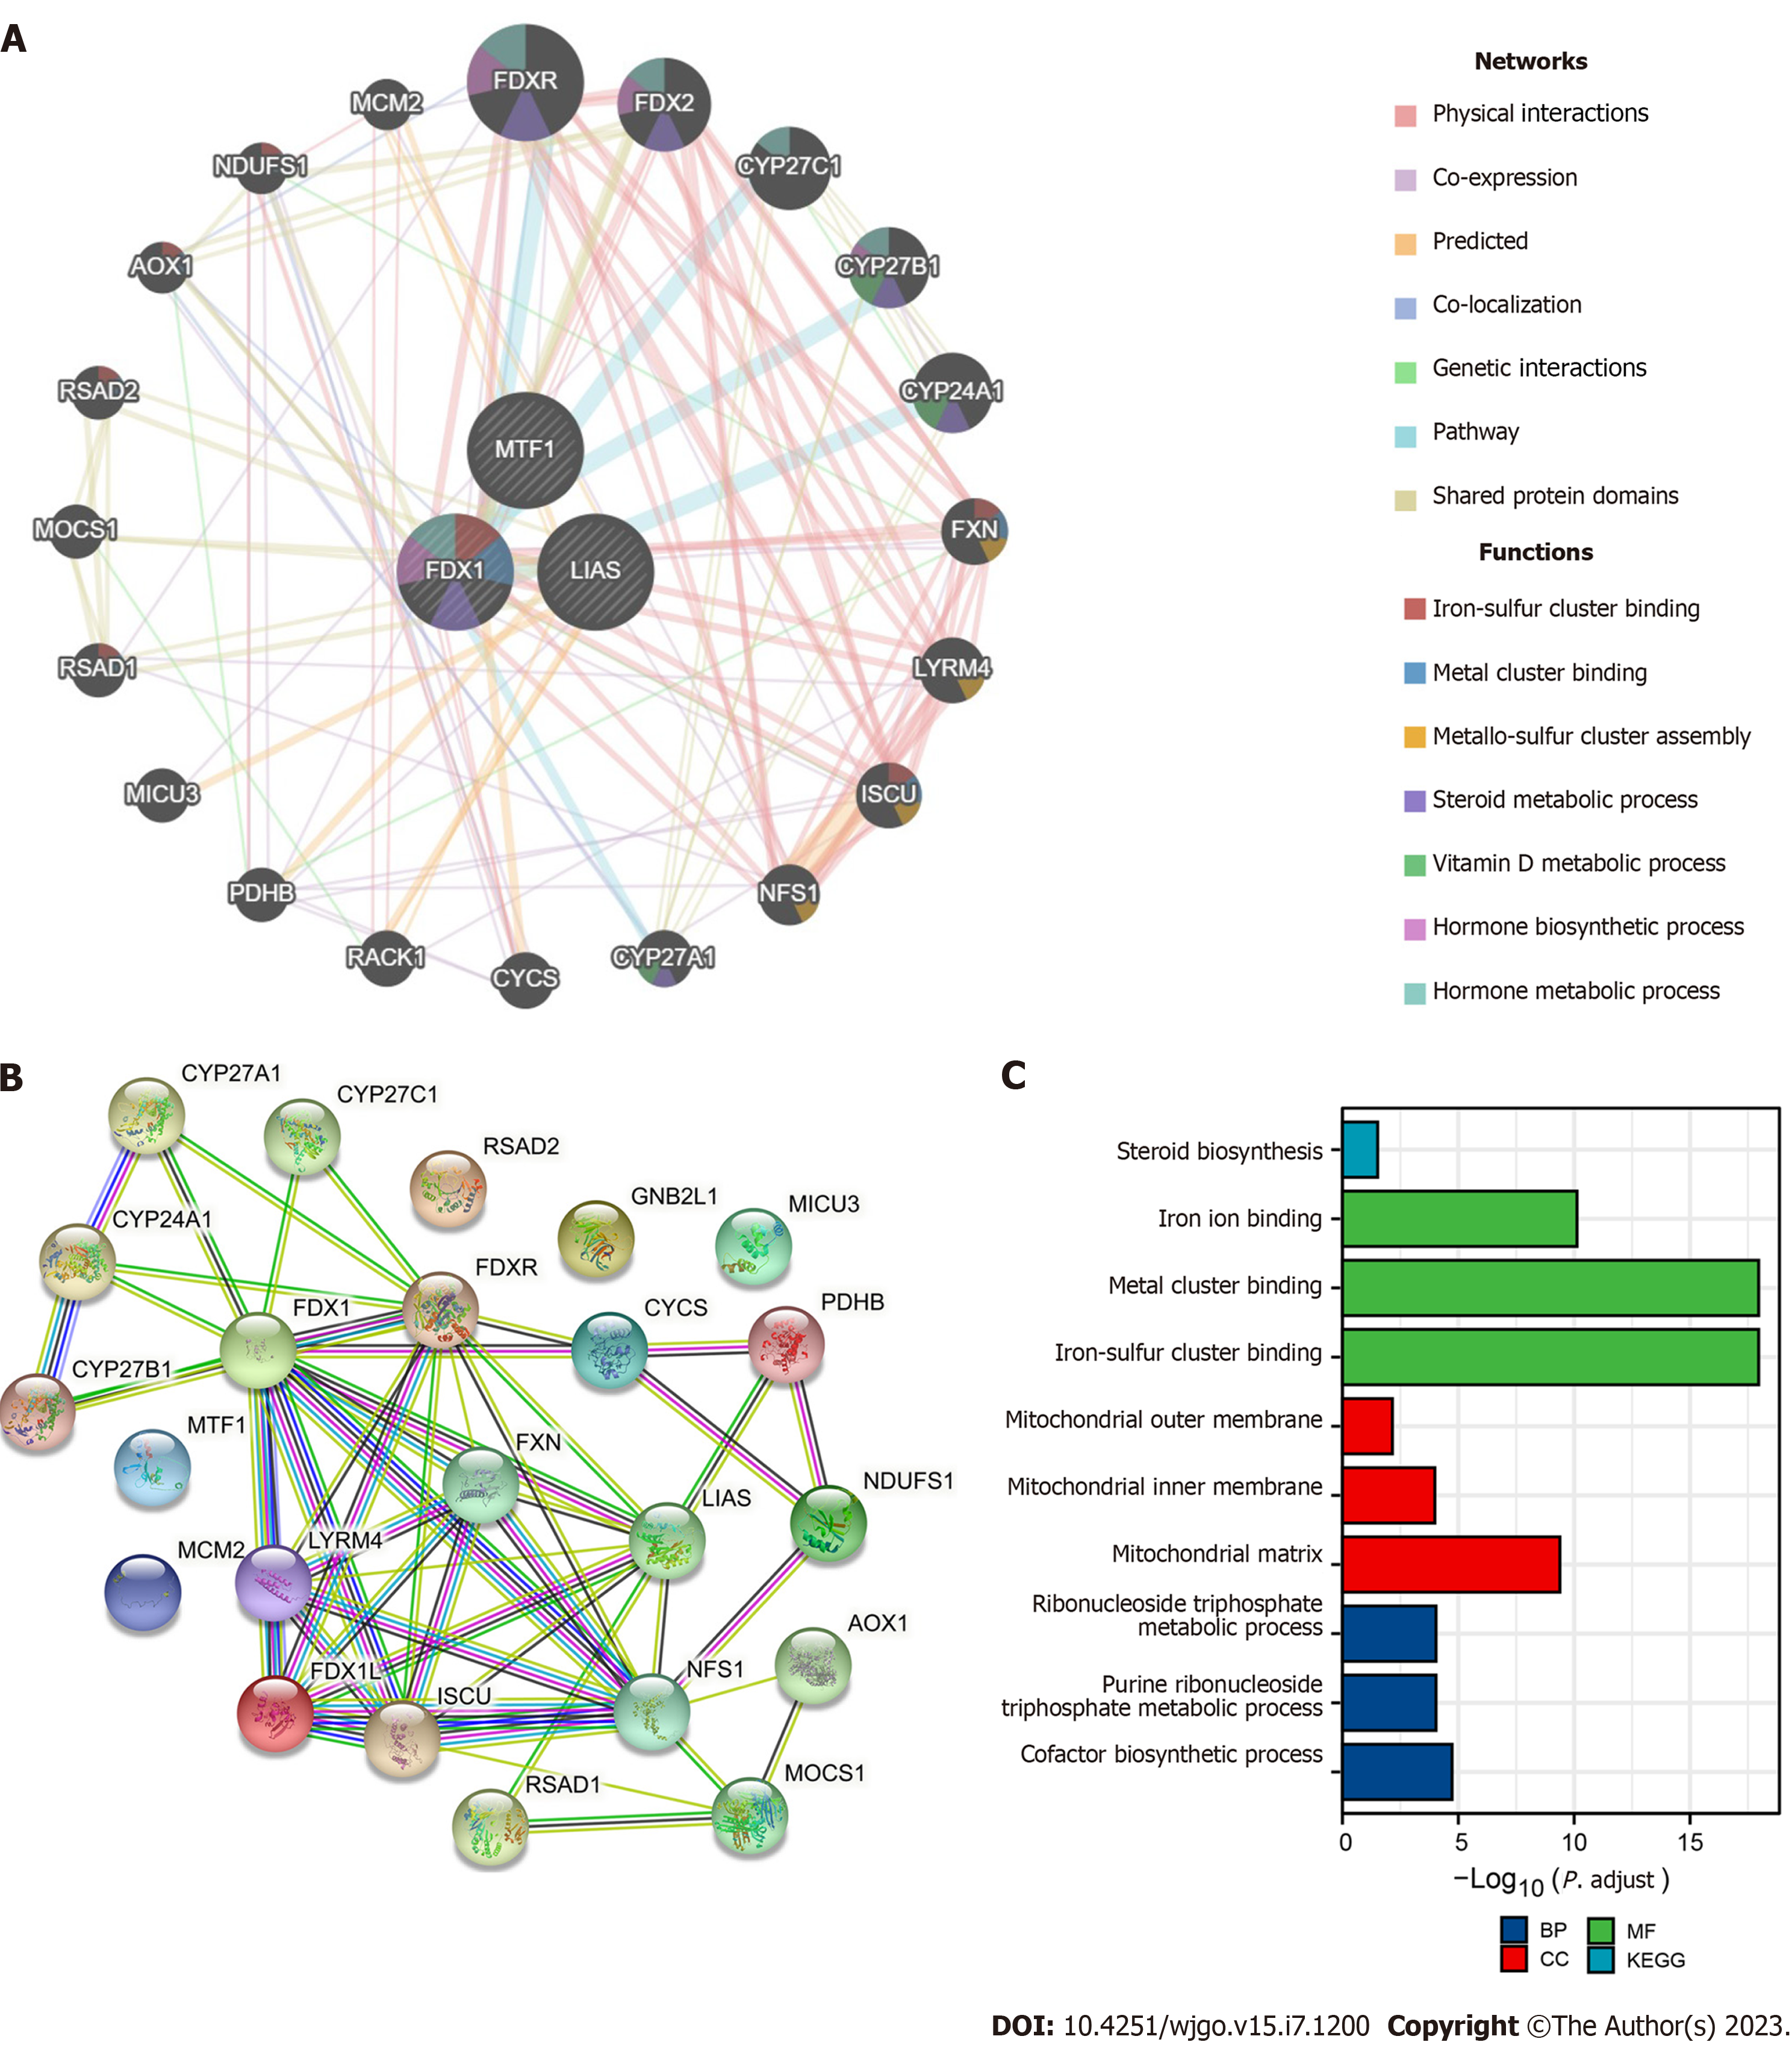
Figure 5 Analysis of the biological functions of prognostic cuproptosis-related genes.
A: Gene network associated with FDX1, LIAS, and MTF1 containing 23 related genes, constructed using GeneMANIA. The different colors of the lines are associated with the different functions; B: Protein-protein interaction network diagram of interactions between proteins encoded by genes related to FDX1, LIAS, and MTF1 constructed using GeneMANIA and STRING; C: KEGG pathway enrichment analysis and gene ontology classification of several targets from STRING. BP: Biological process; CC: Cellular component; MF: Molecular function.
Figure 6 Differential expression analysis and validation of prognostic cuproptosis-related genes in the TNM plot database.
A: FDX1 was remarkably overexpressed in gastric cancer (GC) cancer samples in the Gene Expression Omnibus (GEO) in the TNM plot database; B: LIAS was remarkably downregulated in GC cancer samples in GEO in the TNM plot database; C: MTF1 was remarkably overexpressed in GC cancer samples in GEO in the TNM plot database.
- Citation: Yan JN, Guo LH, Zhu DP, Ye GL, Shao YF, Zhou HX. Clinical significance and potential application of cuproptosis-related genes in gastric cancer. World J Gastrointest Oncol 2023; 15(7): 1200-1214
- URL: https://www.wjgnet.com/1948-5204/full/v15/i7/1200.htm
- DOI: https://dx.doi.org/10.4251/wjgo.v15.i7.1200


