Copyright
©The Author(s) 2023.
World J Gastrointest Oncol. Jun 15, 2023; 15(6): 1019-1035
Published online Jun 15, 2023. doi: 10.4251/wjgo.v15.i6.1019
Published online Jun 15, 2023. doi: 10.4251/wjgo.v15.i6.1019
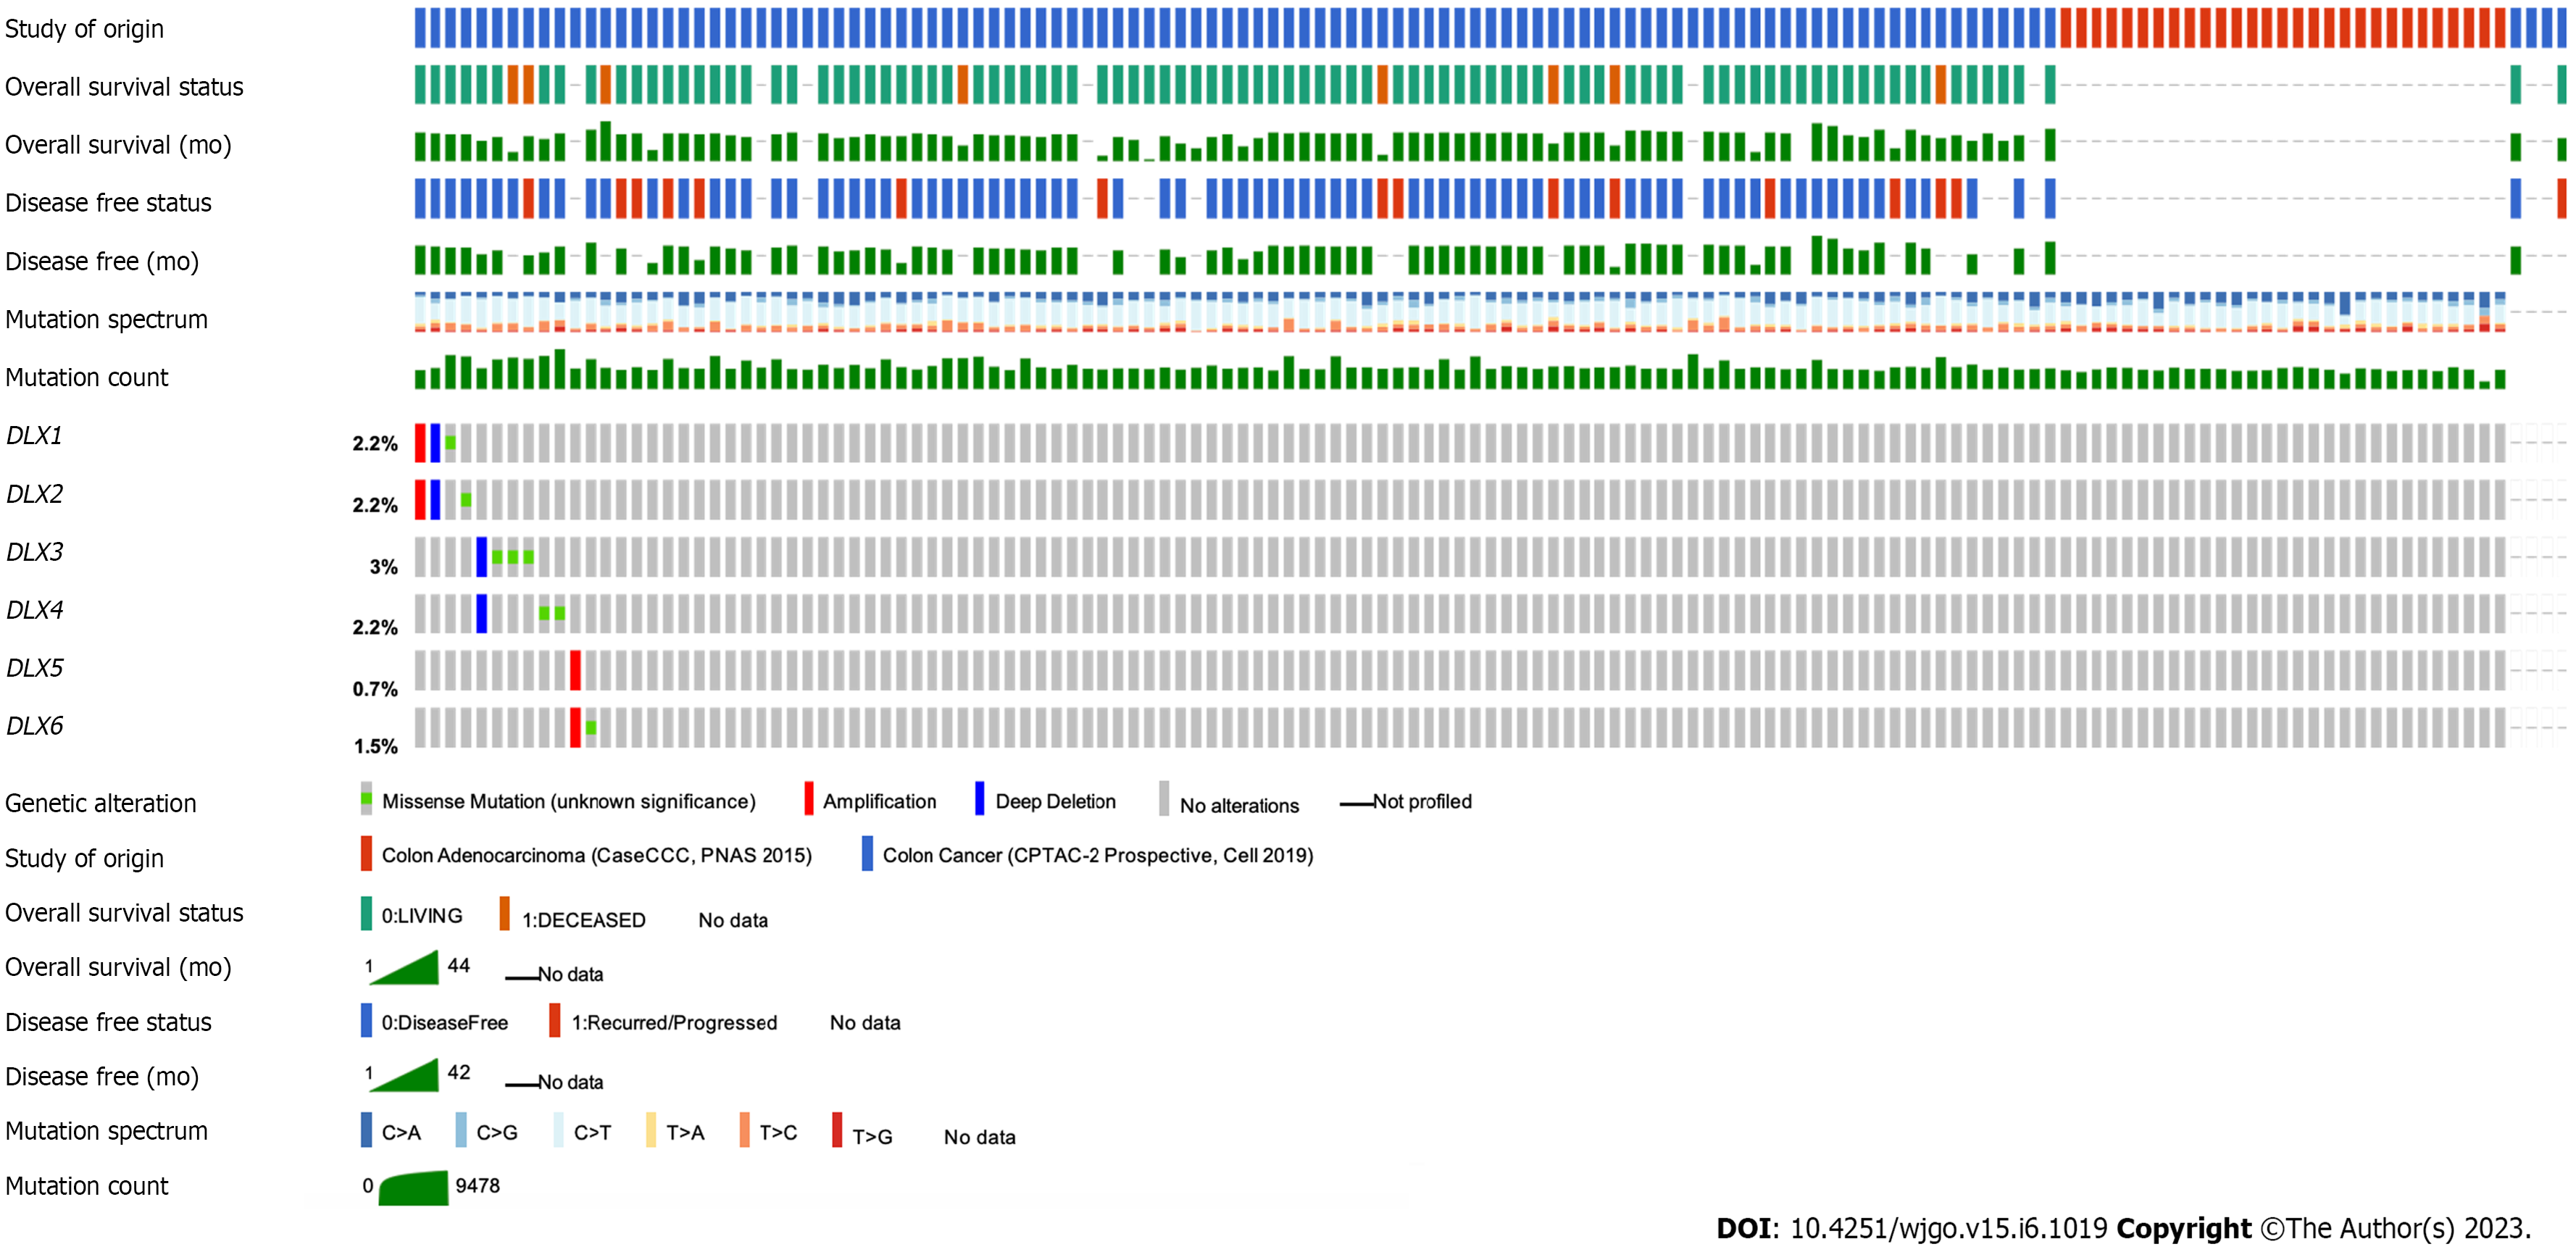
Figure 1 mRNA expression of distal-less homeobox genes in colon adenocarcinoma in cBioPortal (RNA Seq V2 RSEM).
DLX: Distal-less homeobox.
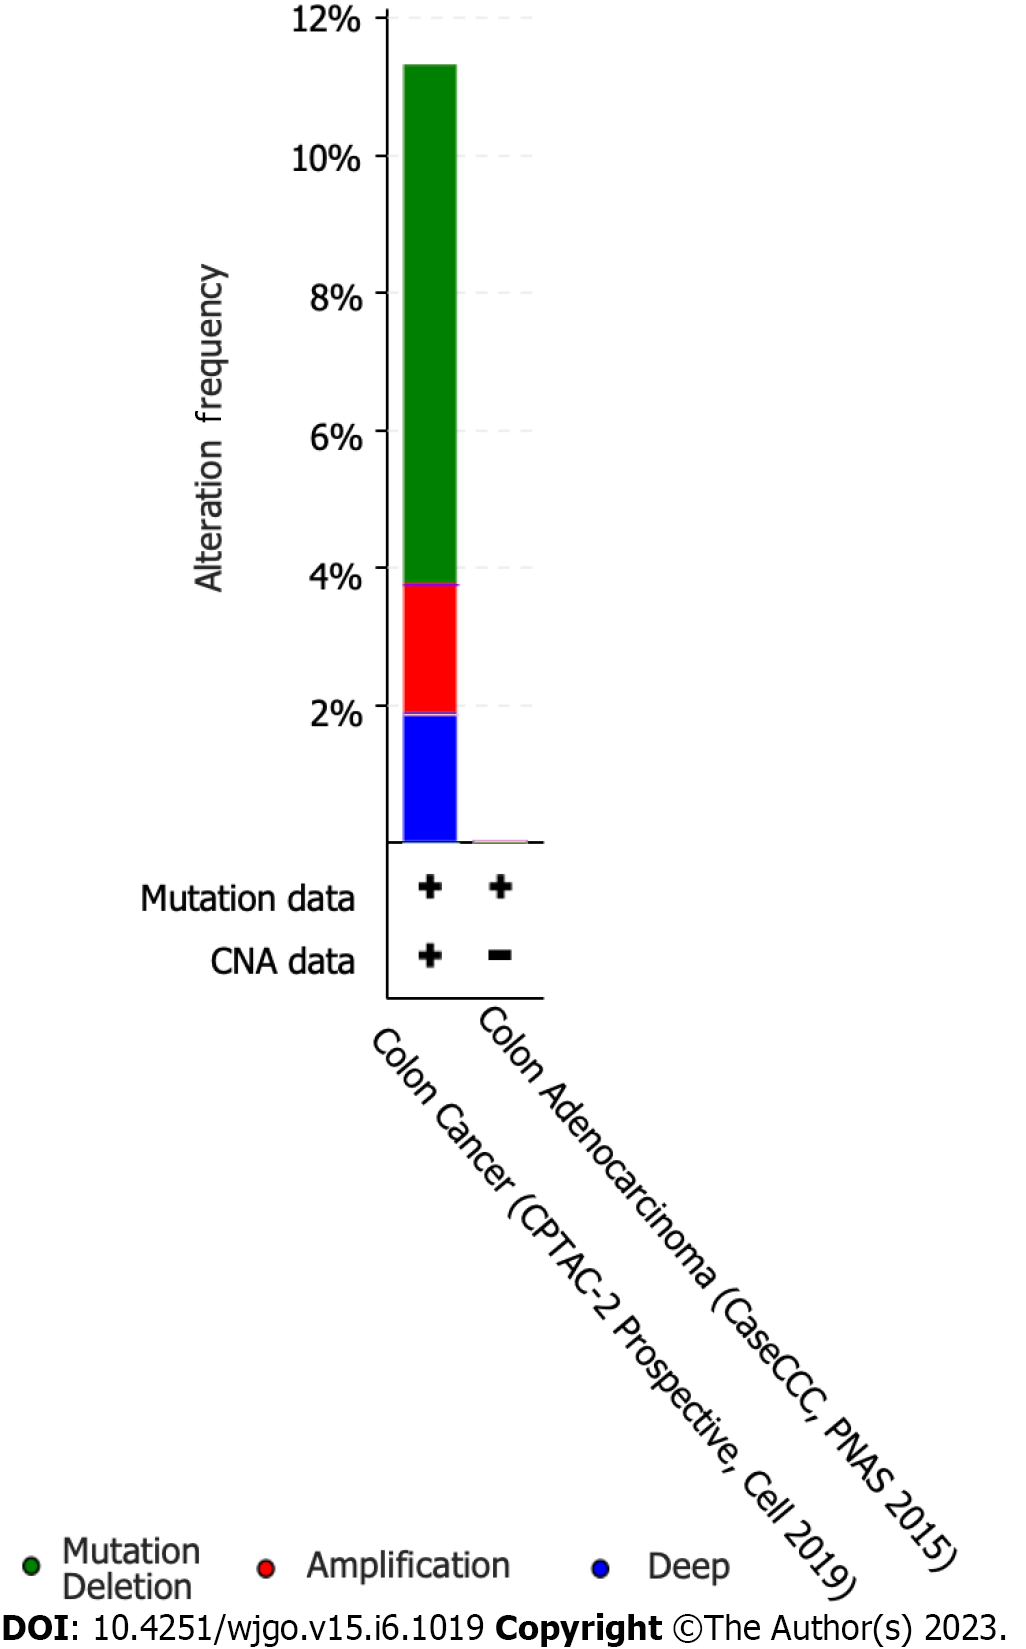
Figure 2 Percentage of distal-less homeobox genes in colon adenocarcinoma cases calculated using the cancer type summary in cBioPortal.
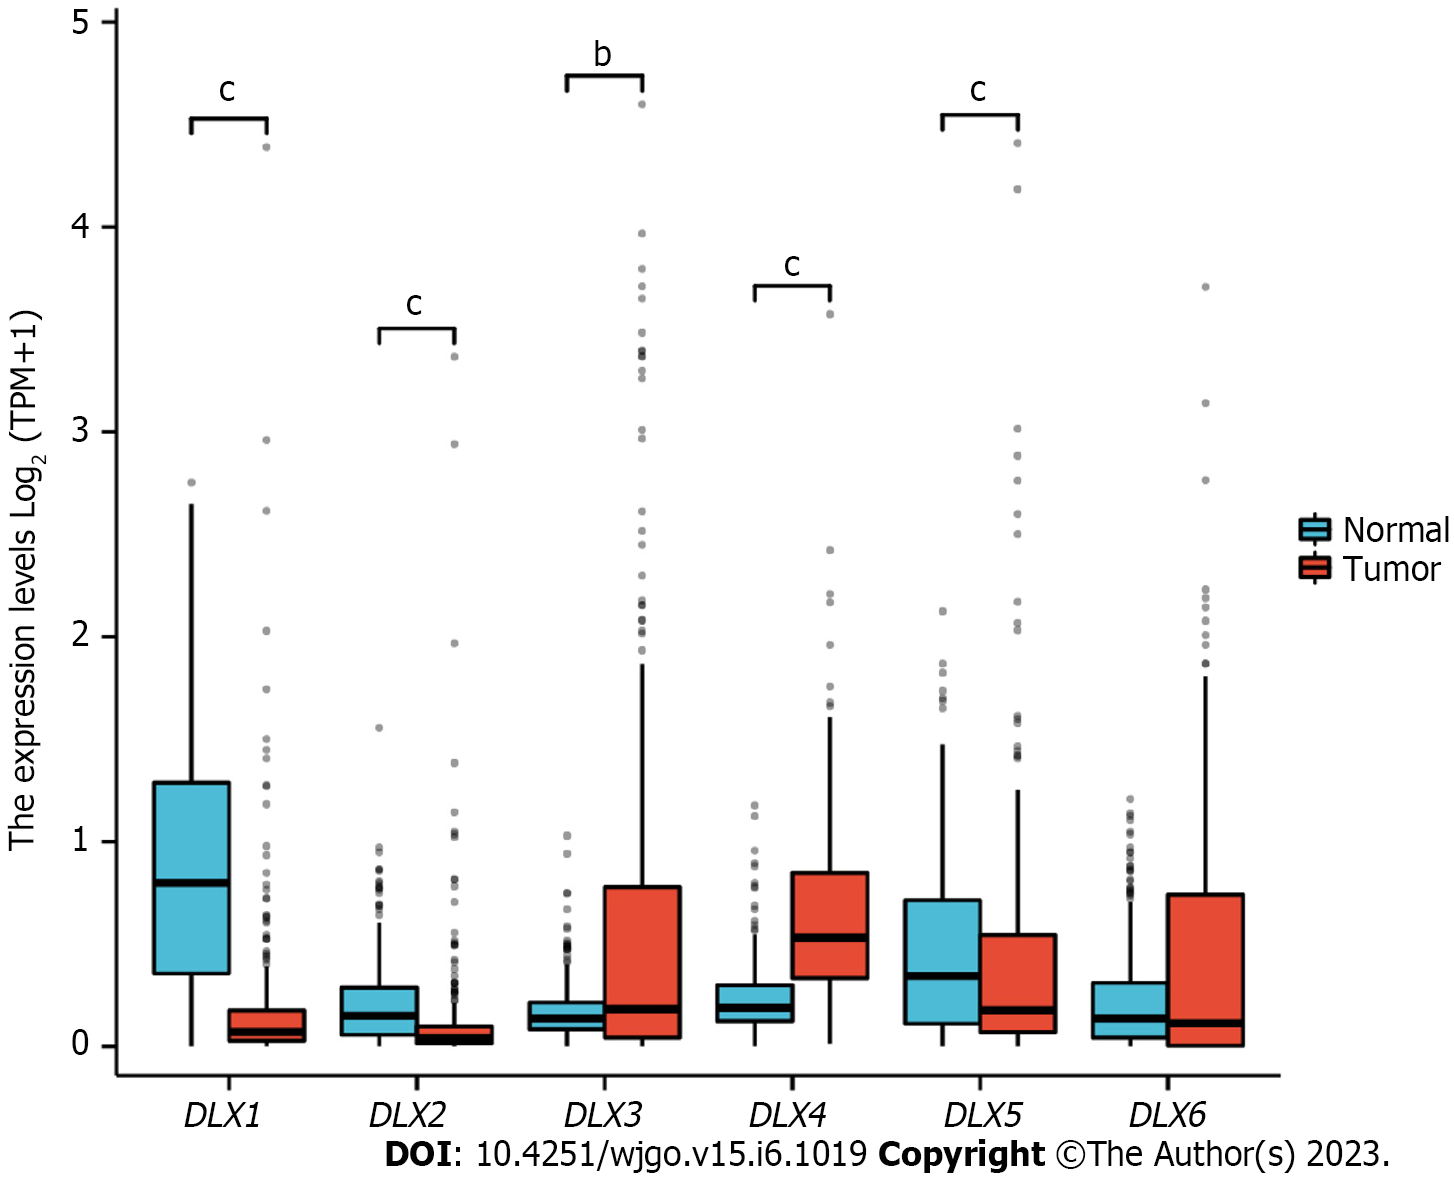
Figure 3 mRNA levels of distal-less homeobox genes between colon adenocarcinoma tissue and unpaired normal stomach tissue in the Cancer Genome Atlas.
bP < 0.01; cP < 0.001. DLX: Distal-less homeobox.
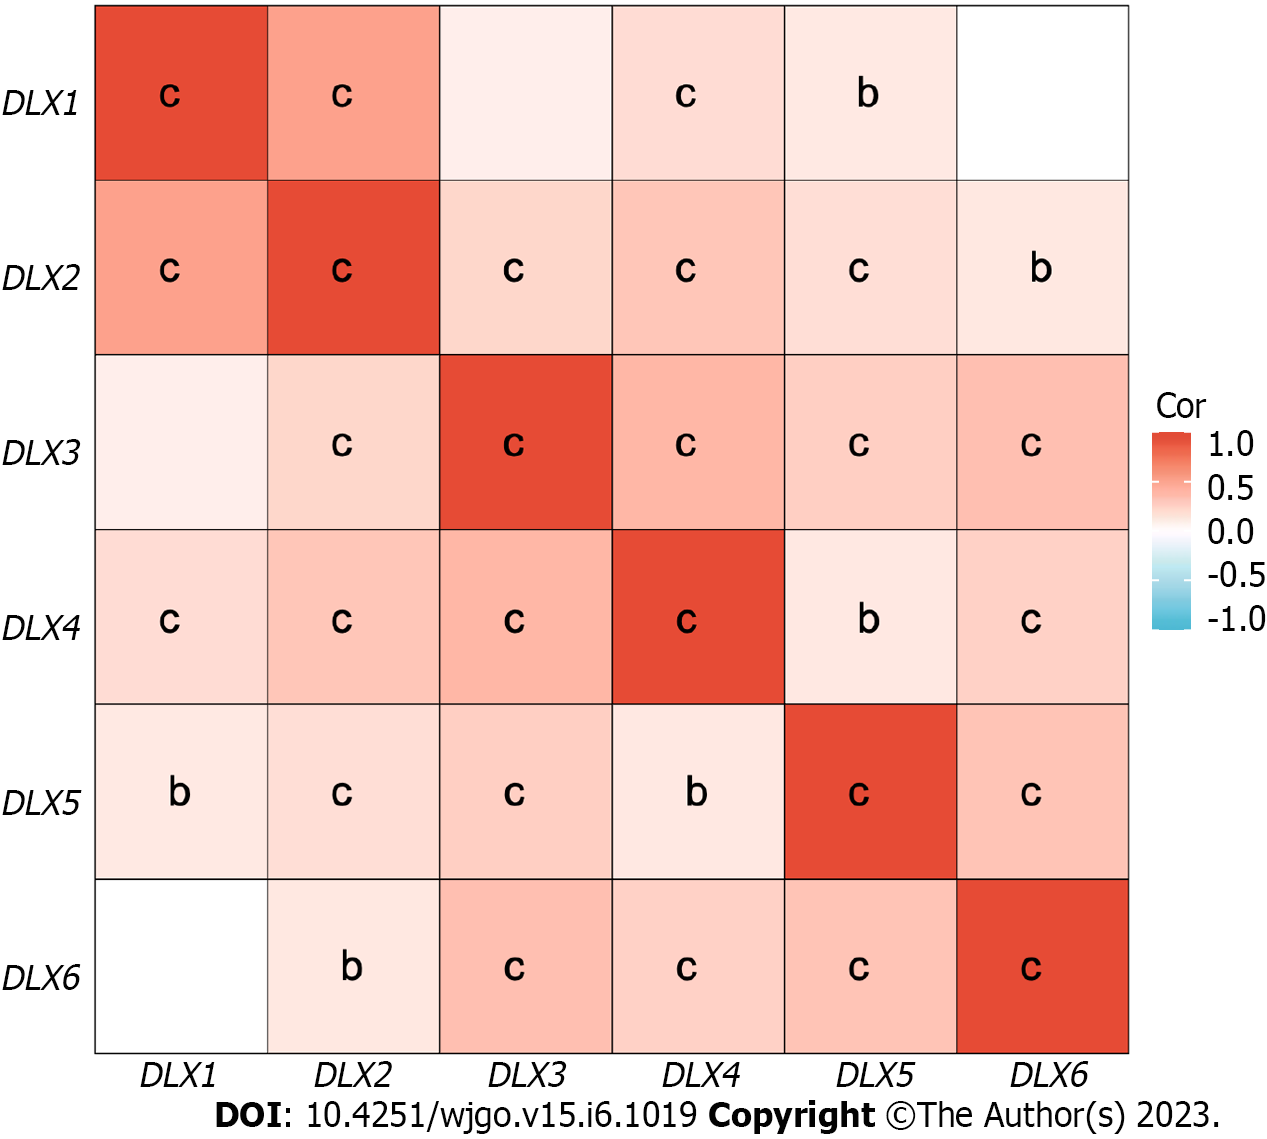
Figure 4 Correlation between every two genes of distal-less homeobox genes in colon adenocarcinoma.
bP < 0.01; cP < 0.001. DLX: Distal-less homeobox.
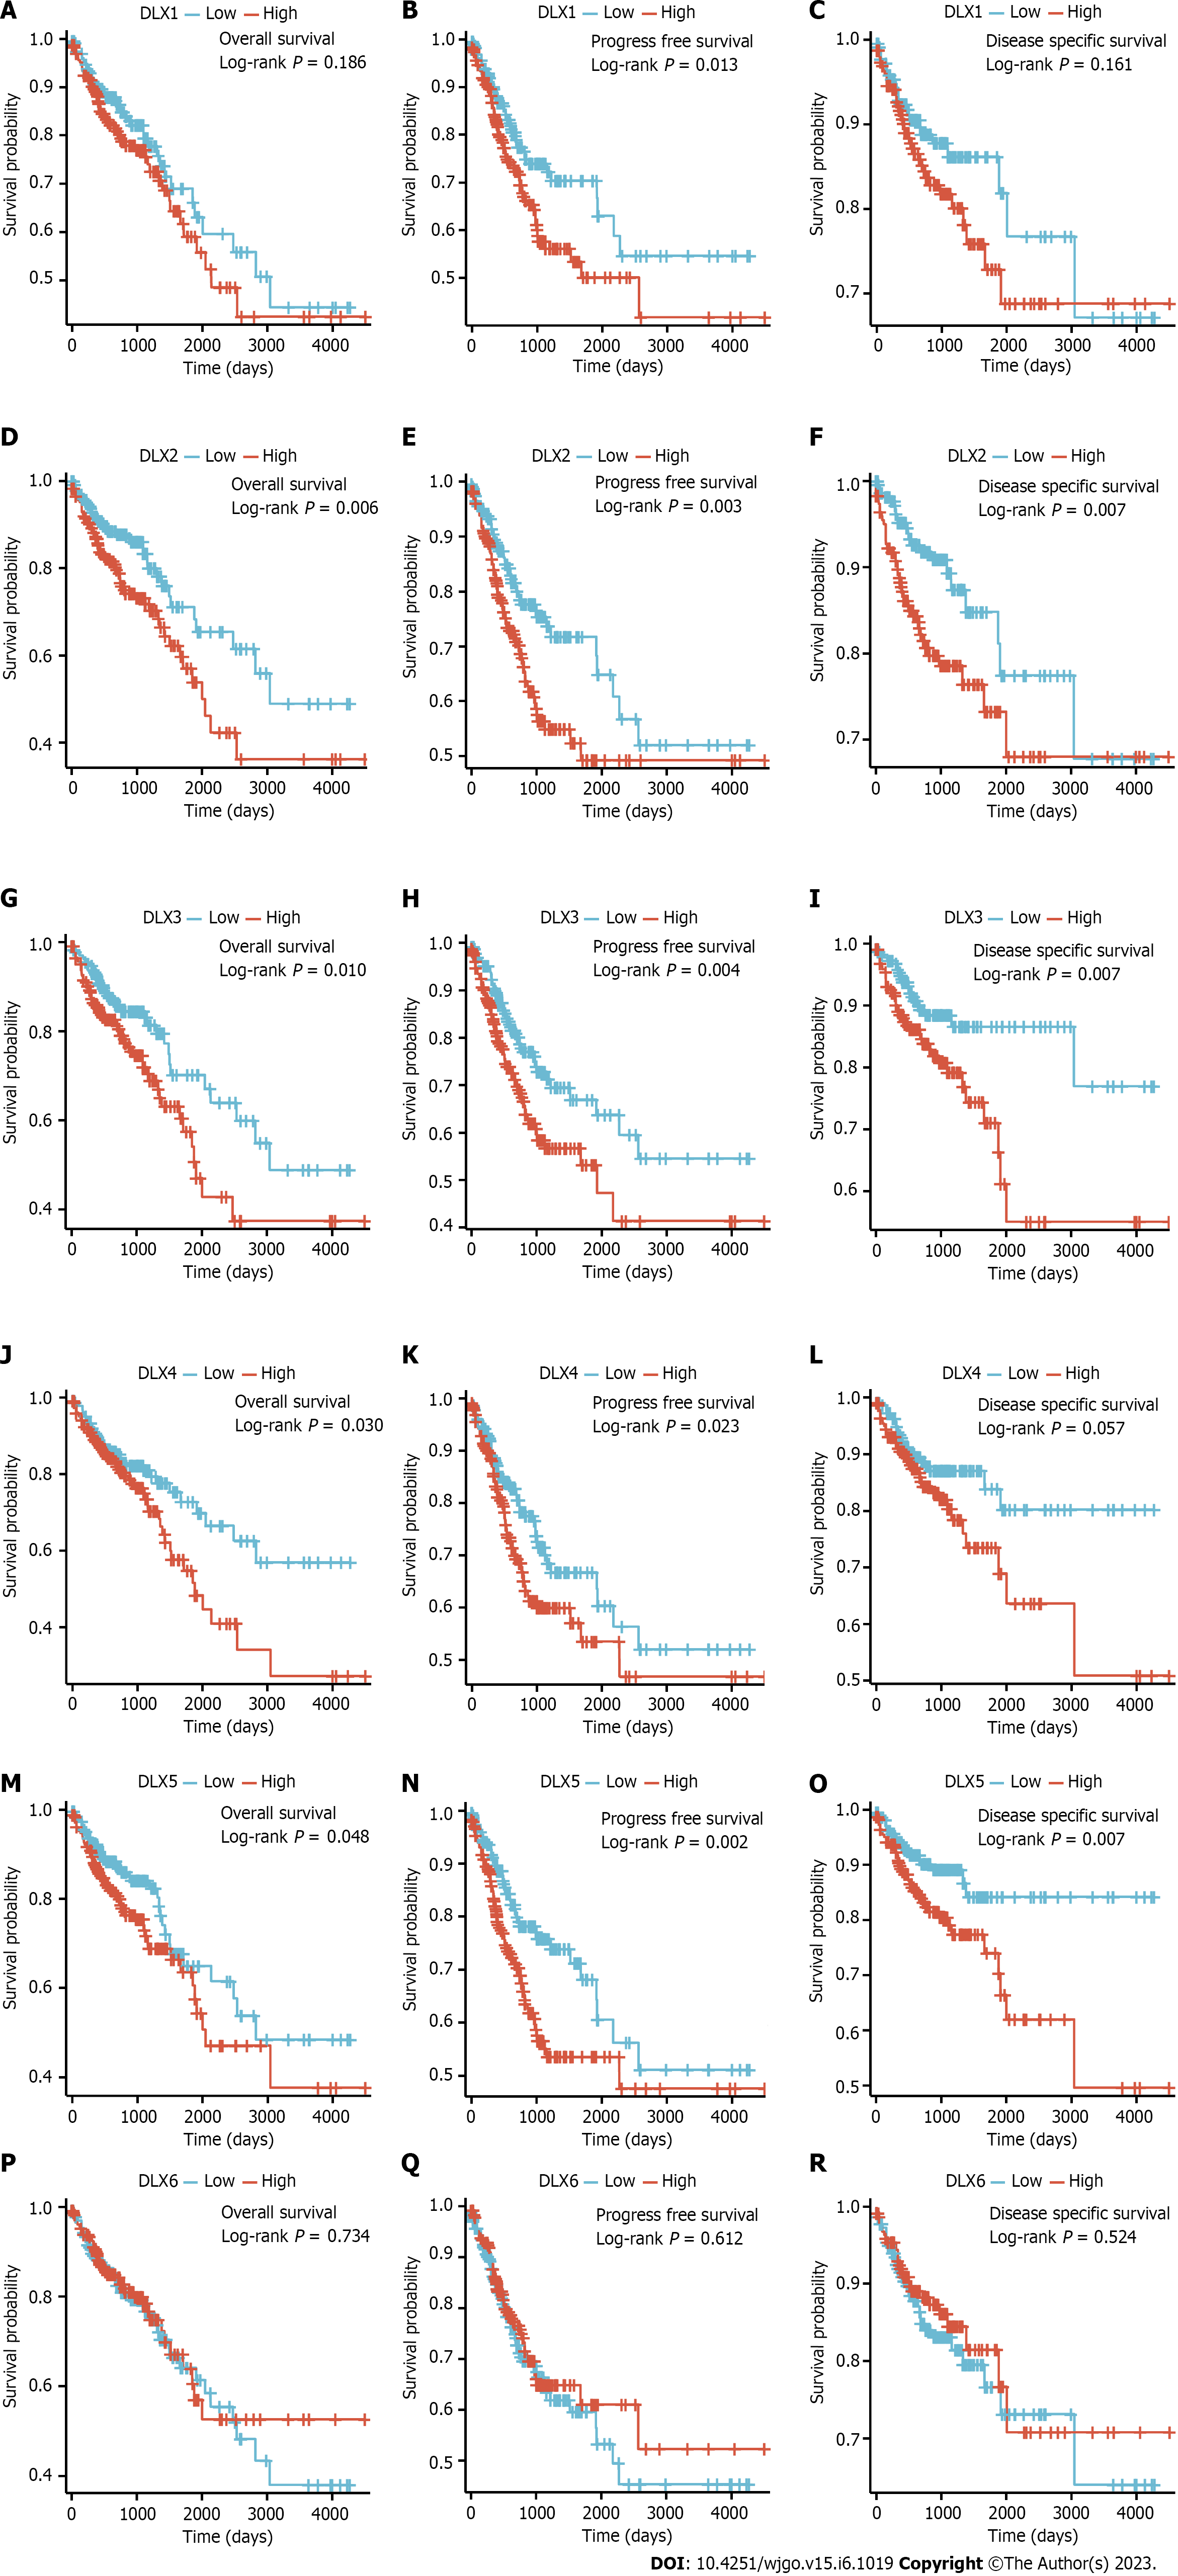
Figure 5 Survival analysis results for distal-less homeobox genes.
A: Overall survival (OS) of distal-less homeobox (DLX)1; B: Progression-free survival (PFS) of DLX1; C: Disease specific survival (DSS) of DLX1; D: OS of DLX2; E: PFS of DLX2; F: DSS of DLX2; G: OS of DLX3; H: PFS of DLX3; I: DSS of DLX3; J: OS of DLX4; K: PFS of DLX4; L: DSS of DLX4; M: OS of DLX5; N: PFS of DLX5; O: DSS of DLX5; P: OS of DLX6; Q: PFS of DLX6; R: DSS of DLX6. DLX: Distal-less homeobox.
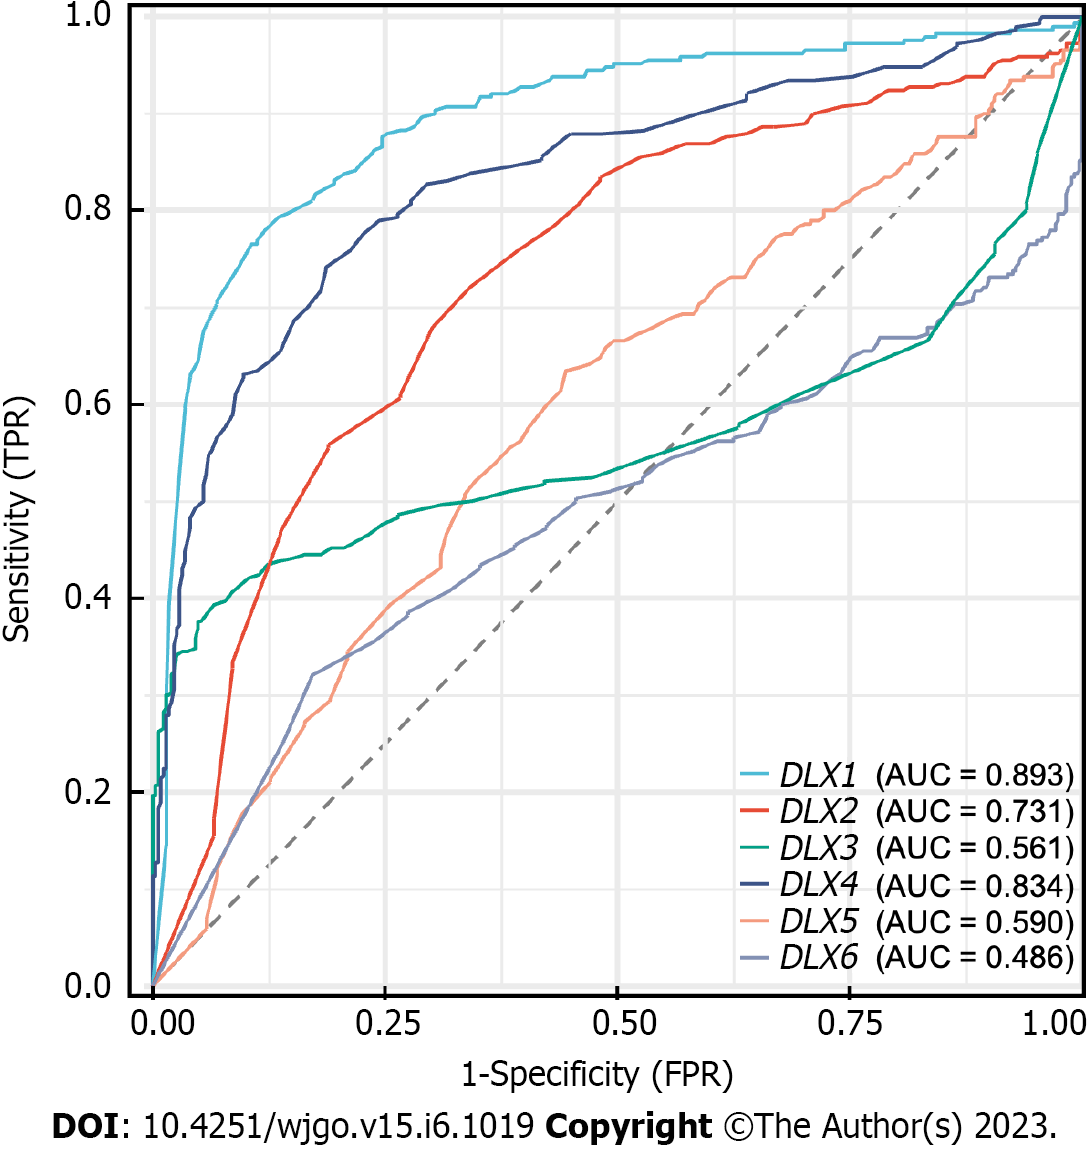
Figure 6 Receiver operating characteristic curves of distal-less homeobox genes in colon adenocarcinoma and normal colon tissues.
The area under the receiver operating characteristic curve is between 0.5 and 1. The closer the area under the curve (AUC) is to 1, the better the diagnosis. the AUC is between 0.5 and 0.7 with low accuracy, the AUC is between 0.7 and 0.9 with some accuracy, and the AUC is above 0.9 with high accuracy. AUC: Area under the curve; DLX: Distal-less homeobox; FPR: False positive rate; TPR: True positive rate.
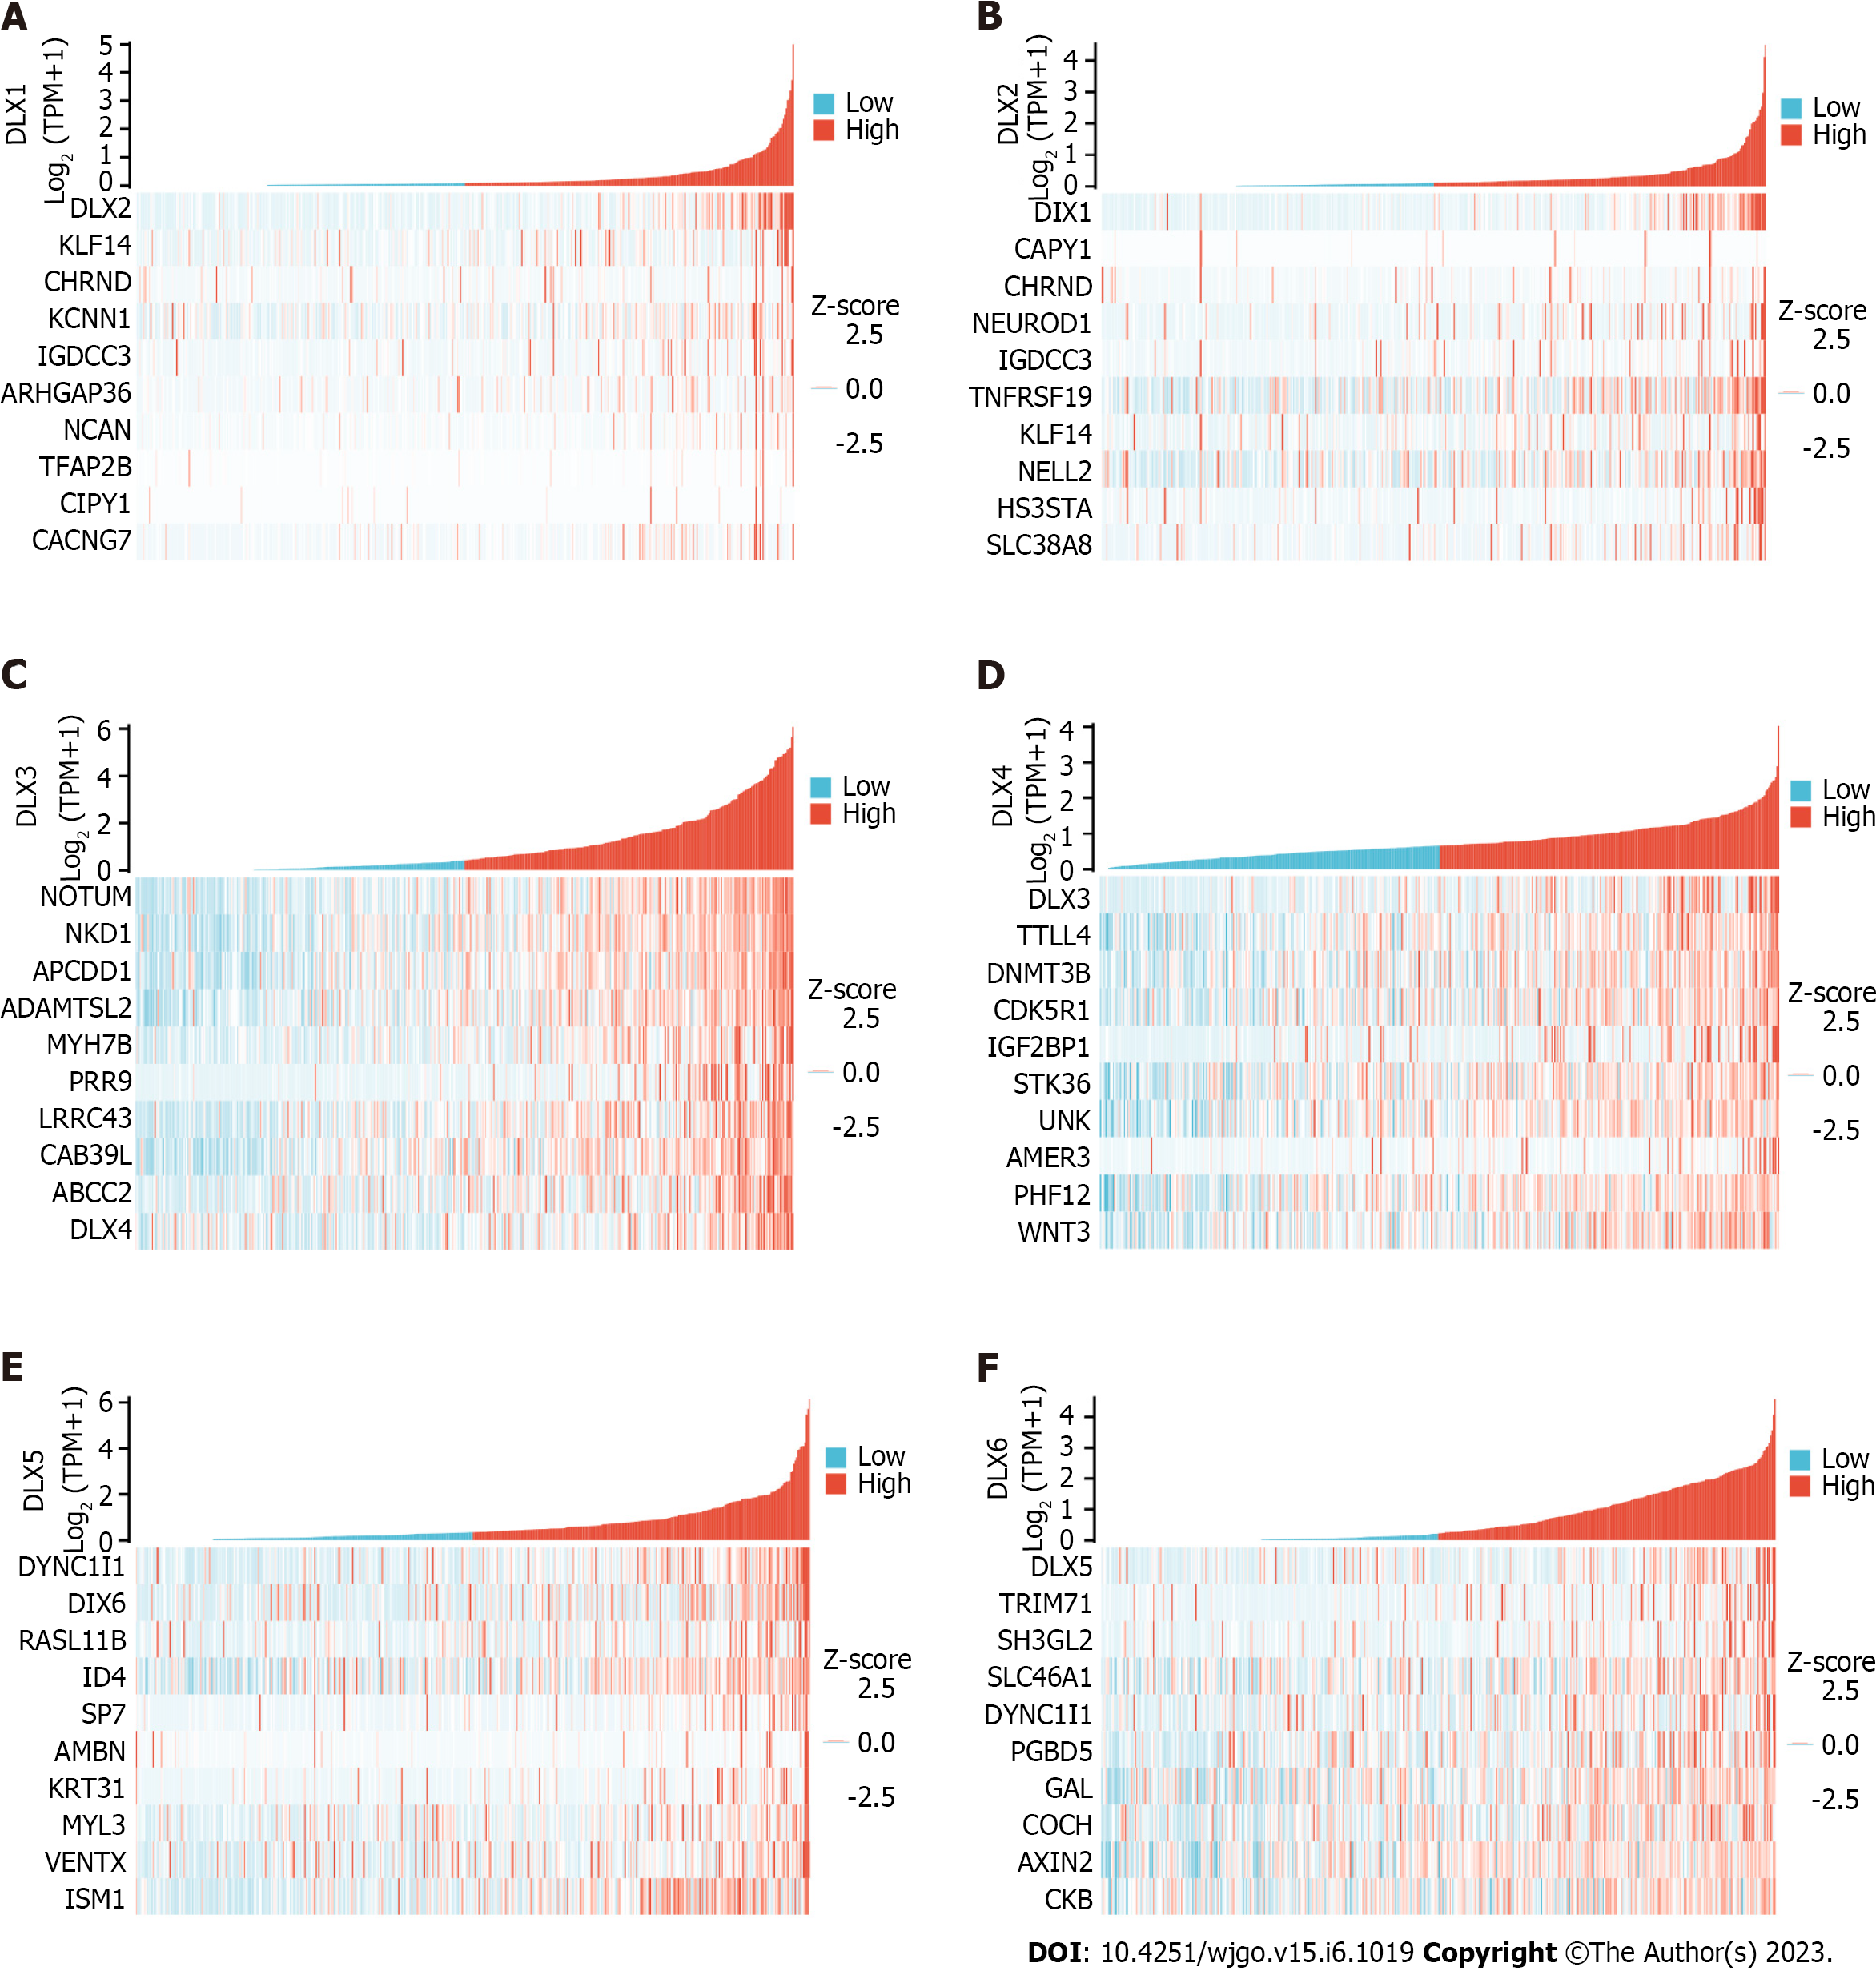
Figure 7 Heatmap plot of top 10 correlated genes to distal-less homeobox genes.
A: Distal-less homeobox (DLX)1; B: DLX2; C: DLX3; D: DLX4; E: DLX5; F: DLX6. DLX: Distal-less homeobox.
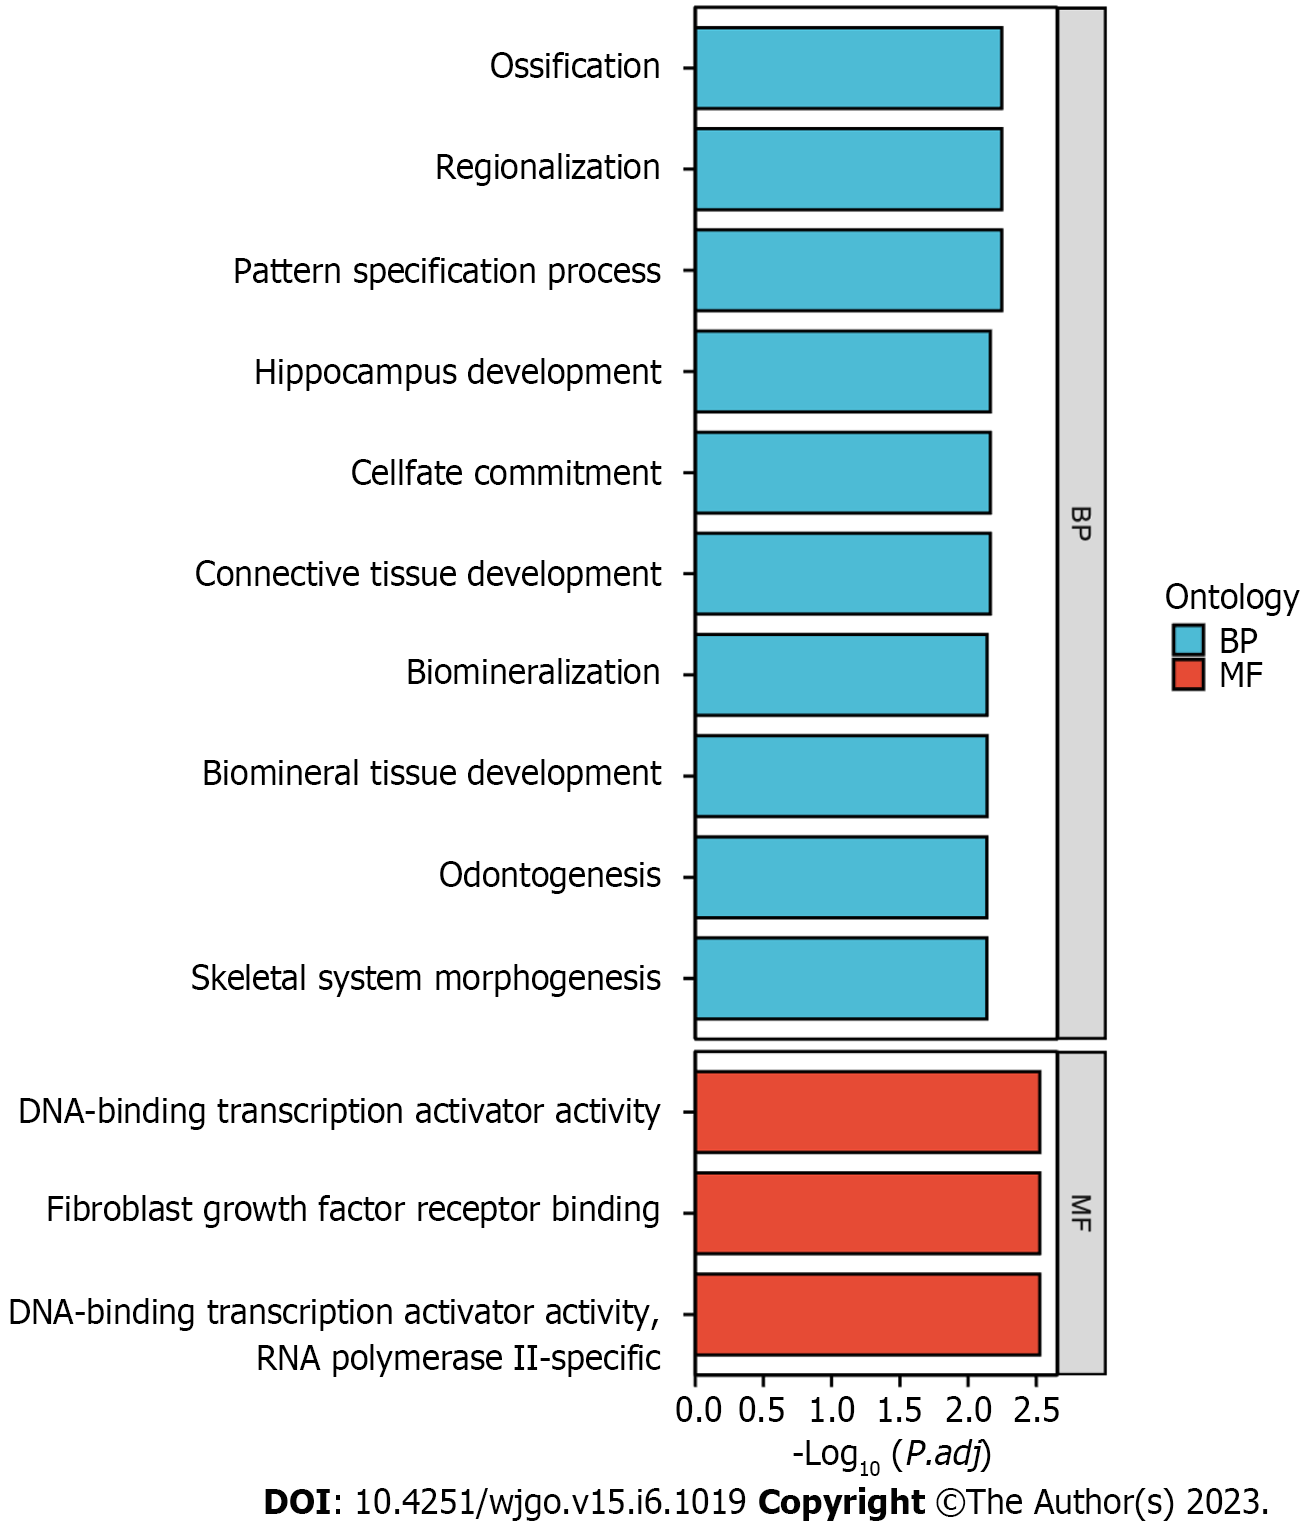
Figure 8 Gene Ontology analysis of genes associated with distal-less homeobox genes.
BP: Biological process; MF: Molecular function.
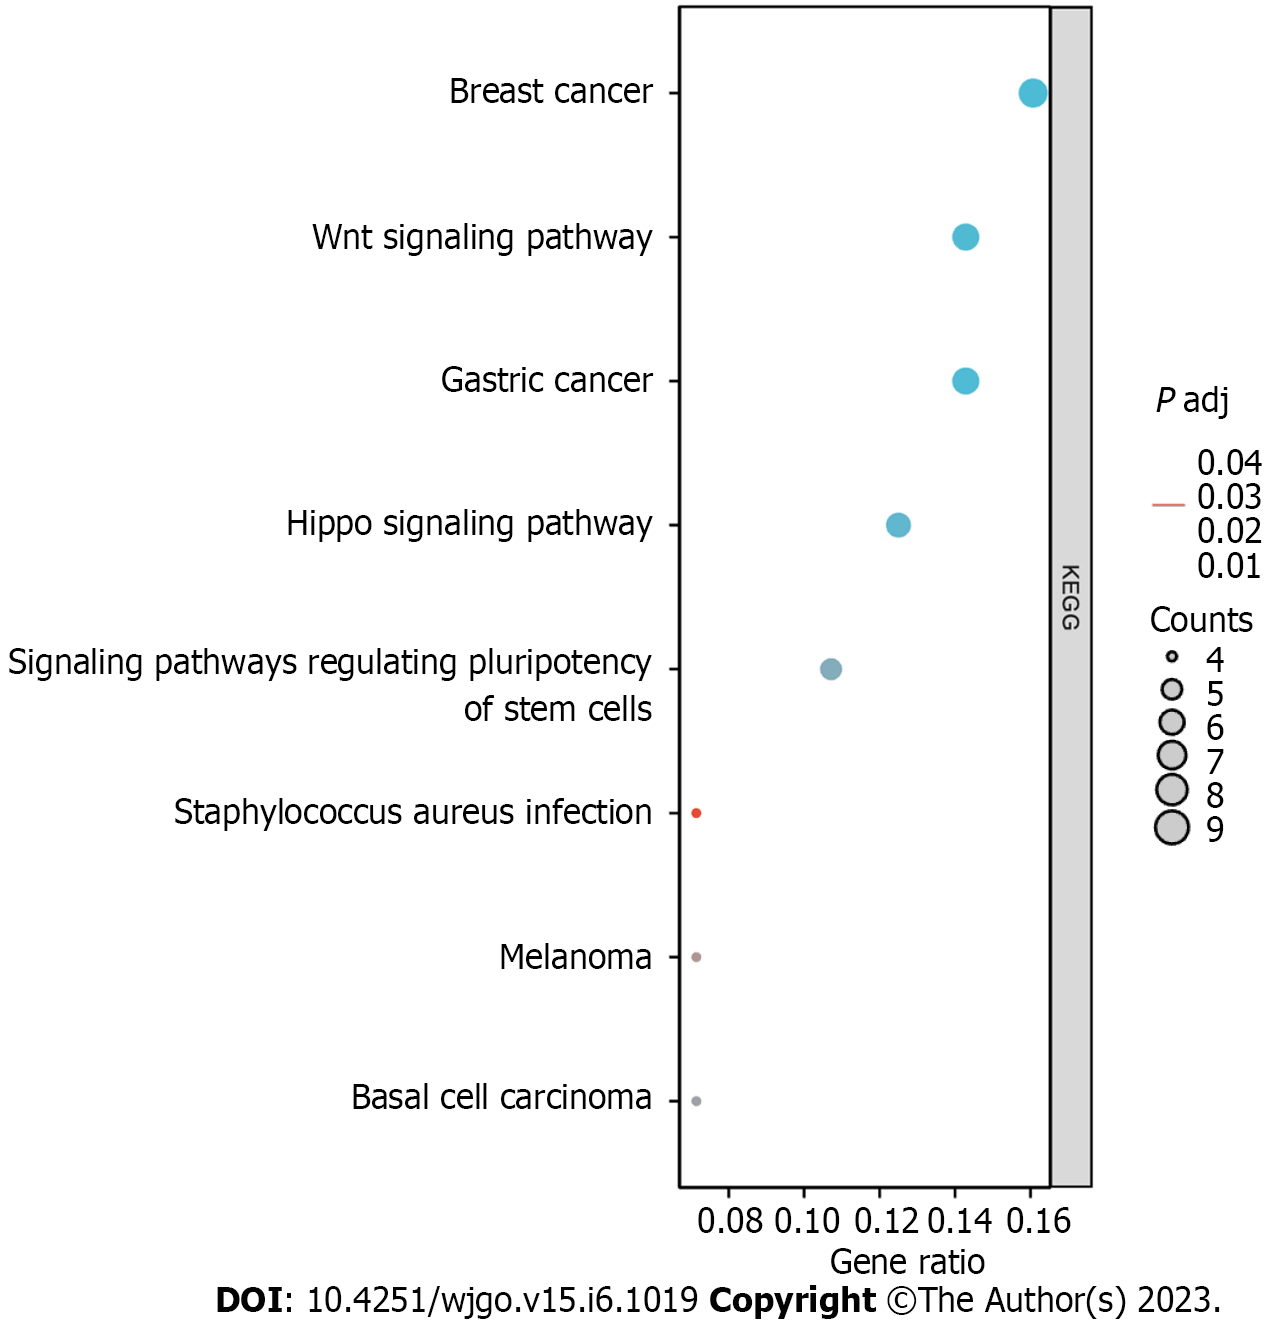
Figure 9 Kyoto Encyclopedia of Genes and Genomes analysis of genes associated with distal-less homeobox genes.
KEGG: Kyoto Encyclopedia of Genes and Genomes.
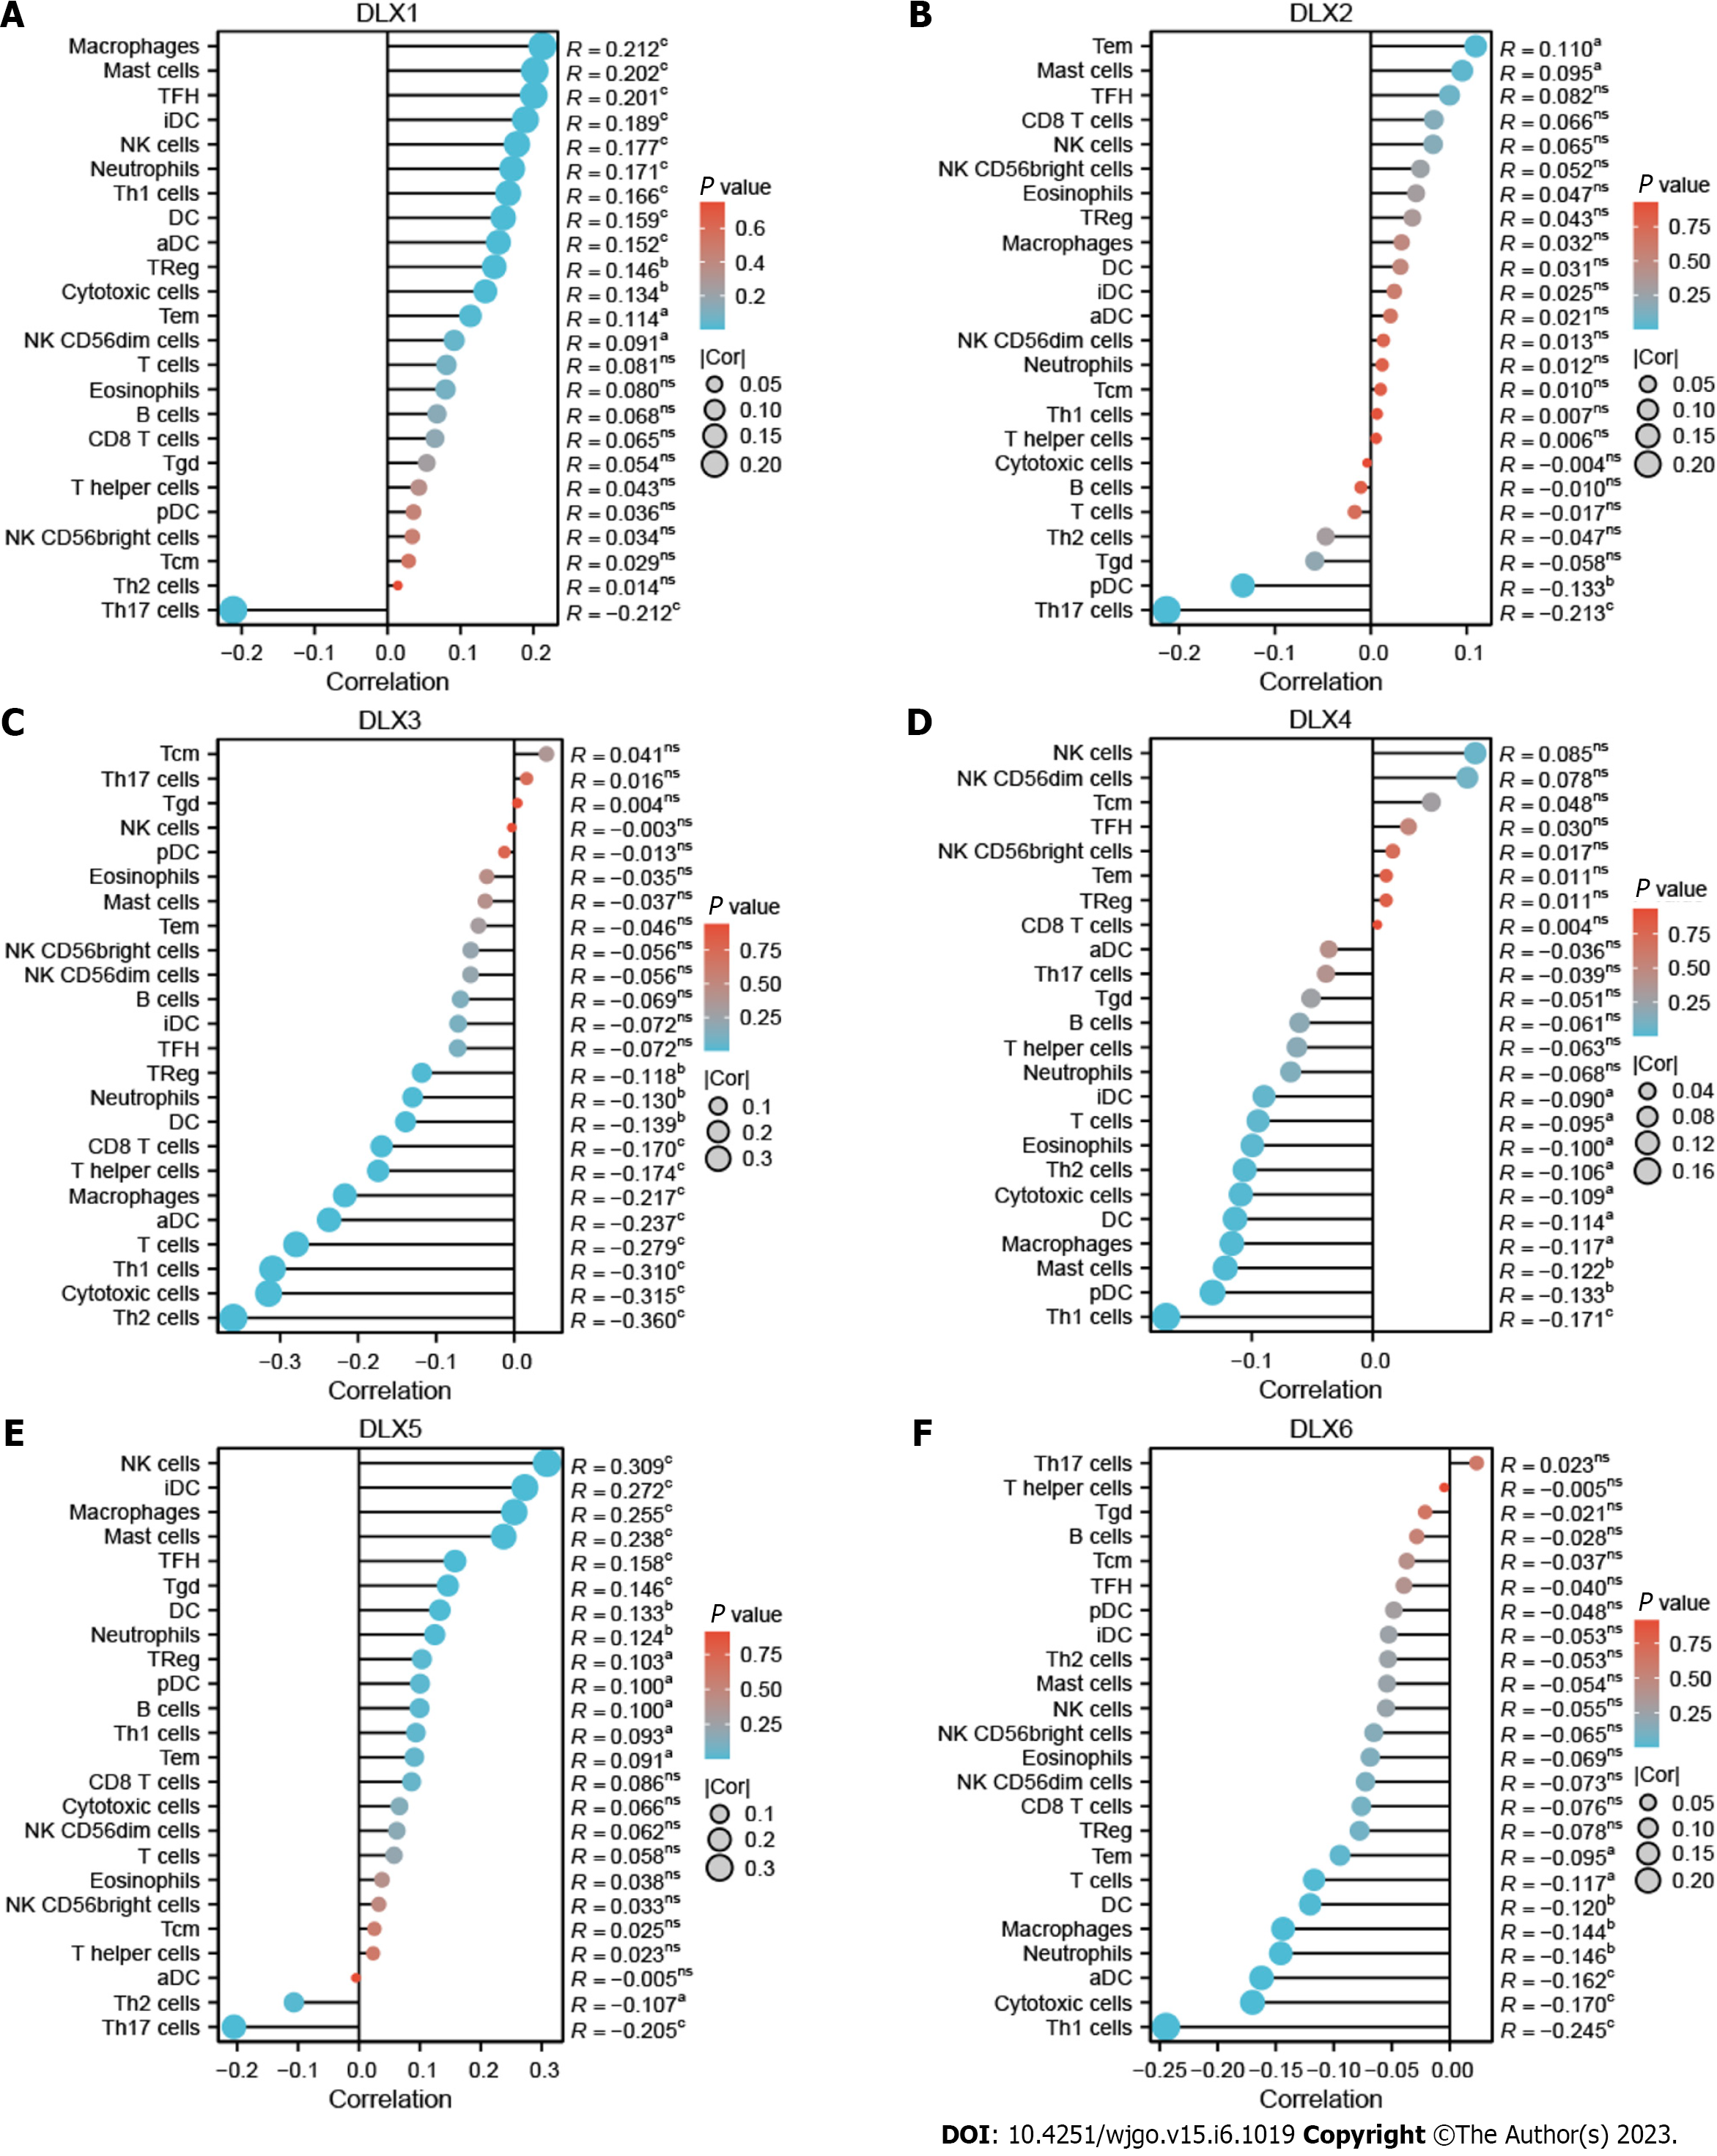
Figure 10 Correlation between the expression of each distal-less homeobox gene and the 24 tumor-infiltrating immune cells of colon adenocarcinoma (lollipop plot).
In the color bar, the darker the color, the smaller the P-value, indicating a higher statistical significance. The bubble size represents the correlation value, the larger the bubble, the larger the correlation value. A: Correlation between distal-less homeobox (DLX1) expression and immune infiltration; B: Correlation between DLX2 expression and immune infiltration; C: Correlation between DLX3 expression and immune infiltration; D: Correlation between DLX4 expression and immune infiltration; E: Correlation between DLX5 expression and immune infiltration; F: Correlation between DLX6 expression and immune infiltration. aP < 0.05; bP < 0.01; cP < 0.001. aDC: Activated dendritic cell; DC: Dendritic cell; DLX: Distal-less homeobox; iDC: Immature dendritic cell; NK: Natural killer; Tcm: T central memory; Tem: T effector memory; TFH: T follicular helper; Tgd: T gamma delta; Th: T helper.
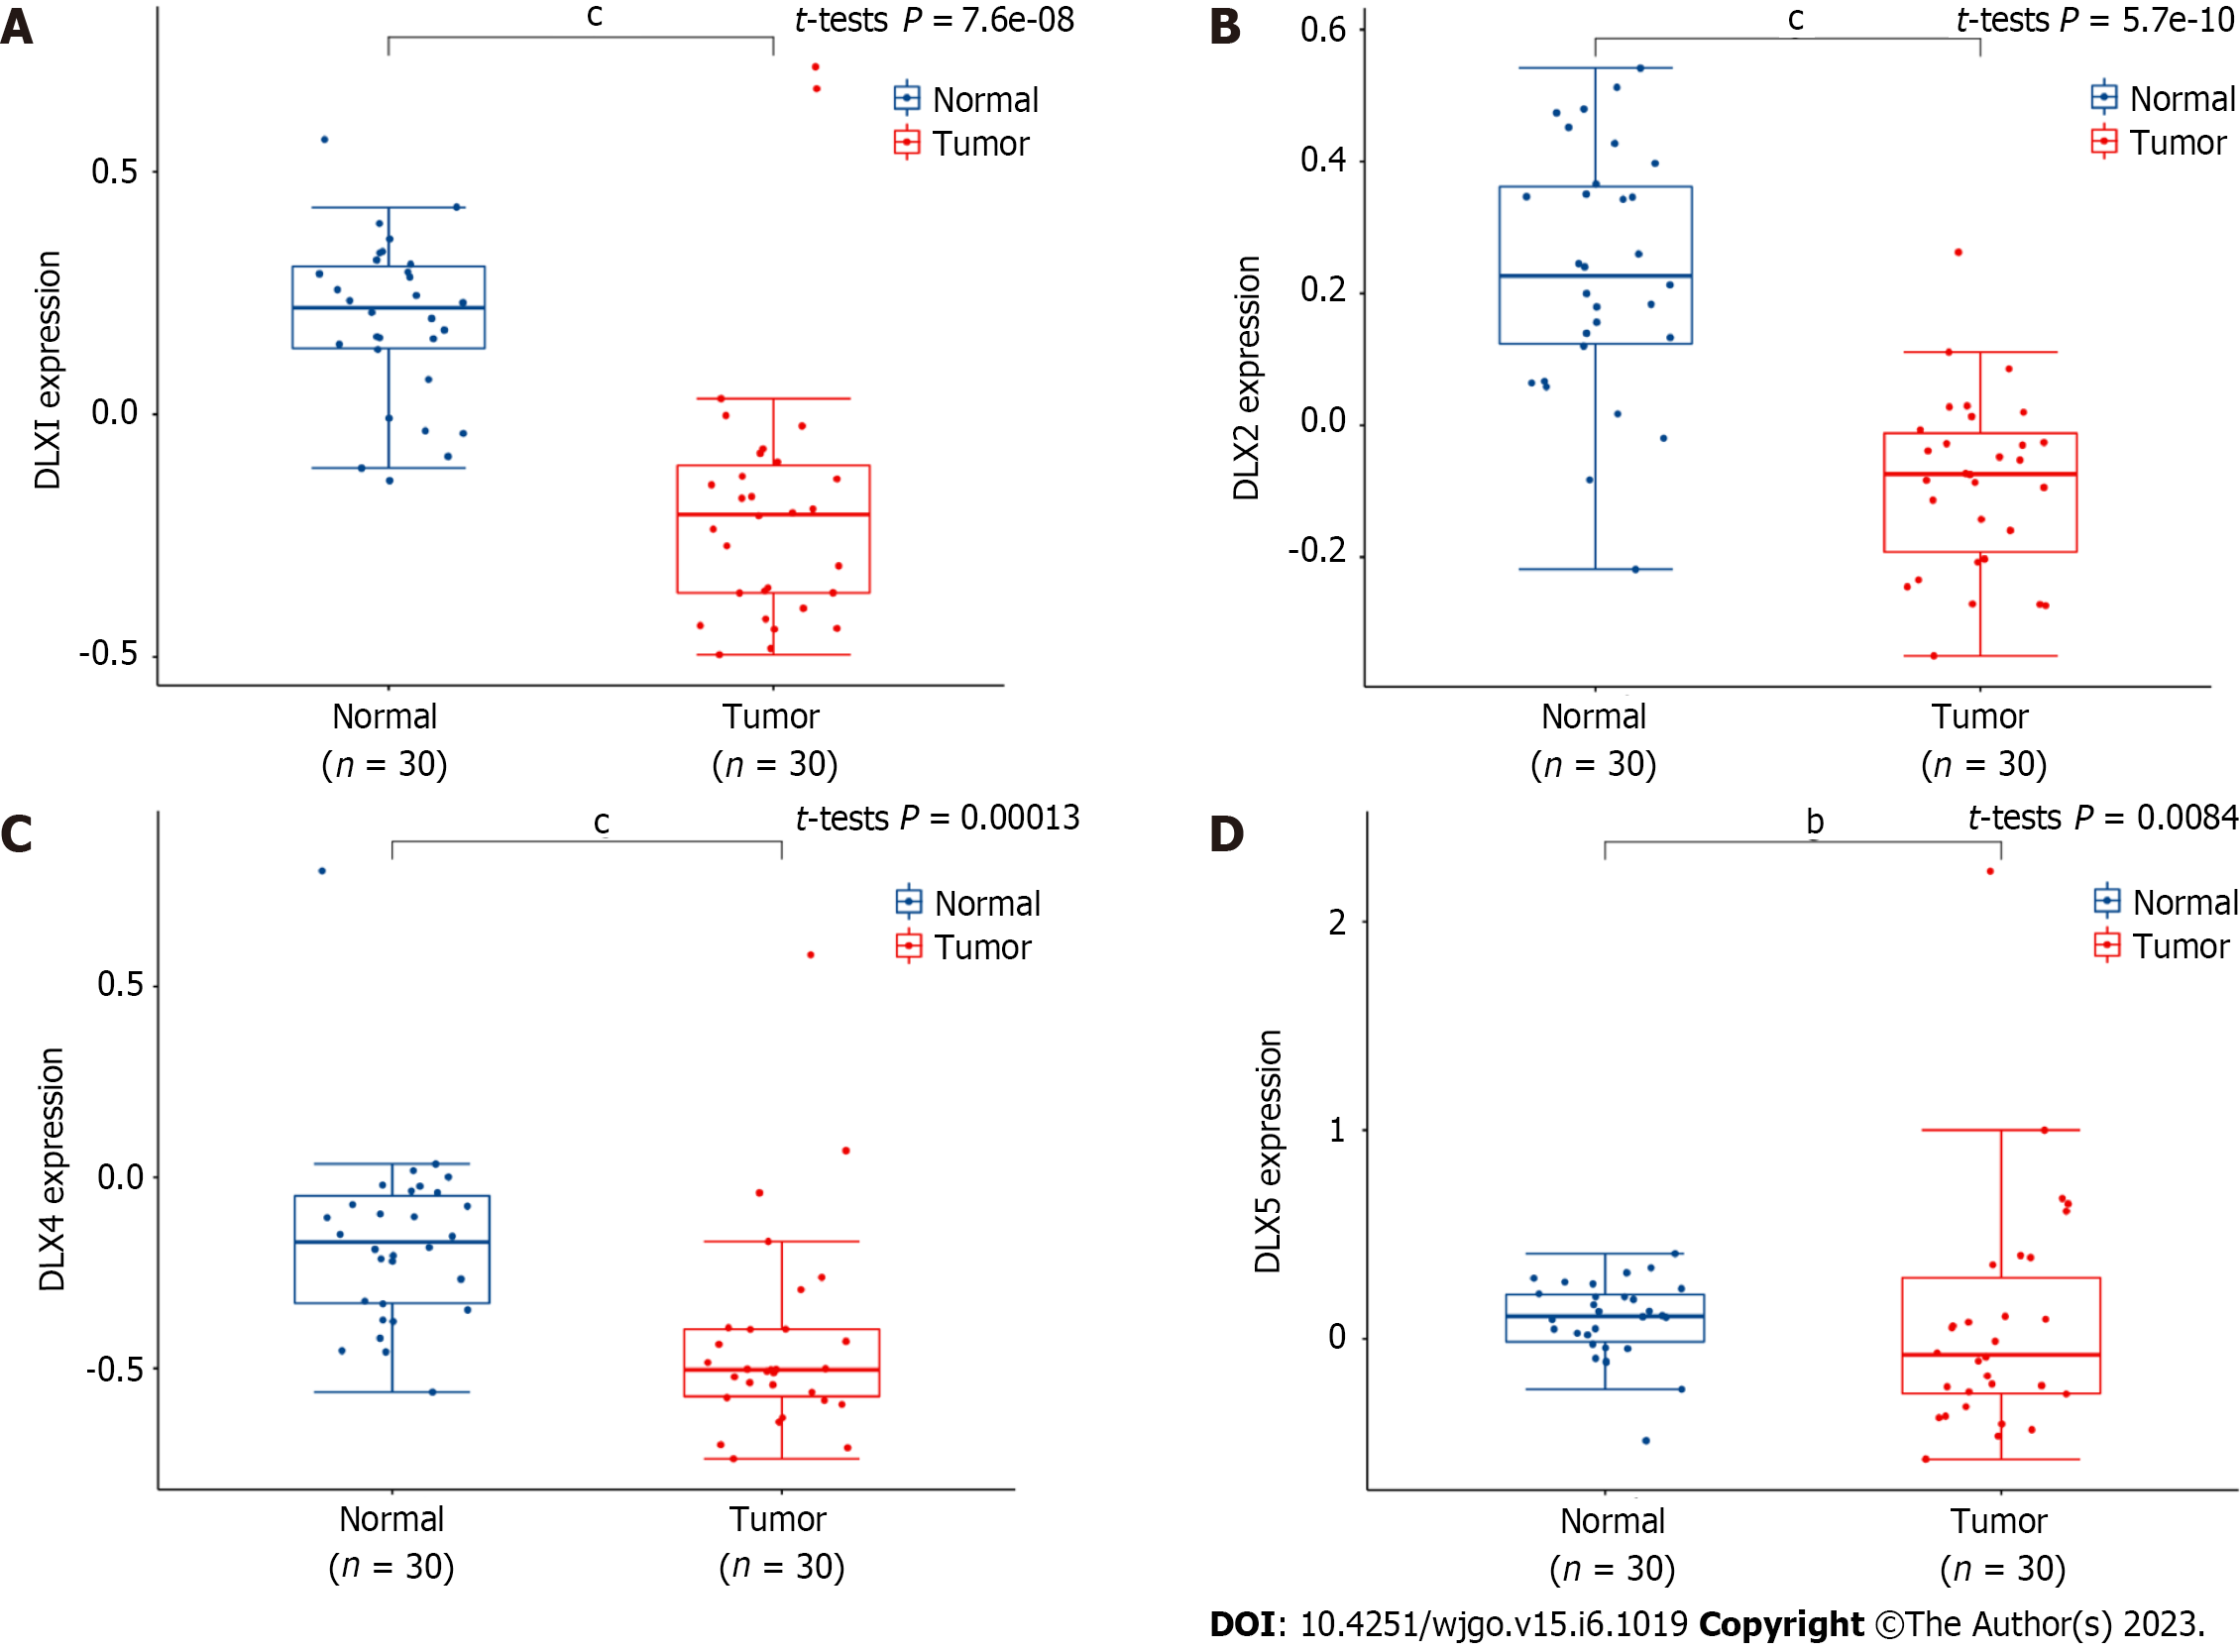
Figure 11 Differential expression of distal-less homeobox genes in colon adenocarcinoma and normal colon tissues (GSE74062).
A: Distal-less homeobox (DLX)1; B: DLX2; C: DLX4; D: DLX5. bP < 0.01; cP < 0.001. DLX: Distal-less homeobox.
- Citation: Chen YC, Li DB, Wang DL, Peng H. Comprehensive analysis of distal-less homeobox family gene expression in colon cancer. World J Gastrointest Oncol 2023; 15(6): 1019-1035
- URL: https://www.wjgnet.com/1948-5204/full/v15/i6/1019.htm
- DOI: https://dx.doi.org/10.4251/wjgo.v15.i6.1019


