Copyright
©The Author(s) 2023.
World J Gastrointest Oncol. Mar 15, 2023; 15(3): 372-388
Published online Mar 15, 2023. doi: 10.4251/wjgo.v15.i3.372
Published online Mar 15, 2023. doi: 10.4251/wjgo.v15.i3.372
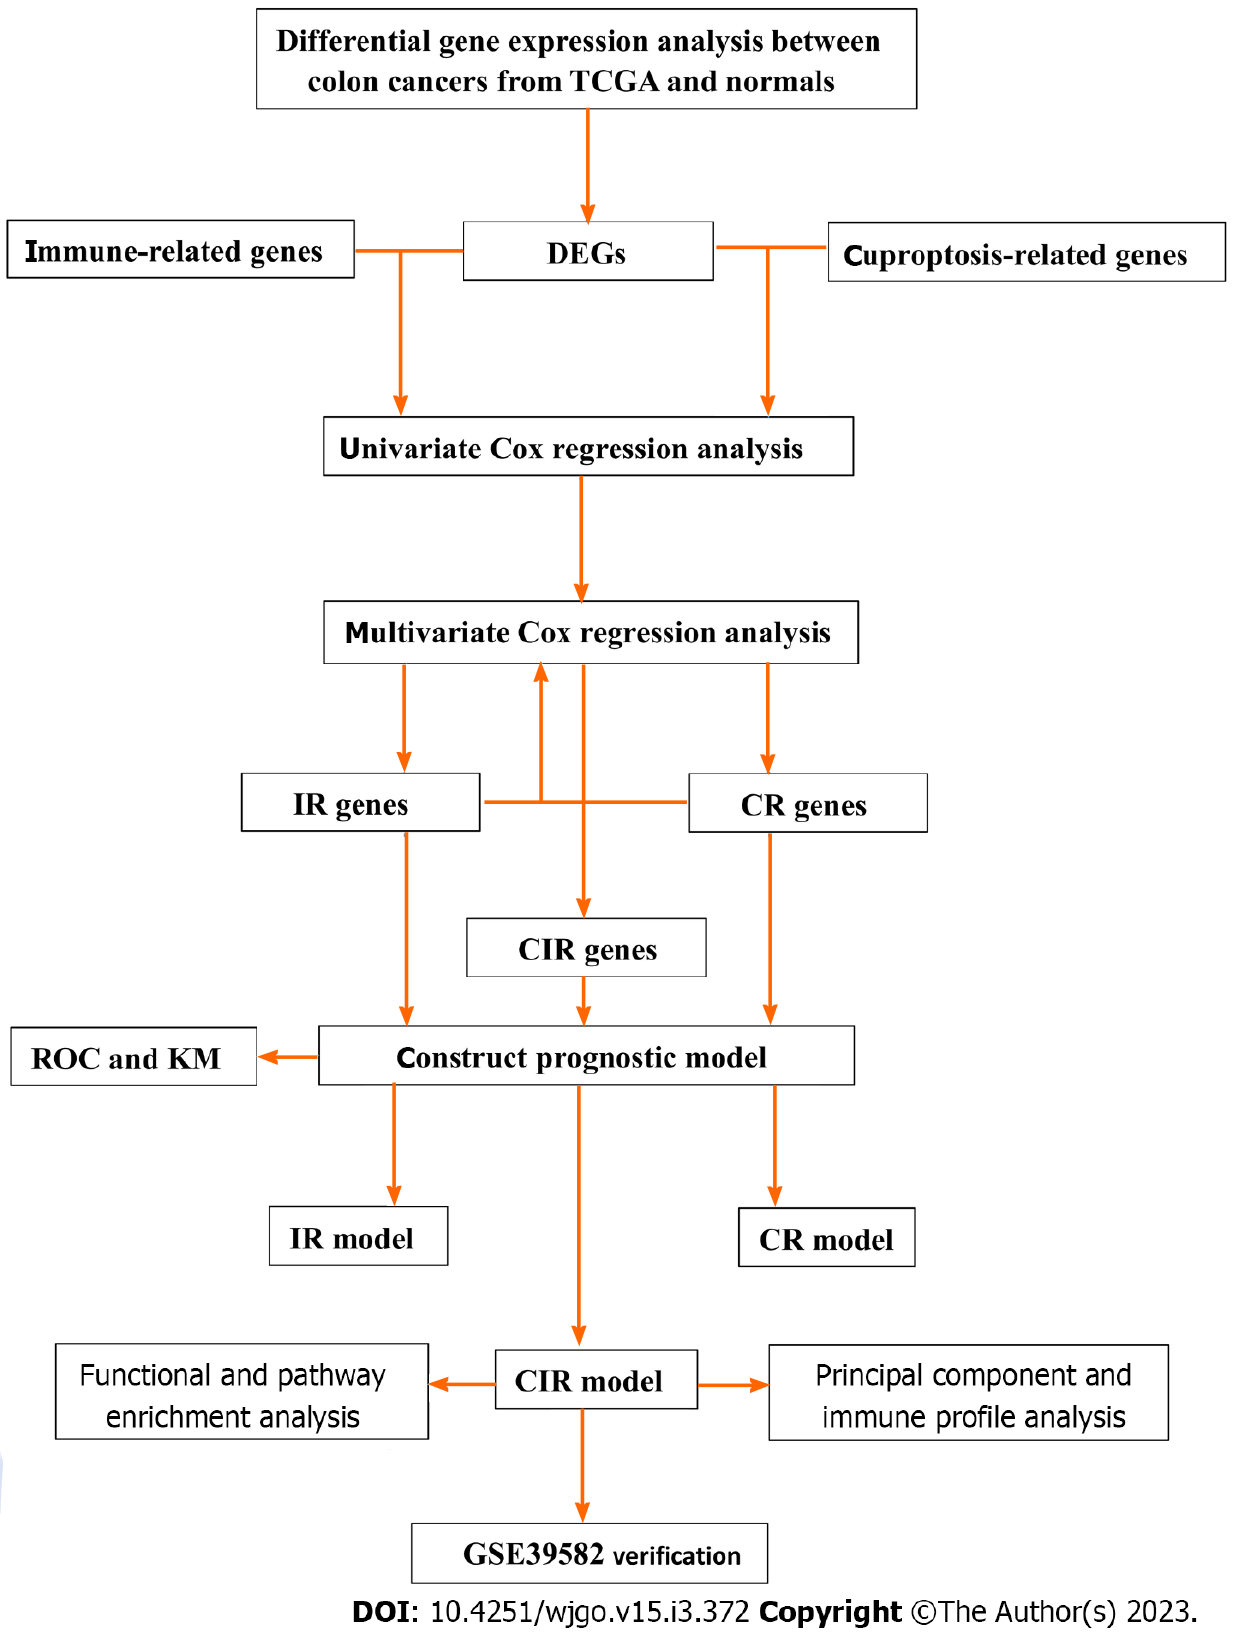
Figure 1 Brief flowchart of the study.
CR: Cuproptosis-related; DEG: Differentially expressed gene; IR: Immune-related; ROC: Receiver operating characteristic; TCGA: The Cancer Genome Atlas.
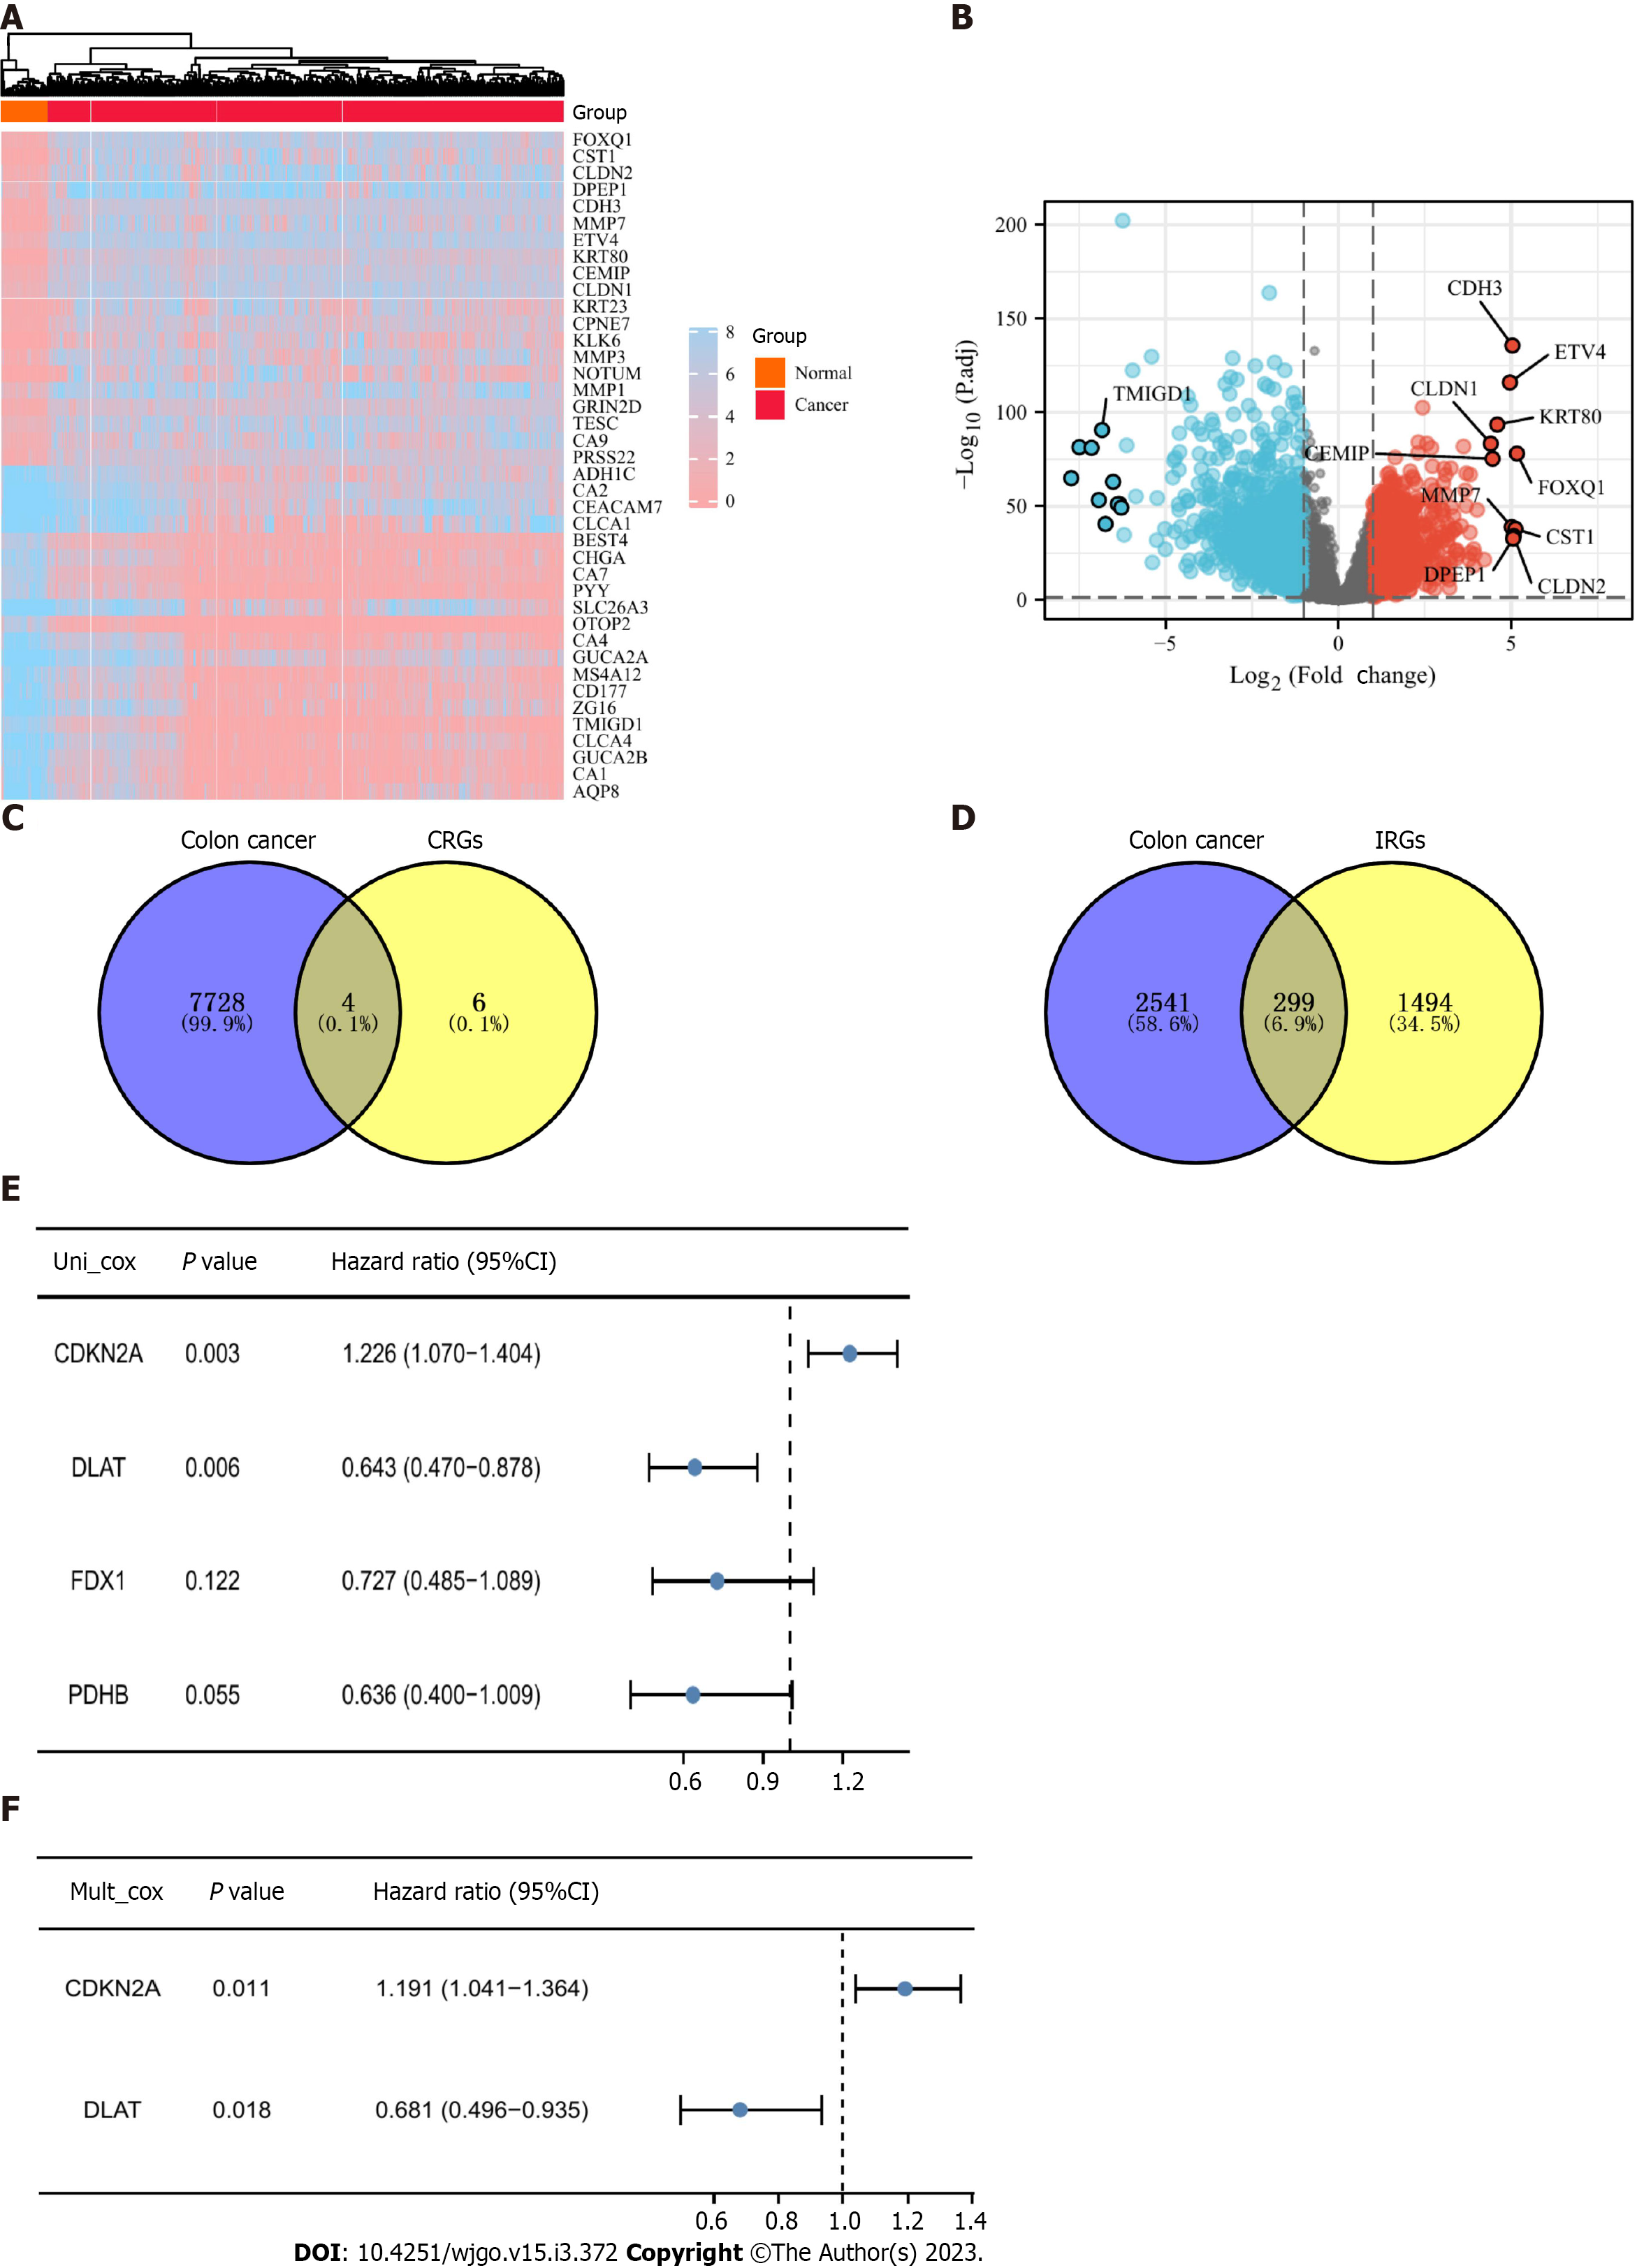
Figure 2 Acquisition of cuproptosis-related and immune-related differentially expressed genes.
A: Heatmap of differentially expressed genes in The Cancer Genome Atlas colon cancer patients compared with normal controls; B: Volcano plot of differentially expressed genes (DEGs), where blue represents downregulated genes and red represents upregulated genes; C: Four cuproptosis-related DEGs (CR-DEGs) were calculated by taking the intersection of DEGs (fold change > 1.2 and P.adjust < 0.05) and CRGs; D: DEGs with |log2FC| > 1 and p.adjust < 0.05 were intersected with immune-related genes (IRGs) to obtain IR-DEGs; E: Result of univariate Cox regression analysis of CR-DEGs; F: The result of multivariate Cox regression analysis of CR-DEGs.
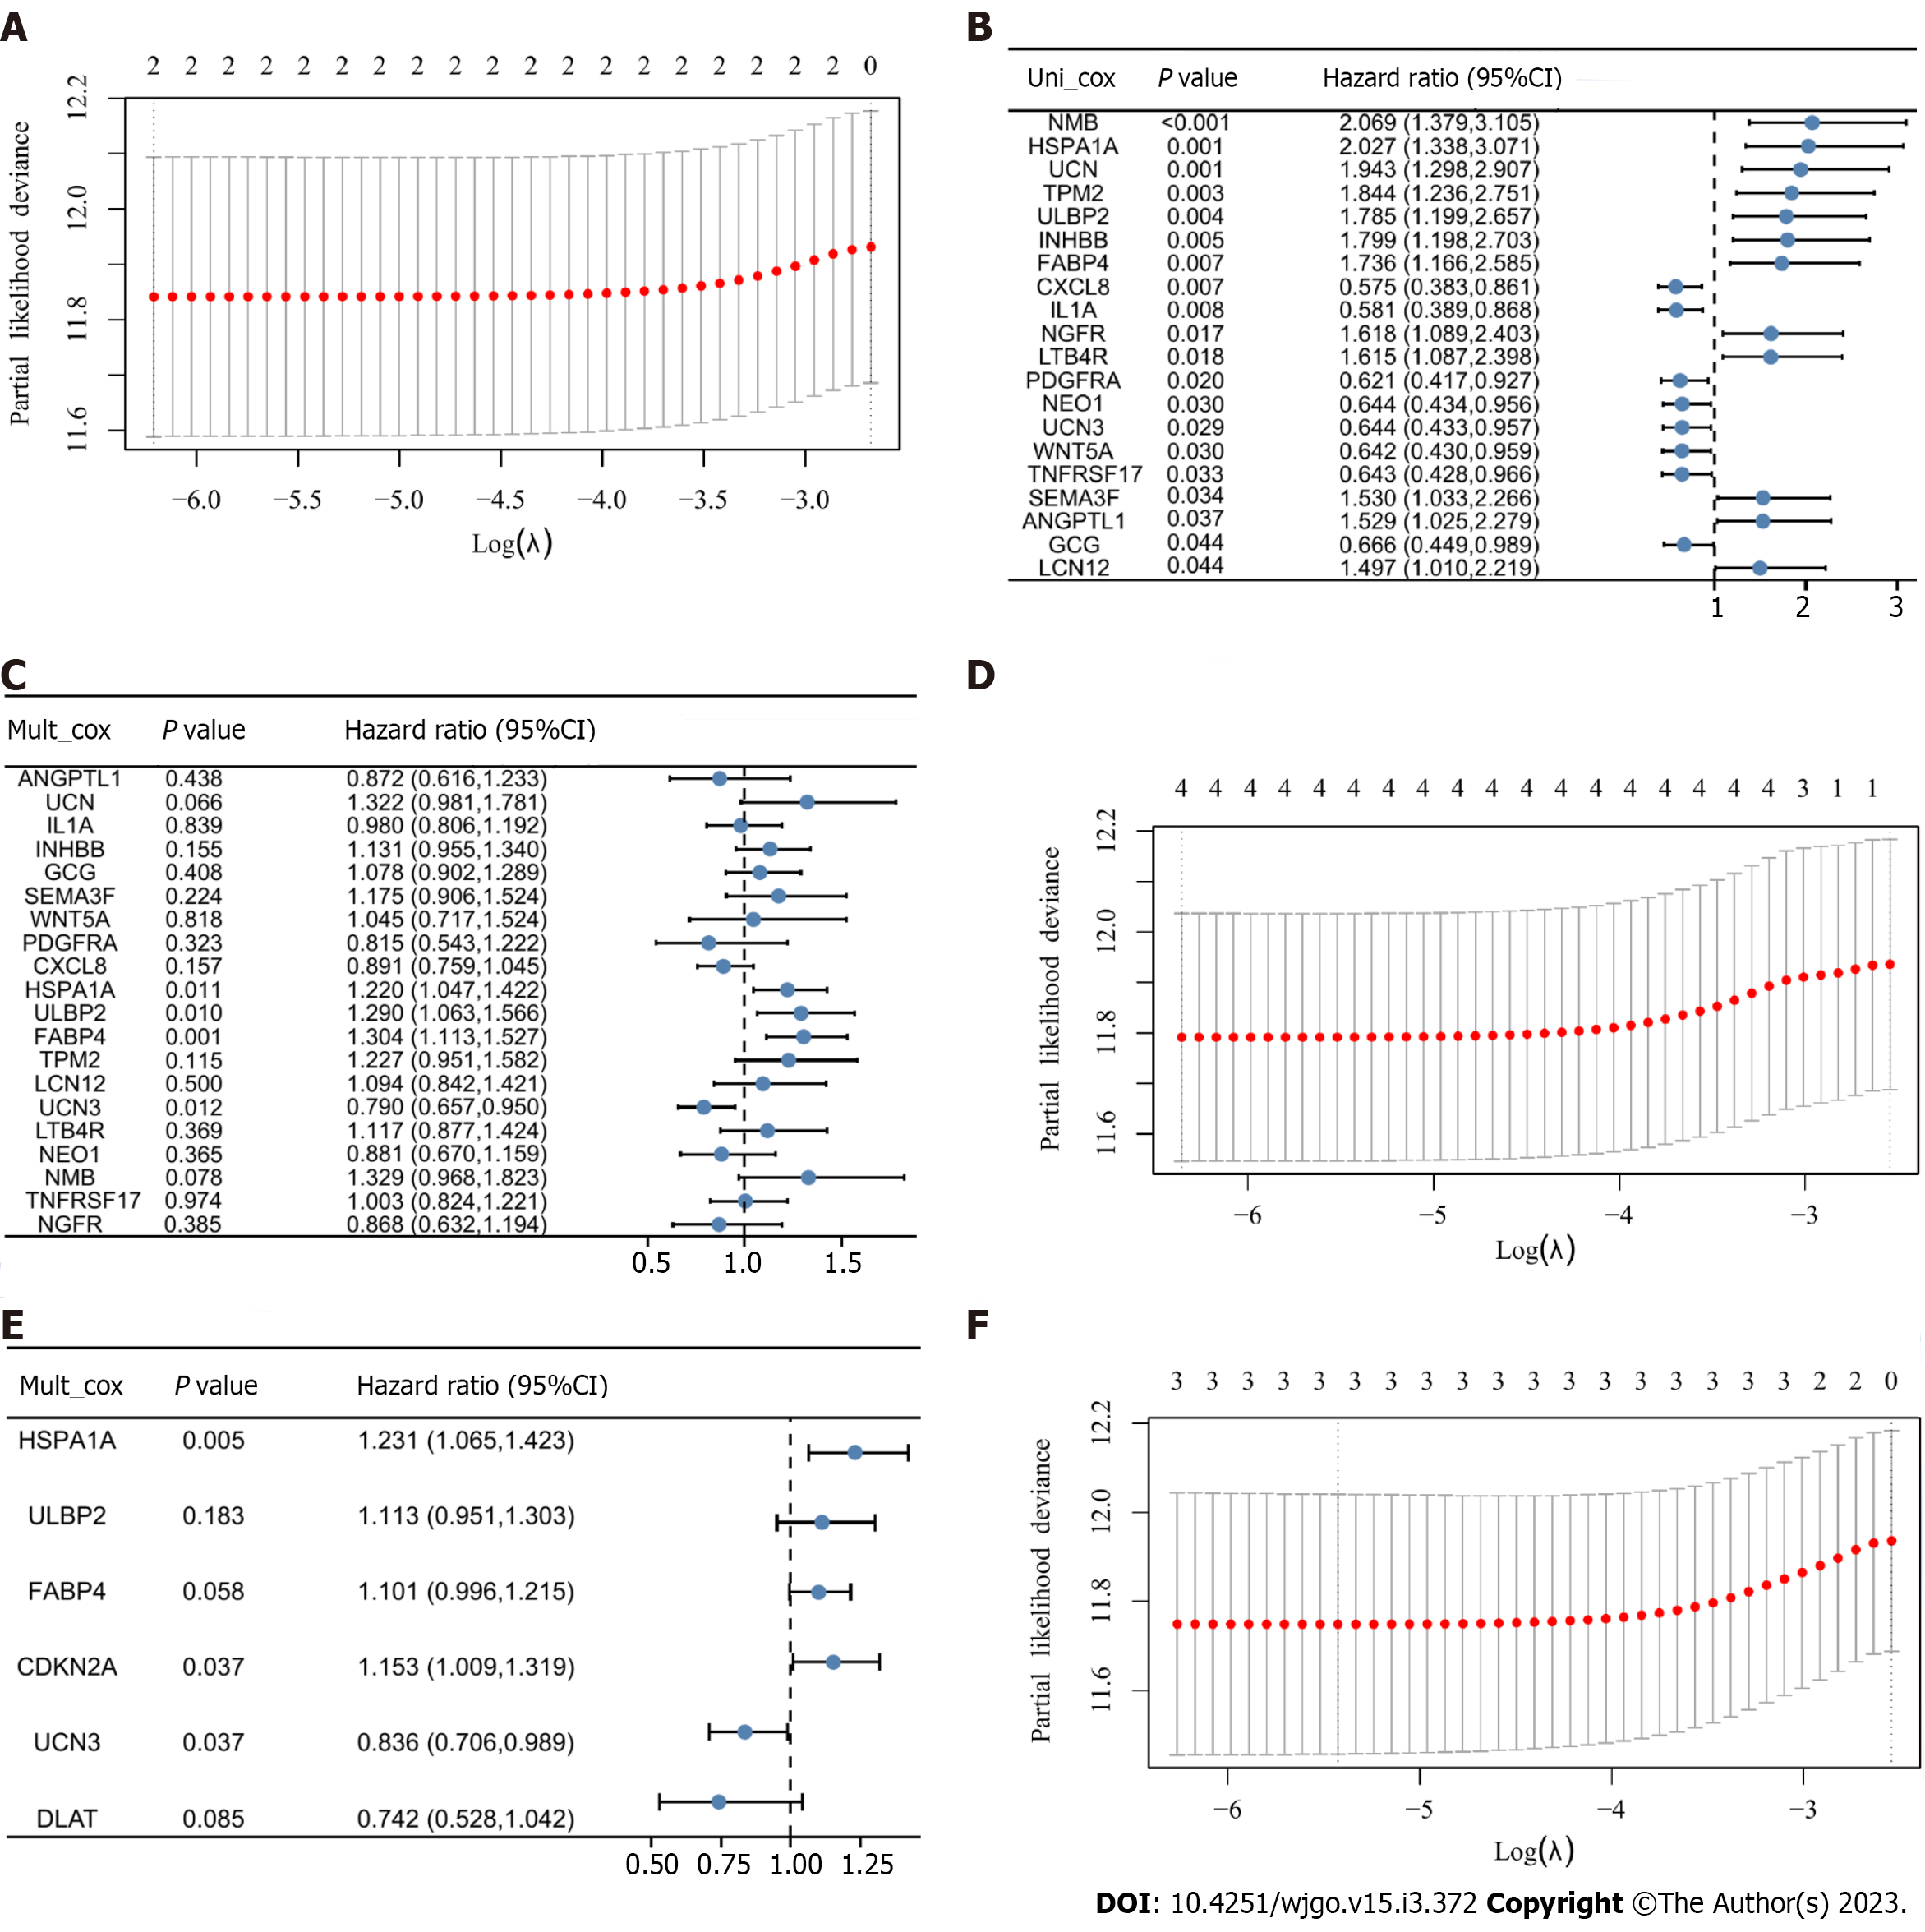
Figure 3 Identification of prognostic features and construction of risk scoring models.
A: Coefficient screening plot generated when the model was constructed using least absolute shrinkage and selection operator (LASSO) regression analysis with CDKN2A and DLAT as variables. When λ takes the minimum value, it is the best model; B: Univariate Cox regression analysis of immune-related differentially expressed genes (IR-DEGs) showed significant results; C: Multivariate Cox regression analysis of IR-DEGs identified four genes independently associated with prognosis; D: Coefficient screening plots generated when the model was constructed using LASSO regression analysis with UCN3, HSPA1A, ULBP2, and FABP4 as variables. When λ takes the minimum value, it is the best model; E: Multivariate Cox regression analysis of two cuproptosis-related (CR)-DEGs and four IR-DEGs. CIR-DEGs with P < 0.05 were independently associated with prognosis; F: Coefficient screening plots when the model was constructed with the selected CDKN2A, HSPA1A, and UCN3 variables.
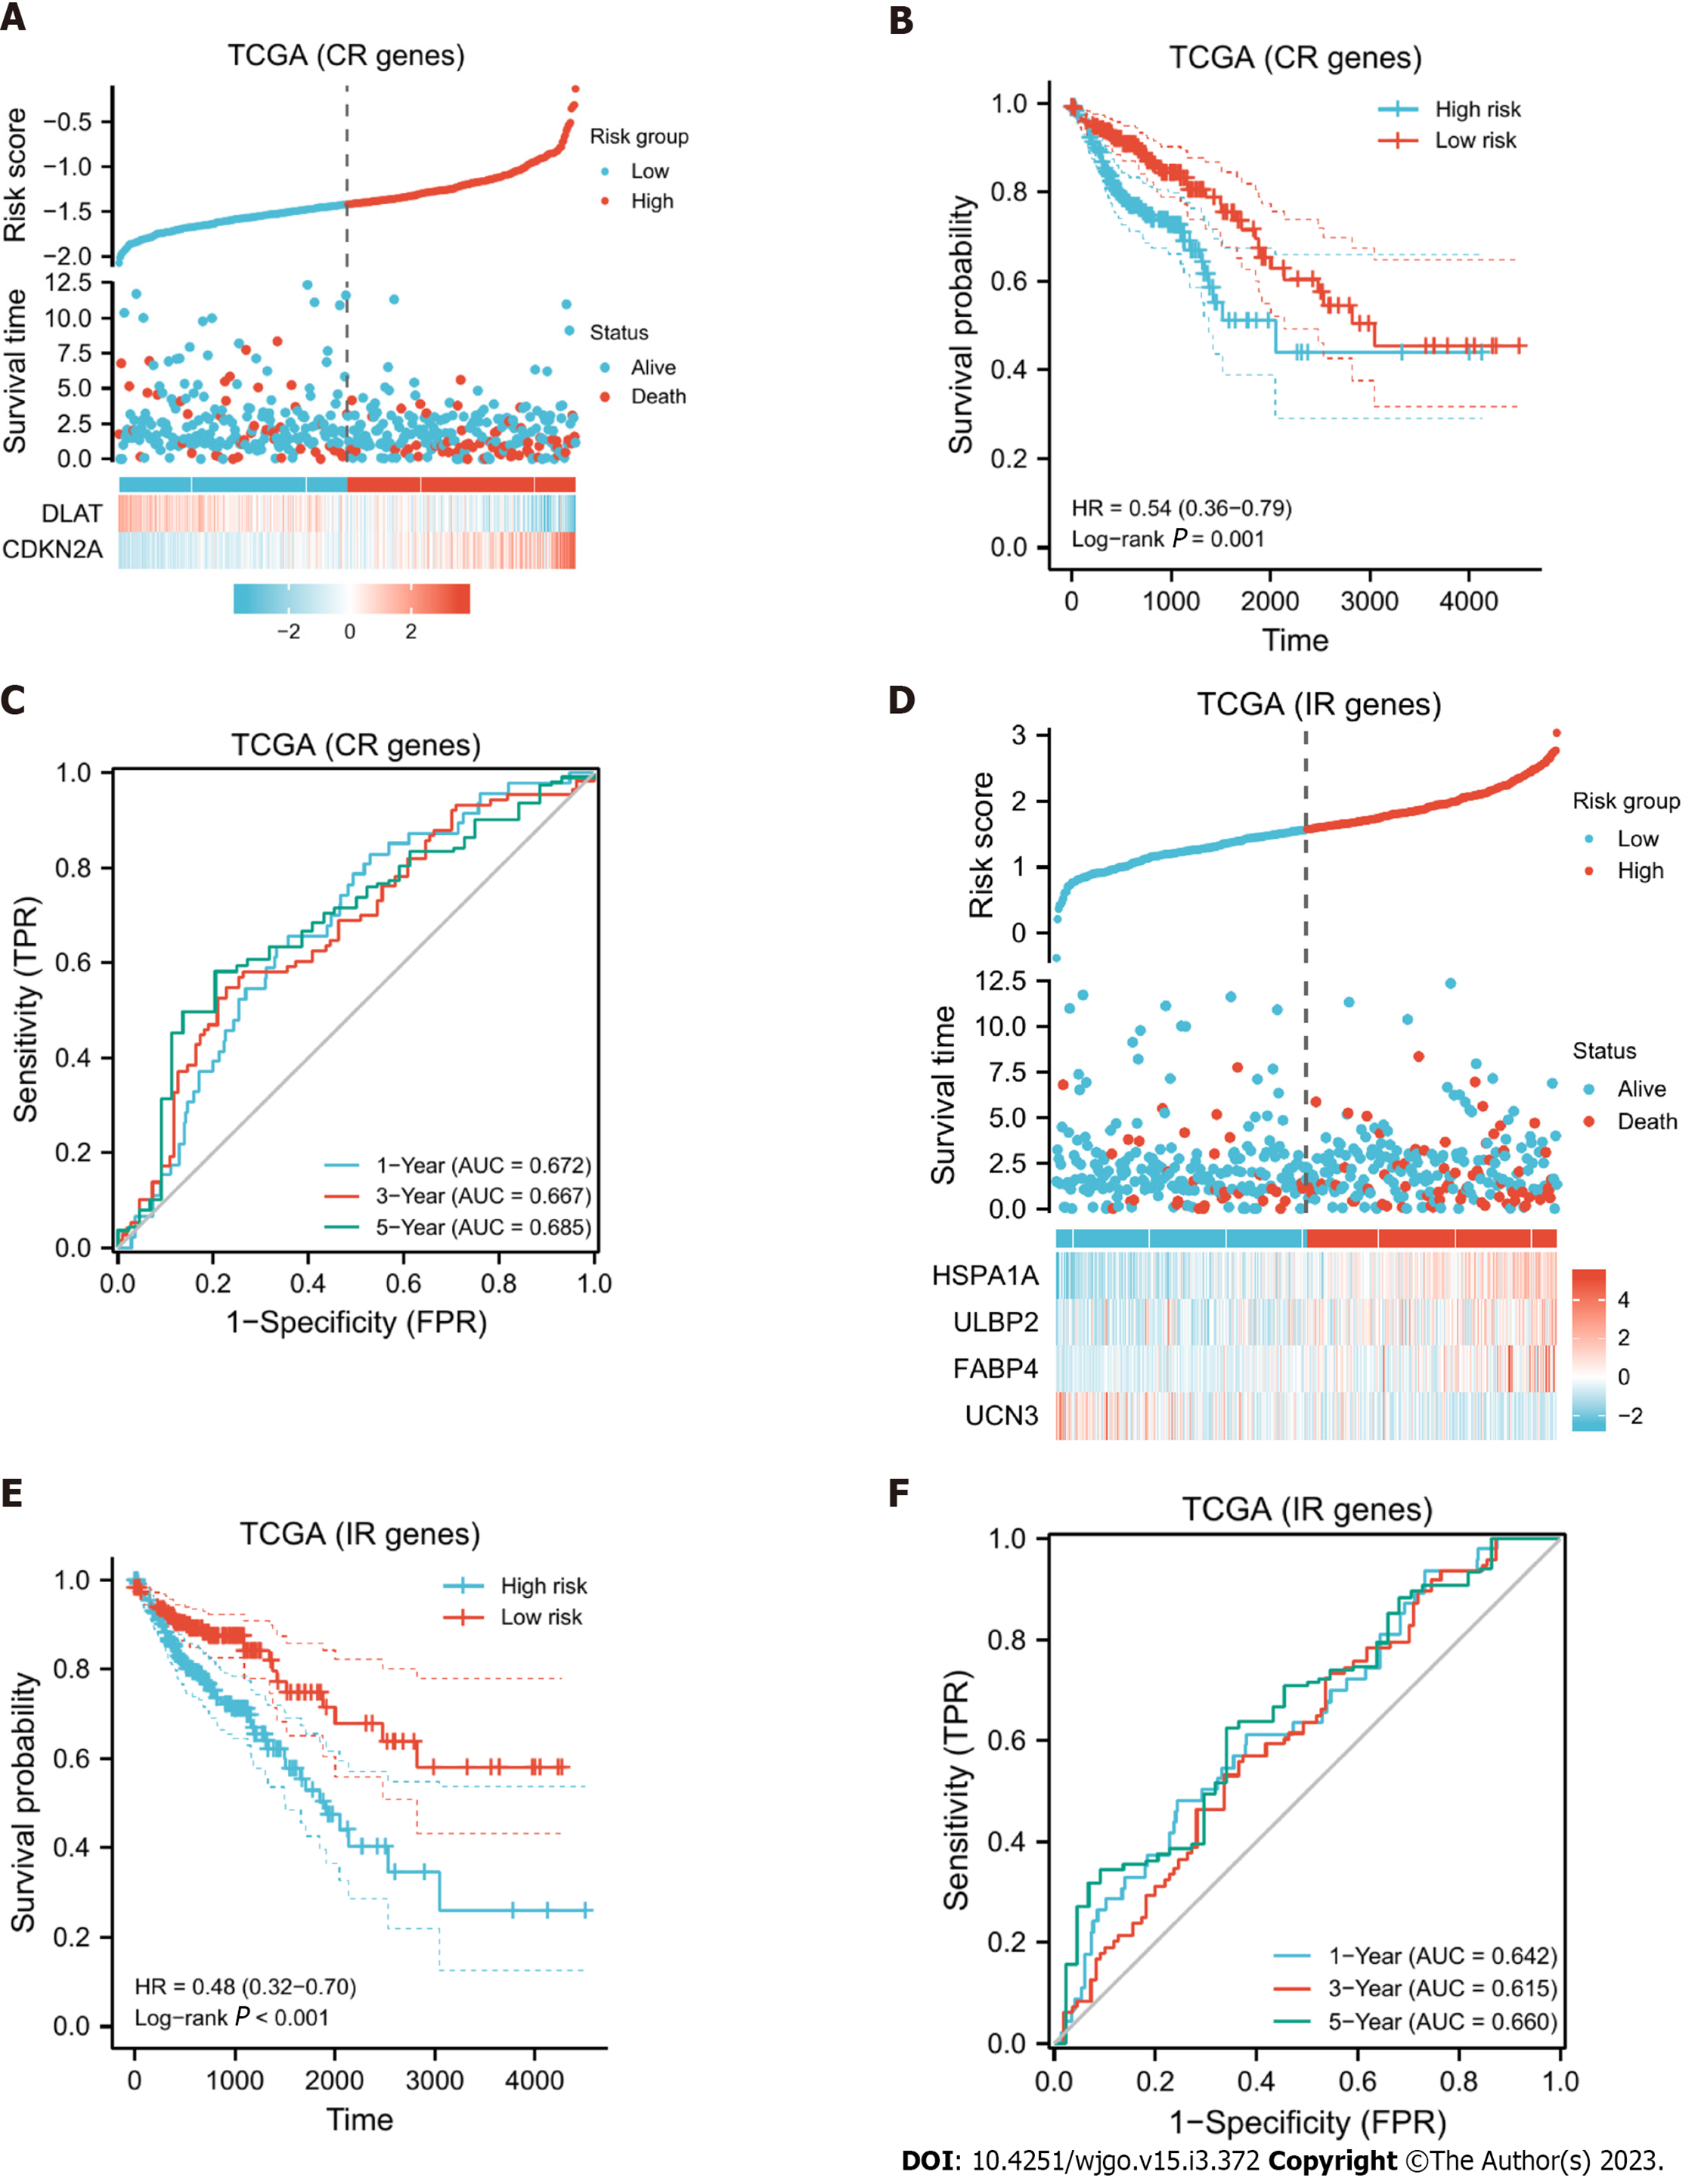
Figure 4 Model evaluation.
A: Expression differences of DLAT and CDKN2A in high- and low-risk groups and the risk scores and survival time of different subgroups are shown; B: KM curve of the cuproptosis-related (CR) model. The higher the CR risk score was, the worse the prognosis. In the figure, high-risk group was taken as the control group, so the low-risk score is a protective factor with the HR < 1; C: Receiver operating characteristic (ROC) curve of the CR model, and the size of the area under the curve can reveal the quality of the model. In the figure, the area under the curve (AUC) values in years 1, 3, and 5 are all greater than 0.6, indicating that the model has strong predictive ability; D: Expression differences of the four immune-related (IR) differentially expressed genes used to construct the model in the high- and low-risk groups and the risk scores and survival times of different subgroups are shown; E: KM curve of the IR model; the higher the risk score was, the worse the prognosis; F: ROC curve of the IR model, and its AUC values at 1, 3, and 5 years were all greater than 0.6. TCGA: The Cancer Genome Atlas database.
Figure 5 External validation.
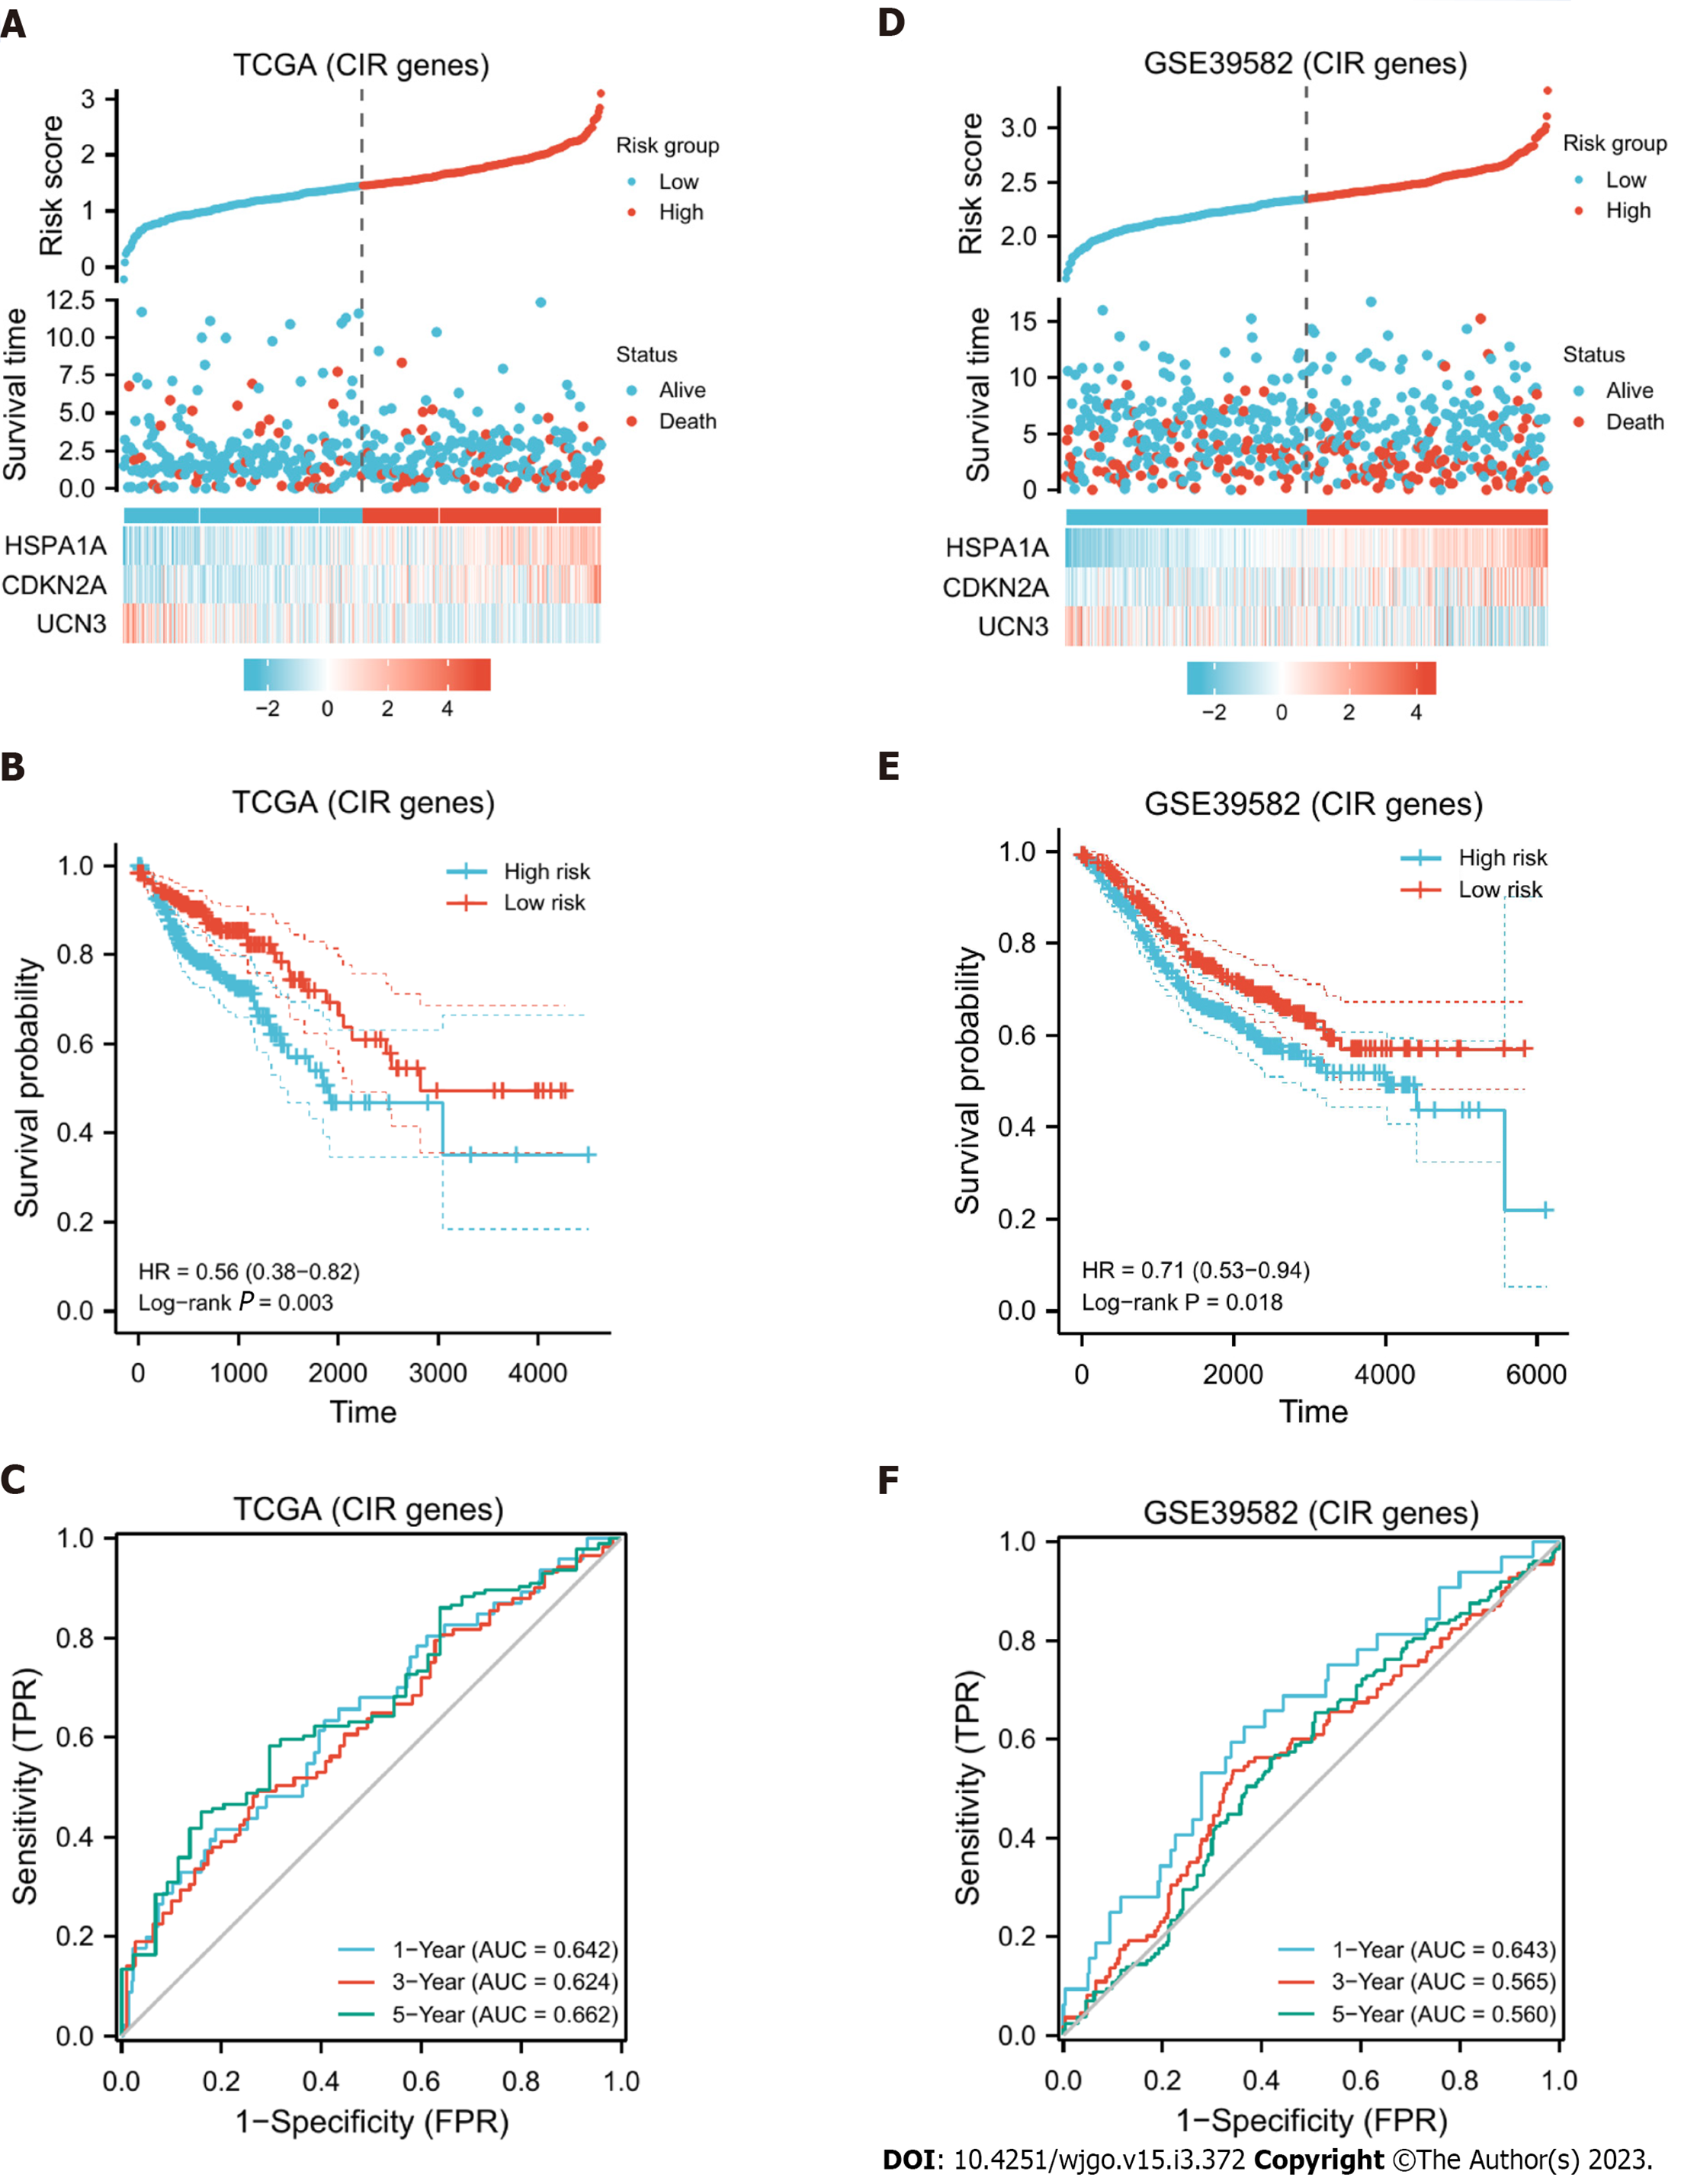
Based on CDKN2A, HSPA1A, and UCN3, a cuproptosis- and immune-related prognostic model was constructed. In samples of The Cancer Genome Atlas (TCGA) database. A: Expression differences of these three genes in high- and low-risk groups and the risk score and survival time of different subgroups; B: KM curve indicates that the higher the score is, the worse the prognosis; C: Receiver operating characteristic curve shows that the model has area under the curve values greater than 0.6 in years 1, 3, and 5; D-F: In the Gene Expression Omnibus database, the model obtained similar results, and P < 0.05.
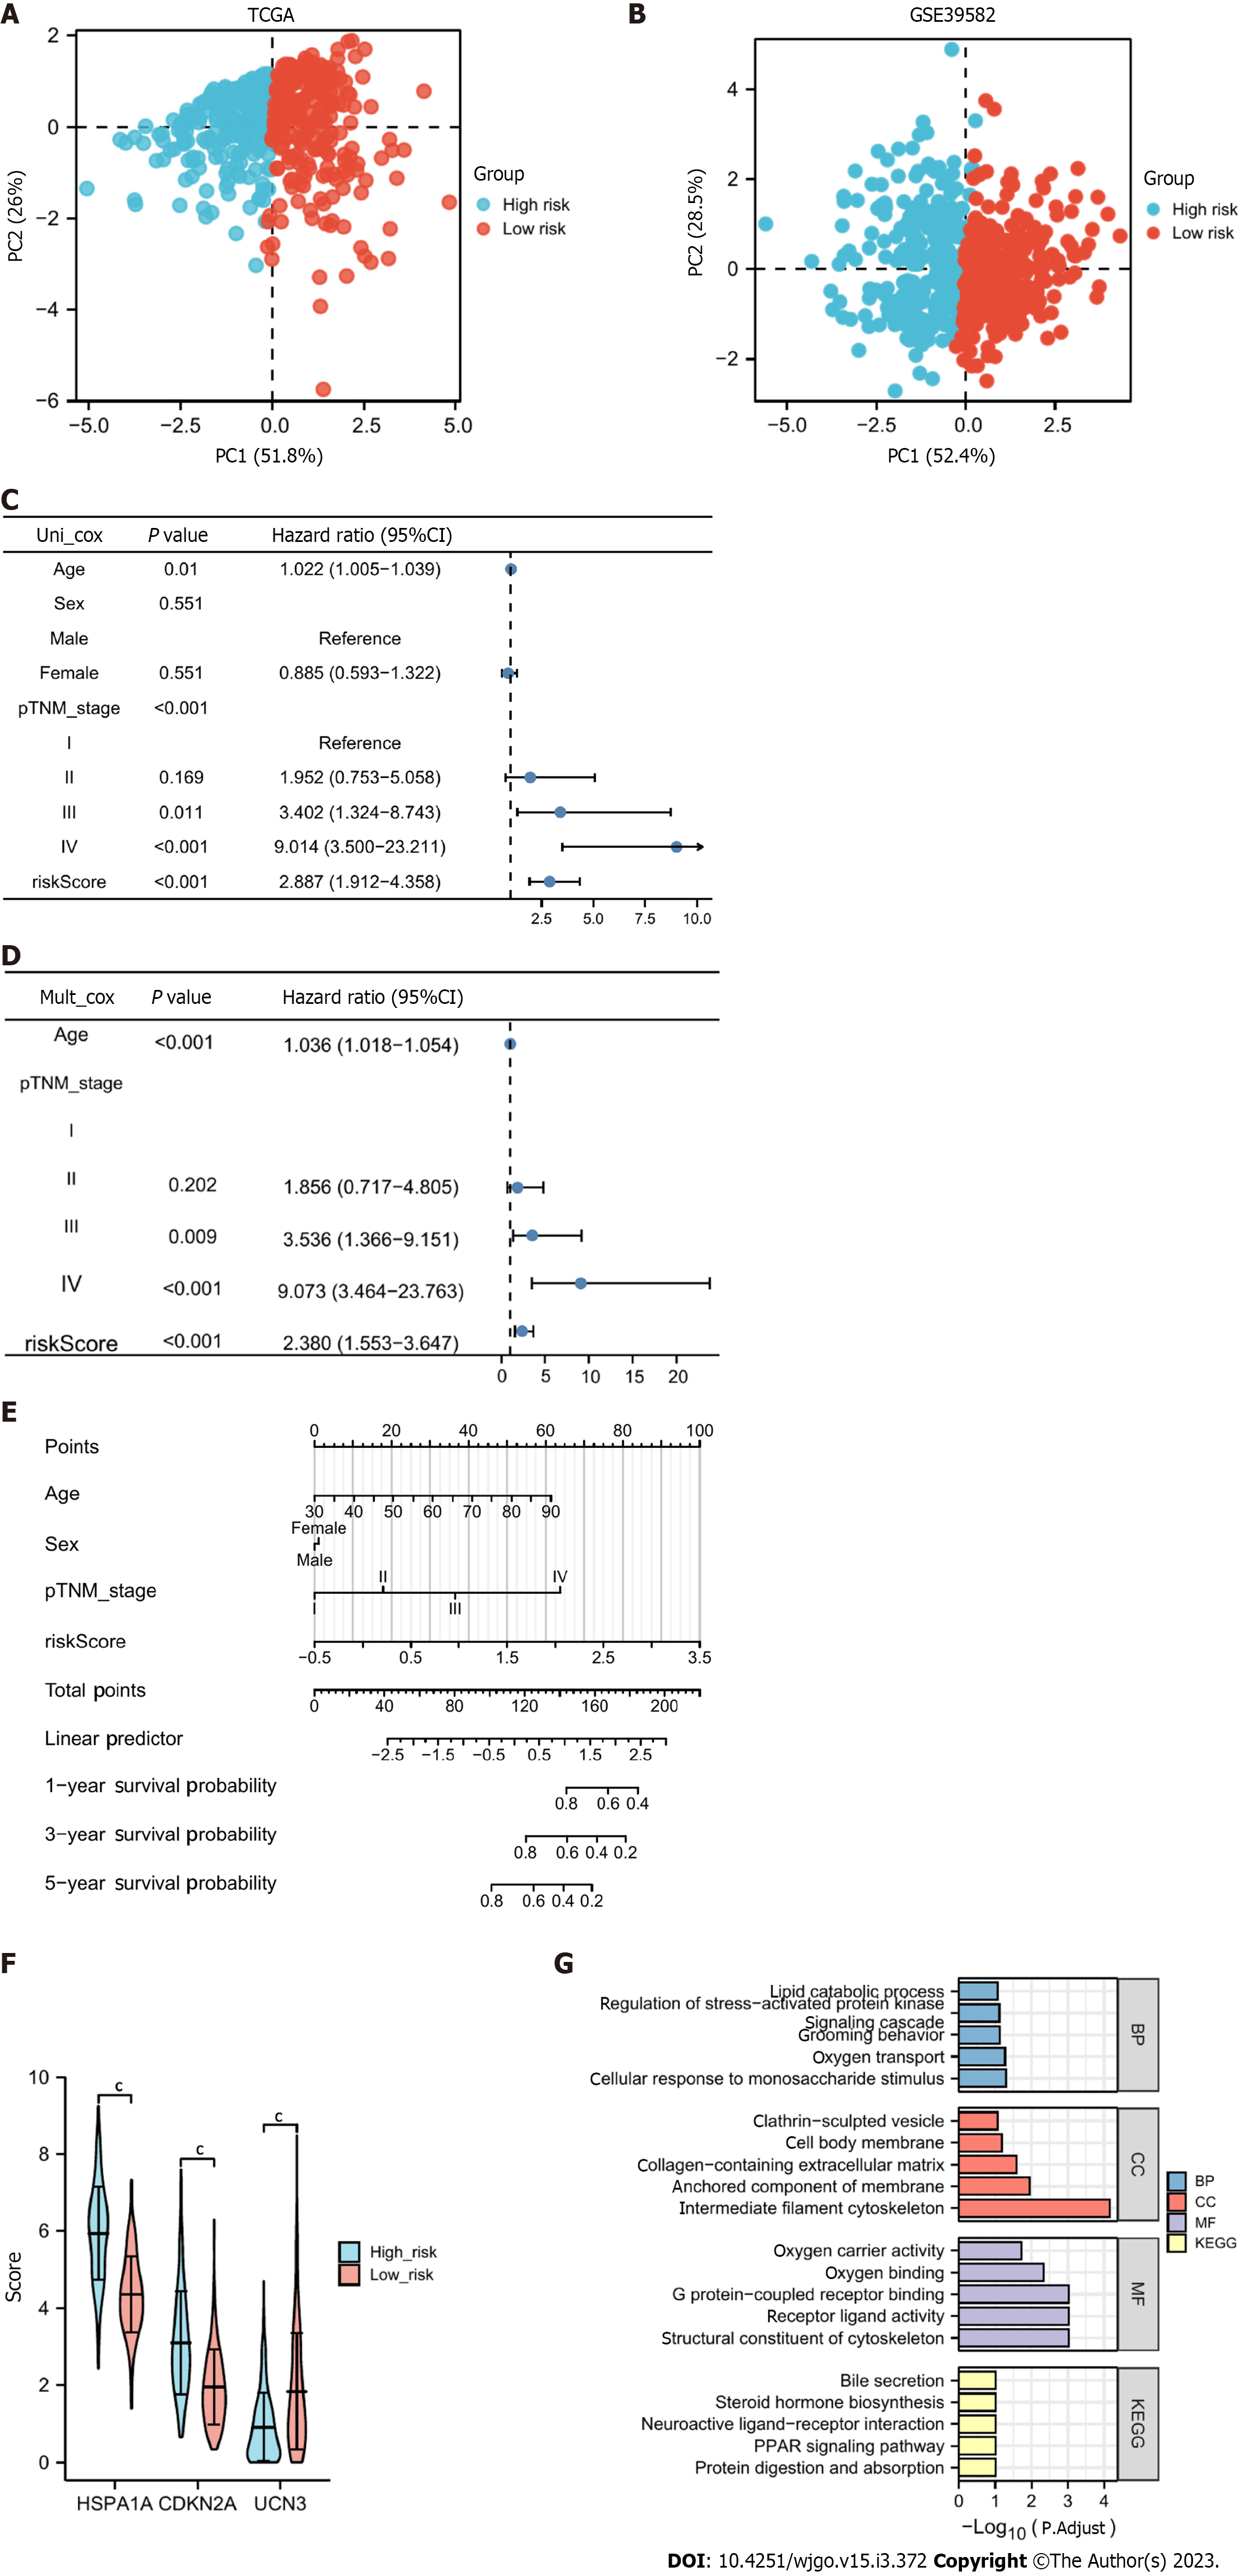
Figure 6 Principal component analysis and the independent predictive value of the risk score.
A and B: The principal component analysis plots in The Cancer Genome Atlas (TCGA) and Gene Expression Omnibus, respectively, and both high- and low-risk groups can be obviously distinguished; C and D: Univariate and multivariate Cox regression analyses of the cuproptosis- and immune-related risk score and other clinical features to screen for factors independently associated with prognosis; E: A nomogram helps predict a patient’s prognosis based on the patient’s information; F: Differential expression of CDKN2A, HSPA1A, and UCN3 in the high- and low-risk groups; G: Functional enrichment consequences of differentially expressed genes in the high- and low-risk groups. cP < 0.001.
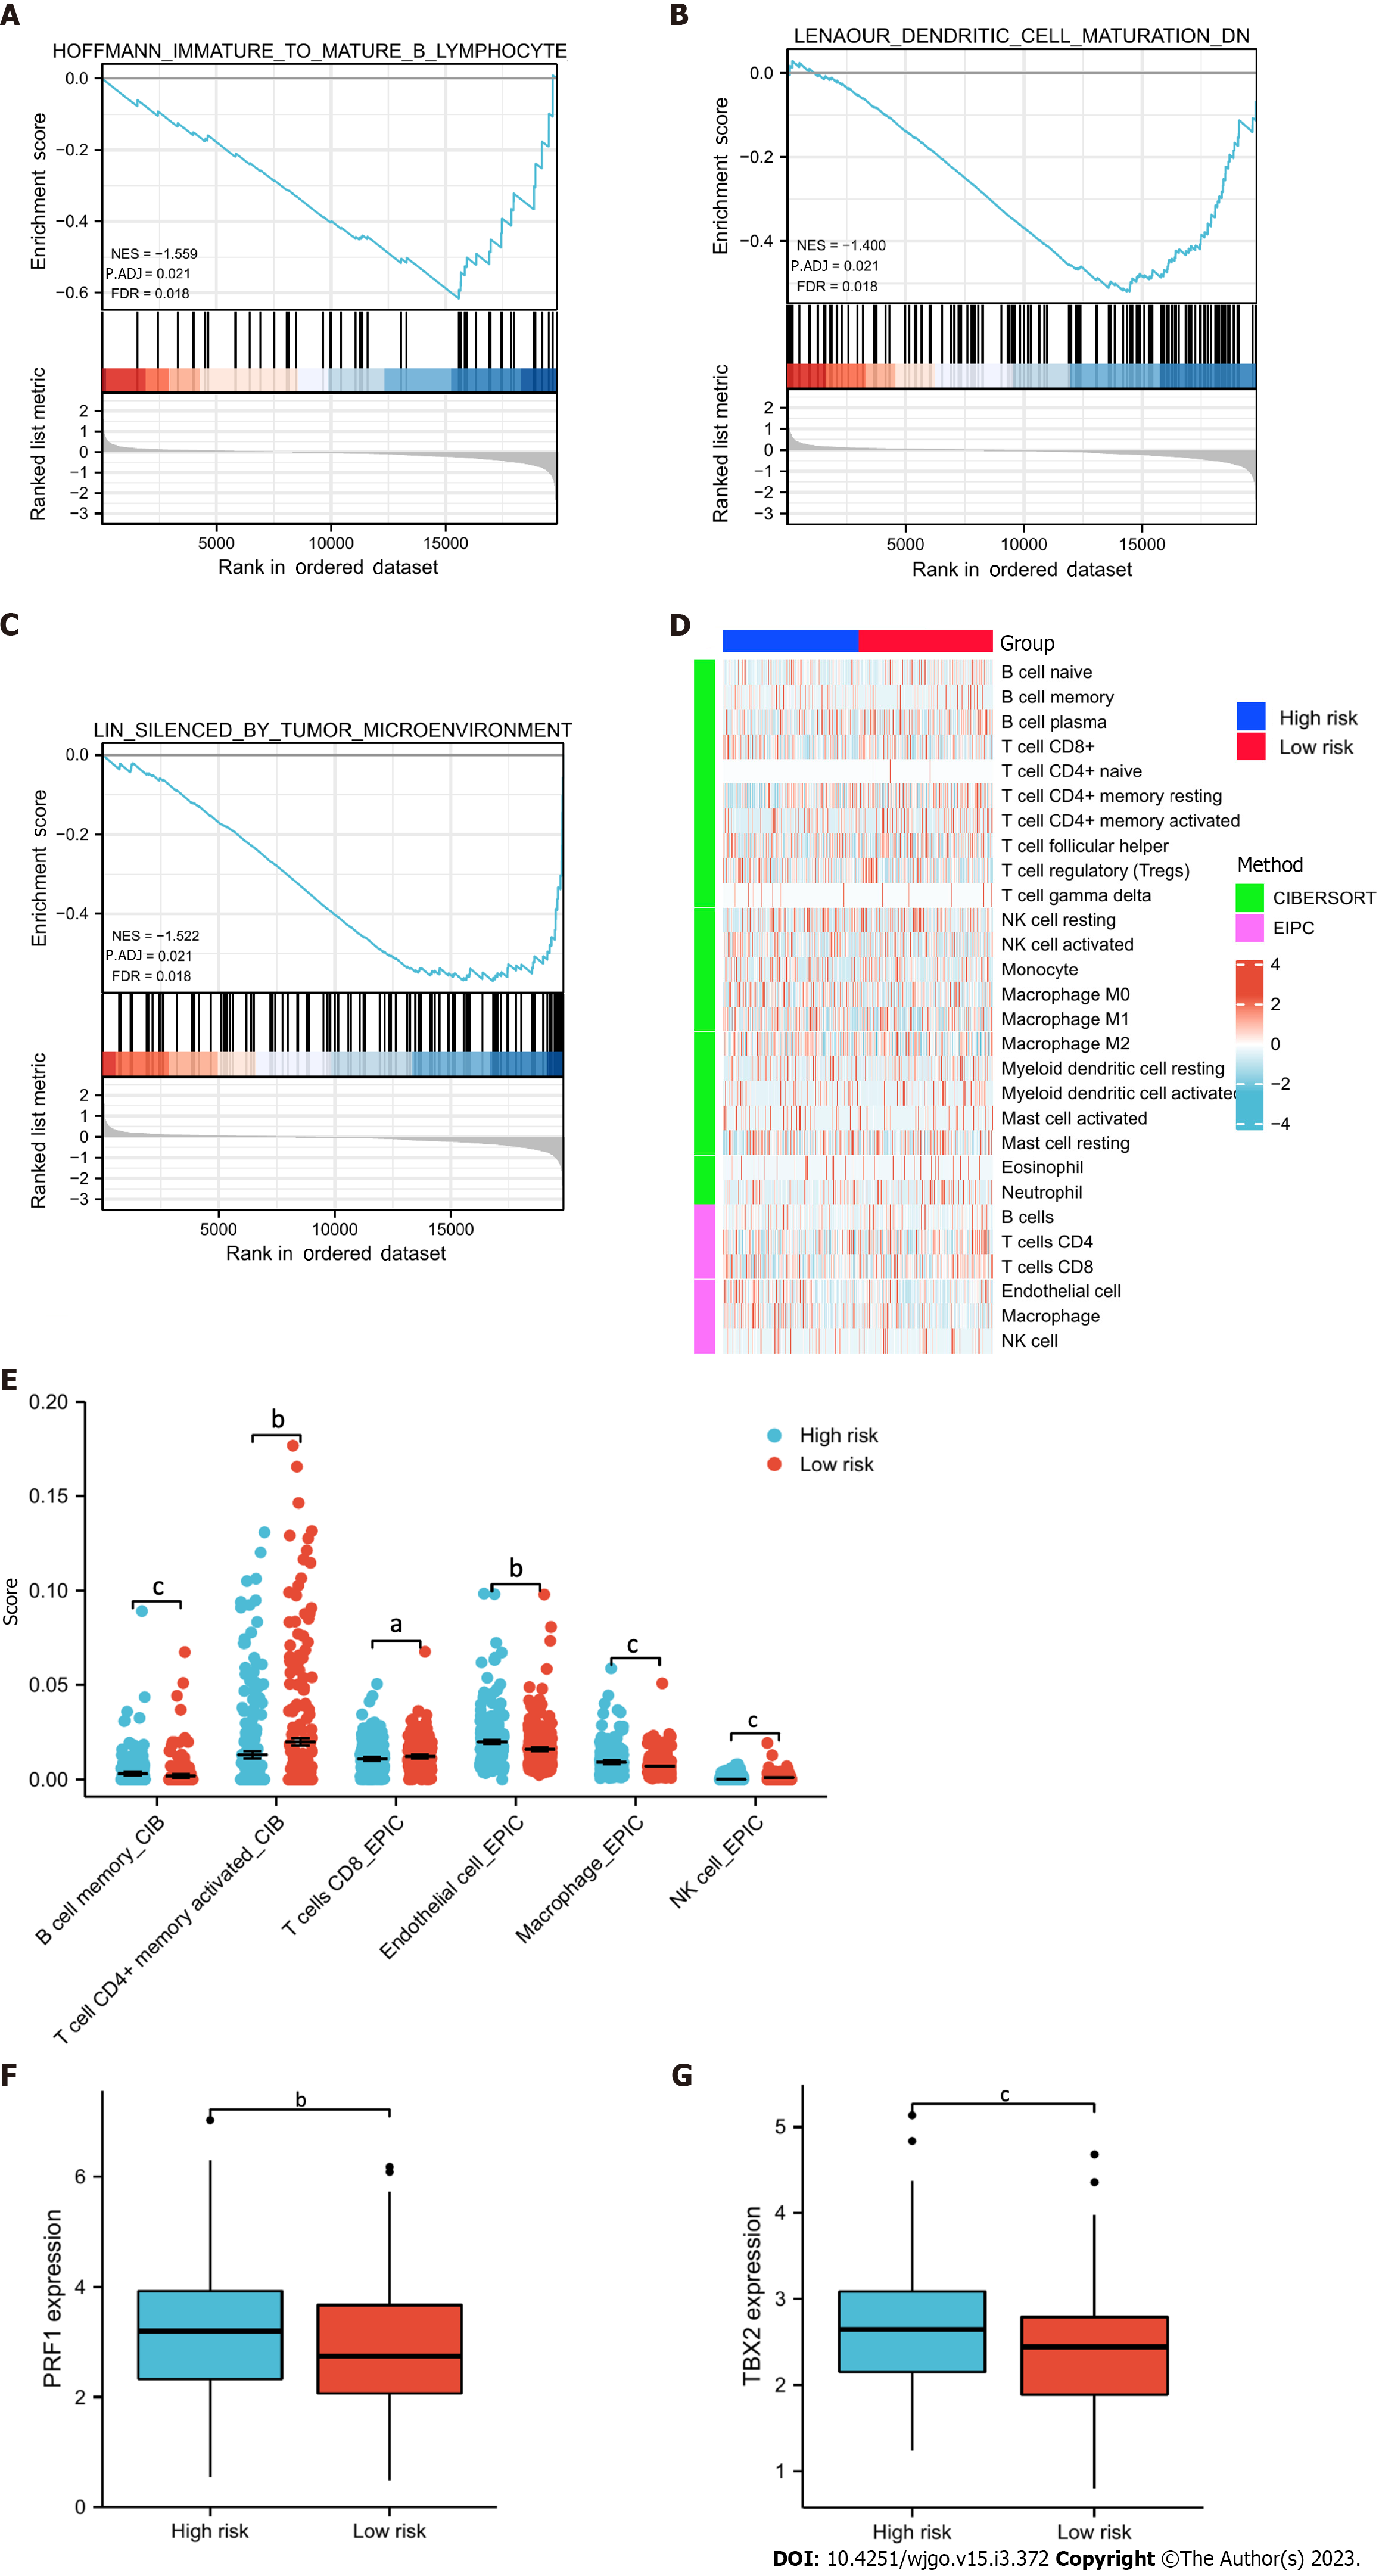
Figure 7 Functional enrichment and immune profiling.
A-C: Gene set enrichment analysis functional enrichment results of differentially expressed genes in the high- and low-risk groups; D: Heatmap showing the infiltrating abundance of different immune cells in different groups analyzed by CIBERSORT and EPIC algorithms; E: Significant (P < 0.05) results presented in immune infiltration analysis; F and G: Differential expression of genes related to immune checkpoint inhibitors in the high- and low-risk groups. Both were highly expressed in the high-risk group. aP < 0.05; bP < 0.01; cP < 0.001.
- Citation: Huang YY, Bao TY, Huang XQ, Lan QW, Huang ZM, Chen YH, Hu ZD, Guo XG. Machine learning algorithm to construct cuproptosis- and immune-related prognosis prediction model for colon cancer. World J Gastrointest Oncol 2023; 15(3): 372-388
- URL: https://www.wjgnet.com/1948-5204/full/v15/i3/372.htm
- DOI: https://dx.doi.org/10.4251/wjgo.v15.i3.372


